Pleasant Hill, Iowa

Pleasant Hill: my back yard

Pleasant Hill: Looking East from the Warren's Home / Pleasant Hill "Flowers of June"
- add
your
Submit your own pictures of this city and show them to the world
- OSM Map
- General Map
- Google Map
- MSN Map

Population change since 2000: +120.6%
| Males: 5,241 | |
| Females: 5,945 |
| Median resident age: | 41.8 years |
| Iowa median age: | 39.1 years |
Zip codes: 50317.
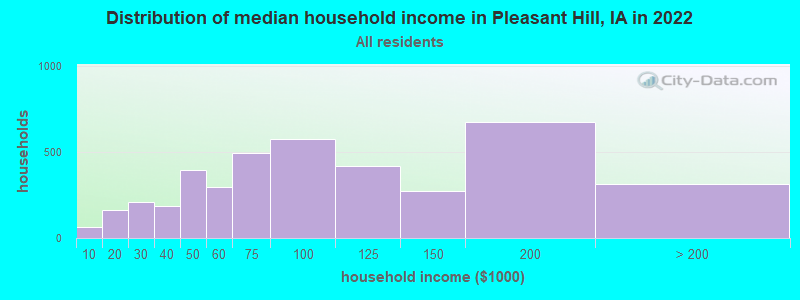
| Pleasant Hill: | $84,077 |
| IA: | $71,433 |
Estimated per capita income in 2023: $39,254 (it was $25,316 in 2000)
Pleasant Hill city income, earnings, and wages data
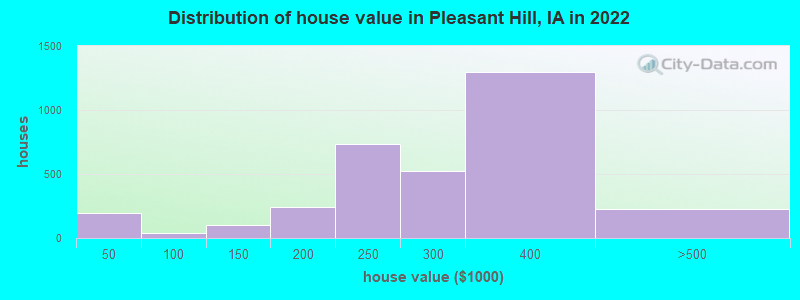
Estimated median house or condo value in 2023: $310,291 (it was $117,300 in 2000)
| Pleasant Hill: | $310,291 |
| IA: | $213,300 |
Mean prices in 2023: all housing units: $326,439; detached houses: $345,399; townhouses or other attached units: $300,288; mobile homes: $24,237
Median gross rent in 2023: $1,229.
(9.5% for White Non-Hispanic residents, 27.0% for Black residents, 6.3% for Hispanic or Latino residents, 25.6% for American Indian residents, 12.8% for other race residents, 0.4% for two or more races residents)
Detailed information about poverty and poor residents in Pleasant Hill, IA


Compare current foreclosures near Pleasant Hill, IA:
| Photo | Address | Area | Beds / Baths | Price | Details |
|---|---|---|---|---|---|

|
#1
Sherrylynn Blvd
Pleasant Hill, IA 50327
|
2,023 sq. feet
|
2 baths 4 beds |
show details | |

|
#2
Parkwood Blvd
Pleasant Hill, IA 50327
|
968 sq. feet
|
1 baths 3 beds |
show details | |

|
#3
Hillcrest Dr
Pleasant Hill, IA 50327
|
1,764 sq. feet
|
1 baths 4 beds |
show details | |

|
#4
Sherrylynn Blvd # 6
Pleasant Hill, IA 50327
|
- sq. feet
|
- baths - beds |
show details | |

|
#5
Locust St
West Des Moines, IA 50265
|
1,224 sq. feet
|
1 baths 2 beds |
$159,000
|
show details |

|
#6
SW 5th St
Des Moines, IA 50315
|
720 sq. feet
|
1 baths 2 beds |
$145,000
|
show details |

|
#7
Oak Park Ave
Des Moines, IA 50313
|
2,174 sq. feet
|
2 baths 4 beds |
show details | |

|
#8
Hackley Ave
Des Moines, IA 50315
|
1,216 sq. feet
|
1 baths 2 beds |
show details | |

|
#9
Hardin Dr Apt 3
Carlisle, IA 50047
|
1,142 sq. feet
|
2 baths 3 beds |
show details | |

|
#10
Evans St
Des Moines, IA 50315
|
834 sq. feet
|
2 baths 3 beds |
show details |
| Photo | Address | Area | Beds / Baths | Price | Details |
|---|---|---|---|---|---|

|
#11
Spring St
Des Moines, IA 50315
|
1,088 sq. feet
|
2 baths 2 beds |
show details | |

|
#12
SW 13th Pl
Des Moines, IA 50315
|
1,473 sq. feet
|
2 baths 3 beds |
show details | |

|
#13
Emma Ave
Des Moines, IA 50315
|
2,124 sq. feet
|
3 baths 3 beds |
show details | |

|
#14
23rd St
Des Moines, IA 50312
|
1,341 sq. feet
|
2 baths 2 beds |
show details | |

|
#15
17th St
Des Moines, IA 50314
|
918 sq. feet
|
1 baths 2 beds |
show details | |

|
#16
S 4th St
Carlisle, IA 50047
|
1,159 sq. feet
|
2 baths 3 beds |
show details | |

|
#17
School St
Des Moines, IA 50311
|
1,053 sq. feet
|
1 baths 2 beds |
show details | |

|
#18
SW 13th Pl
Des Moines, IA 50315
|
922 sq. feet
|
1 baths 3 beds |
show details | |

|
#19
E Burnham Ave
Des Moines, IA 50315
|
1,328 sq. feet
|
2 baths 3 beds |
show details | |

|
#20
SW 14th St
Des Moines, IA 50315
|
1,048 sq. feet
|
1 baths 2 beds |
show details |
| Photo | Address | Area | Beds / Baths | Price | Details |
|---|---|---|---|---|---|

|
#21
NE 3rd St
Des Moines, IA 50313
|
1,076 sq. feet
|
2 baths 2 beds |
show details | |

|
#22
Frazier Ave
Des Moines, IA 50315
|
925 sq. feet
|
1 baths 2 beds |
show details | |

|
#23
Crescent Dr
Des Moines, IA 50312
|
2,532 sq. feet
|
5 baths 4 beds |
show details | |

|
#24
Bundy St
Des Moines, IA 50315
|
770 sq. feet
|
2 baths 2 beds |
show details | |

|
#25
41st St
Des Moines, IA 50312
|
1,488 sq. feet
|
2 baths 3 beds |
show details | |

|
#26
Brinkwood Rd
Des Moines, IA 50310
|
1,093 sq. feet
|
2 baths 3 beds |
show details | |

|
#27
Tailfeather Dr NW
Bondurant, IA 50035
|
1,796 sq. feet
|
2 baths 4 beds |
show details | |

|
#28
Adams Ave
Des Moines, IA 50310
|
1,744 sq. feet
|
2 baths 3 beds |
show details | |

|
#29
NE 70th Ave
Bondurant, IA 50035
|
2,665 sq. feet
|
3 baths 3 beds |
show details | |

|
#30
Thornton Ave
Des Moines, IA 50321
|
2,611 sq. feet
|
3 baths 4 beds |
show details |
| Photo | Address | Area | Beds / Baths | Price | Details |
|---|---|---|---|---|---|

|
#31
NE 11th Ct
Ankeny, IA 50023
|
2,473 sq. feet
|
3 baths 3 beds |
show details | |

|
#32
Elizabeth Ln NW
Bondurant, IA 50035
|
2,208 sq. feet
|
2 baths 3 beds |
show details | |

|
#33
Madison Ave
Des Moines, IA 50310
|
1,279 sq. feet
|
1 baths 4 beds |
show details | |

|
#34
Luster Ln
Des Moines, IA 50315
|
855 sq. feet
|
1 baths 3 beds |
show details | |

|
#35
37th St
Des Moines, IA 50310
|
832 sq. feet
|
1 baths 2 beds |
show details | |

|
#36
13th St SE
Bondurant, IA 50035
|
1,276 sq. feet
|
2 baths 3 beds |
show details | |

|
#37
Center St
Des Moines, IA 50312
|
1,260 sq. feet
|
1 baths 2 beds |
show details | |

|
#38
Martin Luther King Jr Pkwy
Des Moines, IA 50310
|
849 sq. feet
|
1 baths 3 beds |
show details | |

|
#39
32nd St
Des Moines, IA 50311
|
1,606 sq. feet
|
4 baths 4 beds |
show details | |

|
#40
SW 18th St
Des Moines, IA 50315
|
672 sq. feet
|
1 baths 2 beds |
show details |
| Photo | Address | Area | Beds / Baths | Price | Details |
|---|---|---|---|---|---|

|
#41
SW 15th St
Des Moines, IA 50315
|
1,040 sq. feet
|
1 baths 3 beds |
show details | |

|
#42
7th St
Des Moines, IA 50313
|
1,387 sq. feet
|
1 baths 3 beds |
show details | |

|
#43
SW 13th St
Des Moines, IA 50315
|
2,032 sq. feet
|
2 baths 3 beds |
show details | |

|
#44
Lewis Ave
Des Moines, IA 50315
|
672 sq. feet
|
1 baths 2 beds |
show details | |

|
#45
Oak Park Ave
Des Moines, IA 50313
|
3,109 sq. feet
|
3 baths 5 beds |
show details | |

|
#46
Hillside Ave
Des Moines, IA 50315
|
1,144 sq. feet
|
2 baths 3 beds |
show details | |

|
#47
SW 2nd St
Des Moines, IA 50315
|
960 sq. feet
|
1 baths 3 beds |
show details | |

|
#48
Creston Ave
Des Moines, IA 50315
|
1,429 sq. feet
|
2 baths 3 beds |
show details | |

|
#49
Cambridge St
Des Moines, IA 50313
|
672 sq. feet
|
1 baths 2 beds |
show details | |

|
Check over 1 million property listings on Foreclosure.com!
|
browse all offers | |||


- 8,82480.5%White alone
- 8537.8%Hispanic
- 5485.0%Black alone
- 4153.8%Asian alone
- 2512.3%Two or more races
- 10.01%American Indian alone
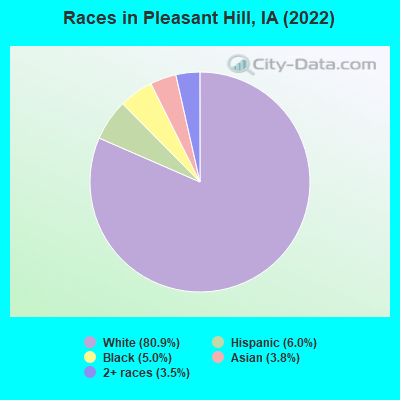
Races in Pleasant Hill detailed stats: ancestries, foreign born residents, place of birth
According to our research of Iowa and other state lists, there were 8 registered sex offenders living in Pleasant Hill, Iowa as of May 08, 2025.
The ratio of all residents to sex offenders in Pleasant Hill is 1,214 to 1.
The ratio of registered sex offenders to all residents in this city is much lower than the state average.
Type |
2010 |
2011 |
2012 |
2013 |
2014 |
2015 |
2016 |
2017 |
2018 |
2019 |
2020 |
2021 |
2022 |
|---|---|---|---|---|---|---|---|---|---|---|---|---|---|
| Murders (per 100,000) | 0 (0.0) | 0 (0.0) | 0 (0.0) | 0 (0.0) | 0 (0.0) | 0 (0.0) | 0 (0.0) | 1 (10.1) | 0 (0.0) | 0 (0.0) | 1 (9.8) | 0 (0.0) | 0 (0.0) |
| Rapes (per 100,000) | 1 (11.4) | 0 (0.0) | 0 (0.0) | 1 (11.0) | 2 (21.9) | 1 (10.8) | 4 (42.5) | 2 (20.2) | 3 (29.9) | 5 (48.9) | 0 (0.0) | 4 (39.4) | 4 (34.5) |
| Robberies (per 100,000) | 0 (0.0) | 1 (11.3) | 2 (22.3) | 0 (0.0) | 0 (0.0) | 3 (32.4) | 1 (10.6) | 0 (0.0) | 1 (10.0) | 1 (9.8) | 2 (19.7) | 0 (0.0) | 0 (0.0) |
| Assaults (per 100,000) | 11 (125.2) | 15 (169.9) | 12 (133.9) | 5 (55.1) | 9 (98.4) | 11 (119.0) | 21 (223.0) | 10 (100.9) | 20 (199.4) | 17 (166.2) | 4 (39.4) | 15 (147.7) | 13 (112.1) |
| Burglaries (per 100,000) | 76 (865.1) | 80 (905.9) | 57 (636.2) | 37 (407.8) | 24 (262.3) | 47 (508.3) | 76 (807.2) | 53 (534.8) | 41 (408.8) | 60 (586.6) | 39 (383.9) | 59 (581.1) | 4 (34.5) |
| Thefts (per 100,000) | 78 (887.9) | 89 (1,008) | 96 (1,071) | 67 (738.5) | 66 (721.4) | 124 (1,341) | 140 (1,487) | 140 (1,413) | 243 (2,423) | 123 (1,203) | 131 (1,290) | 136 (1,340) | 56 (482.9) |
| Auto thefts (per 100,000) | 15 (170.7) | 18 (203.8) | 11 (122.8) | 8 (88.2) | 6 (65.6) | 6 (64.9) | 21 (223.0) | 26 (262.4) | 43 (428.7) | 37 (361.8) | 28 (275.6) | 18 (177.3) | 11 (94.9) |
| Arson (per 100,000) | 3 (34.1) | 0 (0.0) | 3 (33.5) | 1 (11.0) | 1 (10.9) | 1 (10.8) | 0 (0.0) | 0 (0.0) | 0 (0.0) | 0 (0.0) | 1 (9.8) | 0 (0.0) | 1 (8.6) |
| City-Data.com crime index | 143.9 | 157.4 | 130.7 | 85.0 | 89.6 | 136.6 | 215.6 | 171.4 | 226.6 | 193.4 | 134.0 | 169.5 | 79.3 |
The City-Data.com crime index weighs serious crimes and violent crimes more heavily. Higher means more crime, U.S. average is 240.7. It adjusts for the number of visitors and daily workers commuting into cities.
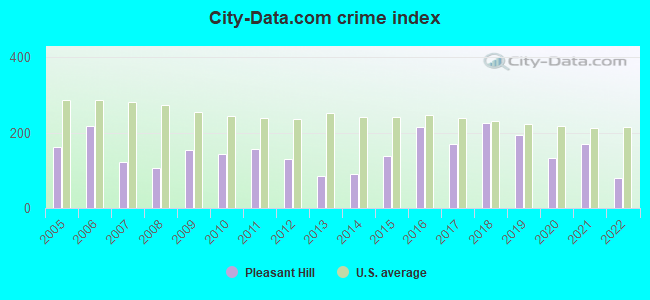
Crime rate in Pleasant Hill detailed stats: murders, rapes, robberies, assaults, burglaries, thefts, arson
Full-time law enforcement employees in 2023, including police officers: 23 (21 officers - 19 male; 2 female).
| Officers per 1,000 residents here: | 1.79 |
| Iowa average: | 1.81 |
 Recent articles from our blog. Our writers, many of them Ph.D. graduates or candidates, create easy-to-read articles on a wide variety of topics.

 | Neighborhoods in Des Moines (2 replies) |
| Possibly moving to Des Moines - Looking for a lot of info (29 replies) |
| Des Moines traffic (5 replies) |
| Moving to Des Moines from Jacksonville (10 replies) |
| Moving to Des Moines (15 replies) |
| Possible move from NH to IA (13 replies) |
Latest news from Pleasant Hill, IA collected exclusively by city-data.com from local newspapers, TV, and radio stations
Ancestries: German (18.9%), Irish (12.6%), English (8.7%), American (7.7%), European (6.0%), African (4.1%).
Current Local Time: CST time zone
Incorporated on 05/12/1956
Elevation: 860 feet
Land area: 7.84 square miles.
Population density: 1,428 people per square mile (low).

537 residents are foreign born (1.9% Latin America, 1.1% Asia, 0.9% Africa, 0.9% Europe).
| This city: | 4.9% |
| Iowa: | 5.7% |
Median real estate property taxes paid for housing units with mortgages in 2023: $4,823 (1.6%)
Median real estate property taxes paid for housing units with no mortgage in 2023: $5,030 (1.6%)
Nearest city with pop. 50,000+: Des Moines, IA (5.6 miles
, pop. 198,682).
Nearest city with pop. 200,000+: Omaha, NE (131.6 miles
, pop. 390,007).
Nearest city with pop. 1,000,000+: Chicago, IL (301.7 miles
, pop. 2,896,016).
Nearest cities:
Latitude: 41.59 N, Longitude: 93.51 W
Daytime population change due to commuting: -1,110 (-10.1%)
Workers who live and work in this city: 1,114 (22.8%)
Area code commonly used in this area: 515
Property values in Pleasant Hill, IA

Pleasant Hill, Iowa accommodation & food services, waste management - Economy and Business Data
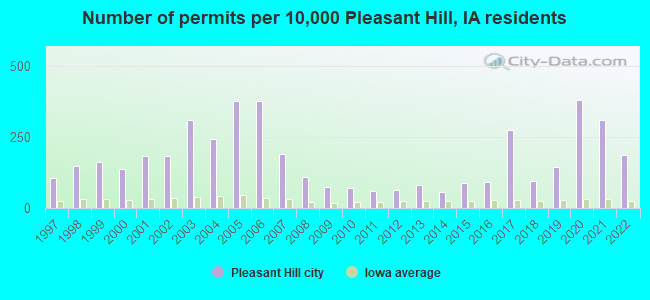
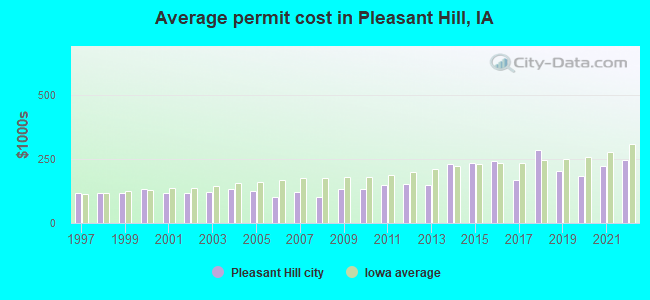
Single-family new house construction building permits:
- 2023: 48 buildings, average cost: $312,300
- 2022: 95 buildings, average cost: $243,800
- 2021: 157 buildings, average cost: $224,100
- 2020: 193 buildings, average cost: $183,000
- 2019: 73 buildings, average cost: $203,200
- 2018: 48 buildings, average cost: $282,900
- 2017: 139 buildings, average cost: $166,300
- 2016: 46 buildings, average cost: $242,800
- 2015: 45 buildings, average cost: $235,500
- 2014: 29 buildings, average cost: $229,000
- 2013: 41 buildings, average cost: $150,000
- 2012: 33 buildings, average cost: $152,500
- 2011: 31 buildings, average cost: $146,500
- 2010: 35 buildings, average cost: $130,800
- 2009: 37 buildings, average cost: $132,400
- 2008: 55 buildings, average cost: $103,400
- 2007: 96 buildings, average cost: $119,900
- 2006: 190 buildings, average cost: $103,100
- 2005: 190 buildings, average cost: $124,100
- 2004: 123 buildings, average cost: $133,800
- 2003: 156 buildings, average cost: $120,100
- 2002: 93 buildings, average cost: $115,600
- 2001: 93 buildings, average cost: $119,100
- 2000: 70 buildings, average cost: $133,300
- 1999: 82 buildings, average cost: $115,800
- 1998: 75 buildings, average cost: $118,900
- 1997: 53 buildings, average cost: $117,300
| Here: | 3.2% |
| Iowa: | 3.1% |
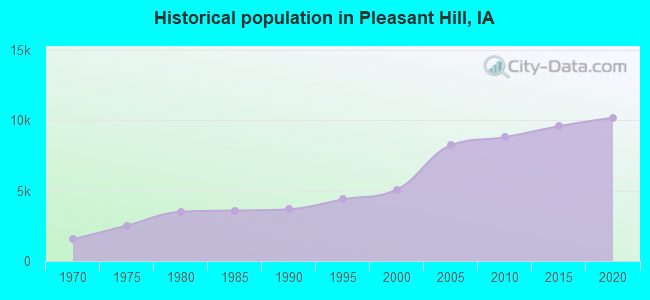
Population change in the 1990s: +1,239 (+32.3%).

- Finance & insurance (11.8%)
- Health care & social assistance (11.8%)
- Educational services (11.7%)
- Retail trade (11.0%)
- Construction (9.5%)
- Accommodation & food services (7.3%)
- Manufacturing (7.1%)

- Construction (17.7%)
- Manufacturing (12.7%)
- Finance & insurance (9.9%)
- Retail trade (9.2%)
- Transportation & warehousing (7.7%)
- Educational services (6.5%)
- Accommodation & food services (6.2%)

- Health care & social assistance (20.5%)
- Educational services (16.6%)
- Finance & insurance (13.7%)
- Retail trade (12.6%)
- Accommodation & food services (8.4%)
- Real estate & rental & leasing (4.9%)
- Other services, except public administration (4.6%)
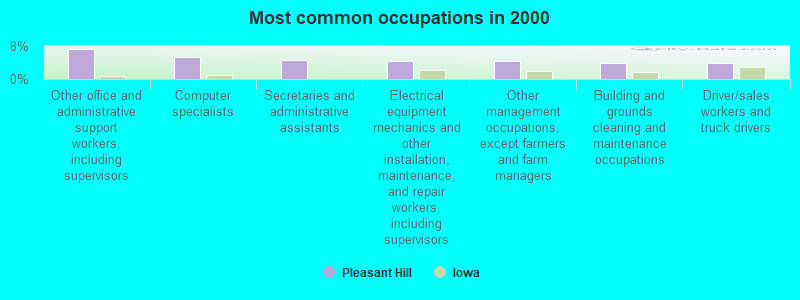
- Other office and administrative support workers, including supervisors (7.2%)
- Computer specialists (5.2%)
- Secretaries and administrative assistants (4.7%)
- Electrical equipment mechanics and other installation, maintenance, and repair workers, including supervisors (4.5%)
- Other management occupations, except farmers and farm managers (4.4%)
- Building and grounds cleaning and maintenance occupations (3.9%)
- Driver/sales workers and truck drivers (3.9%)
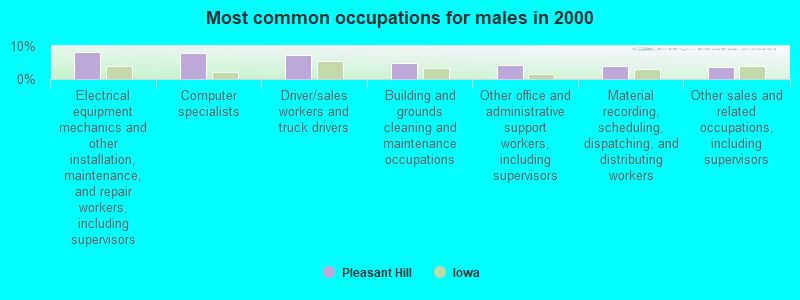
- Electrical equipment mechanics and other installation, maintenance, and repair workers, including supervisors (8.3%)
- Computer specialists (7.8%)
- Driver/sales workers and truck drivers (7.3%)
- Building and grounds cleaning and maintenance occupations (4.8%)
- Other office and administrative support workers, including supervisors (4.4%)
- Material recording, scheduling, dispatching, and distributing workers (4.0%)
- Other sales and related occupations, including supervisors (3.5%)
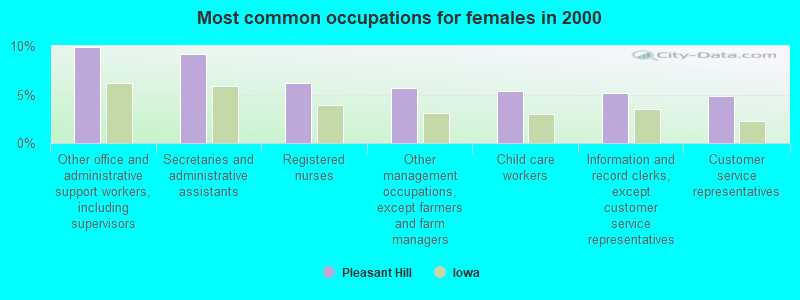
- Other office and administrative support workers, including supervisors (9.9%)
- Secretaries and administrative assistants (9.1%)
- Registered nurses (6.2%)
- Other management occupations, except farmers and farm managers (5.6%)
- Child care workers (5.4%)
- Information and record clerks, except customer service representatives (5.2%)
- Customer service representatives (4.8%)
Average climate in Pleasant Hill, Iowa
Based on data reported by over 4,000 weather stations


(lower is better)
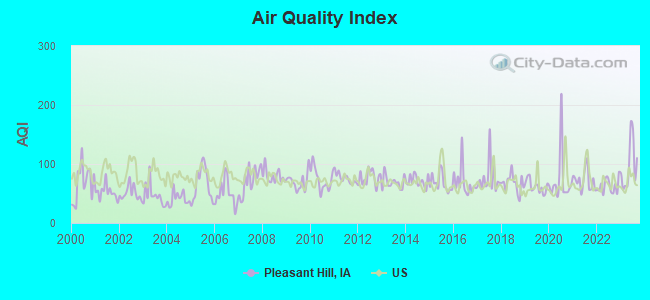
Air Quality Index (AQI) level in 2023 was 97.4. This is worse than average.
| City: | 97.4 |
| U.S.: | 72.6 |
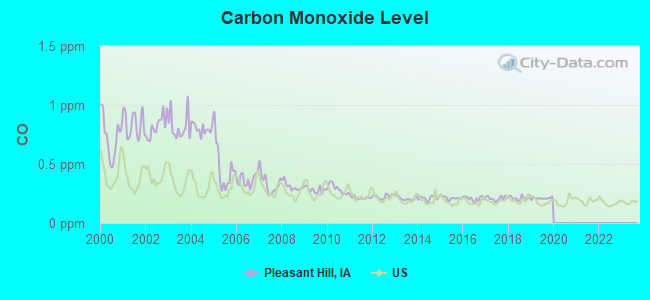
Carbon Monoxide (CO) [ppm] level in 2019 was 0.209. This is better than average. Closest monitor was 5.7 miles away from the city center.
| City: | 0.209 |
| U.S.: | 0.251 |
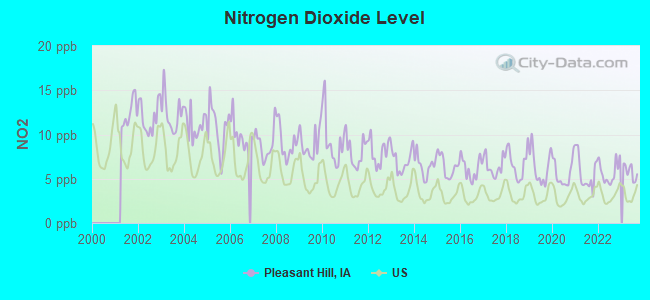
Nitrogen Dioxide (NO2) [ppb] level in 2023 was 5.78. This is about average. Closest monitor was 0.8 miles away from the city center.
| City: | 5.78 |
| U.S.: | 5.11 |
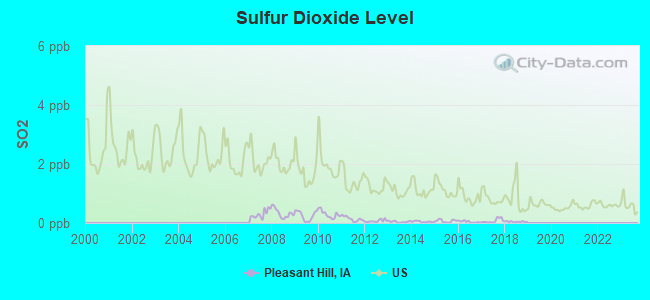
Sulfur Dioxide (SO2) [ppb] level in 2018 was 0.0417. This is significantly better than average. Closest monitor was 0.8 miles away from the city center.
| City: | 0.0417 |
| U.S.: | 1.5147 |
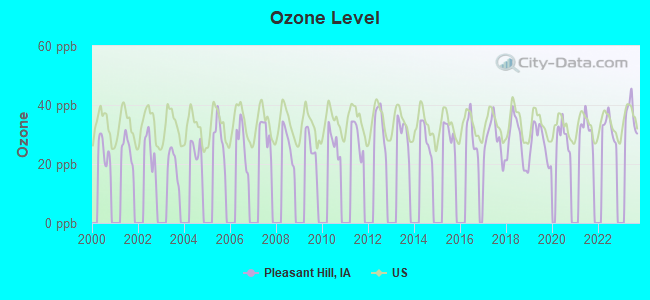
Ozone [ppb] level in 2023 was 36.8. This is about average. Closest monitor was 3.4 miles away from the city center.
| City: | 36.8 |
| U.S.: | 33.3 |
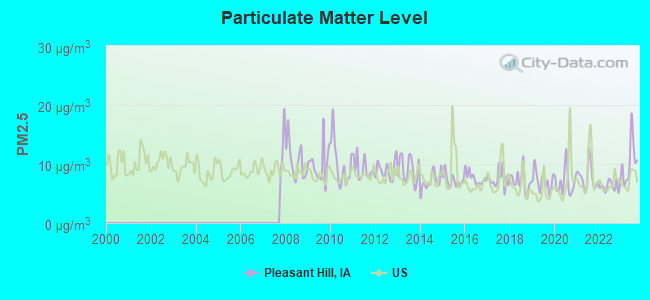
Particulate Matter (PM2.5) [µg/m3] level in 2023 was 10.4. This is worse than average. Closest monitor was 3.7 miles away from the city center.
| City: | 10.4 |
| U.S.: | 8.1 |
Tornado activity:
Pleasant Hill-area historical tornado activity is near Iowa state average. It is 104% greater than the overall U.S. average.
On 6/18/1974, a category F4 (max. wind speeds 207-260 mph) tornado 4.6 miles away from the Pleasant Hill city center killed 2 people and injured 50 people and caused between $5,000,000 and $50,000,000 in damages.
On 6/13/1976, a category F5 (max. wind speeds 261-318 mph) tornado 30.1 miles away from the city center injured 9 people and caused between $5,000,000 and $50,000,000 in damages.
Earthquake activity:
Pleasant Hill-area historical earthquake activity is significantly above Iowa state average. It is 214% greater than the overall U.S. average.On 9/3/2016 at 12:02:44, a magnitude 5.8 (5.8 MW, Depth: 3.5 mi, Class: Moderate, Intensity: VI - VII) earthquake occurred 401.3 miles away from Pleasant Hill center
On 4/18/2008 at 09:36:59, a magnitude 5.4 (5.1 MB, 4.8 MS, 5.4 MW, 5.2 MW) earthquake occurred 368.4 miles away from Pleasant Hill center
On 4/18/2008 at 09:36:59, a magnitude 5.2 (5.2 MW, Depth: 8.9 mi) earthquake occurred 368.4 miles away from the city center
On 6/10/1987 at 23:48:54, a magnitude 5.1 (4.9 MB, 4.4 MS, 4.6 MS, 5.1 LG) earthquake occurred 353.4 miles away from the city center
On 11/6/2011 at 03:53:10, a magnitude 5.7 (5.7 MW, Depth: 3.2 mi) earthquake occurred 454.1 miles away from Pleasant Hill center
On 9/26/1990 at 13:18:51, a magnitude 5.0 (4.7 MB, 4.8 LG, 5.0 LG, Depth: 7.7 mi) earthquake occurred 372.3 miles away from the city center
Magnitude types: regional Lg-wave magnitude (LG), body-wave magnitude (MB), surface-wave magnitude (MS), moment magnitude (MW)
Natural disasters:
The number of natural disasters in Polk County (19) is near the US average (19).Major Disasters (Presidential) Declared: 13
Emergencies Declared: 1
Causes of natural disasters: Floods: 13, Storms: 11, Tornadoes: 6, Heavy Rain: 1, Hurricane: 1, Snow: 1, Wind: 1, Winter Storm: 1, Other: 2 (Note: some incidents may be assigned to more than one category).
Hospitals and medical centers in Pleasant Hill:
Other hospitals and medical centers near Pleasant Hill:
- EASTON HEALTH CENTER (Nursing Home, about 3 miles away; DES MOINES, IA)
- VALLEY VIEW VILLAGE (Nursing Home, about 4 miles away; DES MOINES, IA)
- BEHAVIORAL TECHNOLOGIES-PORTER (Hospital, about 5 miles away; DES MOINES, IA)
- FREEDOM HOME HEALTH CARE INC (Home Health Center, about 5 miles away; DES MOINES, IA)
- METROPOLITAN MEDICAL CENTER (Hospital, about 5 miles away; DES MOINES, IA)
- THE HOMESTEAD LIVING AND LEARNING CENTER (Hospital, about 5 miles away; RUNNELLS, IA)
- TRINITY CENTER AT LUTHER PARK (Nursing Home, about 5 miles away; DES MOINES, IA)
Colleges/universities with over 2000 students nearest to Pleasant Hill:
- Drake University (about 8 miles; Des Moines, IA; Full-time enrollment: 3,768)
- Des Moines Area Community College (about 10 miles; Ankeny, IA; FT enrollment: 15,337)
- Iowa State University (about 32 miles; Ames, IA; FT enrollment: 28,662)
- Indian Hills Community College (about 70 miles; Ottumwa, IA; FT enrollment: 4,034)
- Iowa Central Community College (about 72 miles; Fort Dodge, IA; FT enrollment: 4,682)
- University of Northern Iowa (about 84 miles; Cedar Falls, IA; FT enrollment: 10,816)
- Hawkeye Community College (about 85 miles; Waterloo, IA; FT enrollment: 7,160)
Public high school in Pleasant Hill:
- SOUTHEAST POLK HIGH SCHOOL (Students: 1,496, Location: 7945 NE UNIVERSITY AVE., Grades: 9-12)
Public elementary/middle schools in Pleasant Hill:
- SOUTHEAST POLK JUNIOR HIGH SCHOOL (Students: 828, Location: 8325 NE UNIVERSITY AVE., Grades: 7-8)
- FOUR MILE ELEMENTARY SCHOOL (Students: 559, Location: 670 SE 68TH ST, Grades: KG-5)
- SPRING CREEK - 6TH GRADE (Location: 8031 NE UNIVERSITY AVE., Grades: 6)
User-submitted facts and corrections:
- There is also Pleasant Hill Elementary in Pleasant Hill. Four Mile Elementary is actually part of the South East Polk School District. The dividing line between Des Moines Schools and South East Polk run through Pleasant Hill.
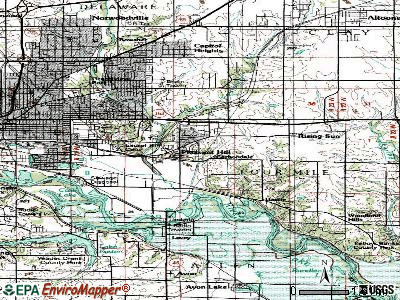
Points of interest:
Notable locations in Pleasant Hill: Pleasant Hill (A), Copper Creek Golf Course (B), Sleepy Hollow Sports Park (C), Pleasant Hill Police Department (D), Pleasant Hill Fire Department (E), Pleasant Hill City Library (F), Pleasant Hill City Hall (G). Display/hide their locations on the map
Churches in Pleasant Hill include: Oakwood United Methodist Church (A), Pleasant Hill Free Church (B), Berean Assembly of God Church (C), Church of Christ (D). Display/hide their locations on the map
Cemeteries: Oakwood Cemetery (1), Keller Cemetery (2). Display/hide their locations on the map
Creek: Fourmile Creek (A). Display/hide its location on the map
Park in Pleasant Hill: Doane Park (1). Display/hide its location on the map
| This city: | 2.6 people |
| Iowa: | 2.4 people |
| This city: | 71.5% |
| Whole state: | 64.7% |
| This city: | 7.3% |
| Whole state: | 6.7% |
Likely homosexual households (counted as self-reported same-sex unmarried-partner households)
- Lesbian couples: 0.5% of all households
- Gay men: 0.4% of all households
4 people in group homes intended for adults in 2010
73 people in nursing homes in 2000
Banks with branches in Pleasant Hill (2011 data):
- Community State Bank, National Association: Pleasant Hill Branch at 1025 N Hickory Blvd, branch established on 1967/10/10. Info updated 2006/11/03: Bank assets: $547.6 mil, Deposits: $434.8 mil, headquarters in Ankeny, IA, negative income in the last year, Commercial Lending Specialization, 11 total offices, Holding Company: Van Diest Investment Company
- Keystone Savings Bank: Pleasant Hill Branch at 6871 Ne 12th Ave., branch established on 2007/12/27. Info updated 2006/11/03: Bank assets: $77.1 mil, Deposits: $69.7 mil, headquarters in Marengo, IA, positive income, 4 total offices, Holding Company: Keystone Community Bancorporation
- Valley Bank: Pleasant Hill Branch at 1290 Copper Creek Drive, branch established on 2008/04/25. Info updated 2008/08/11: Bank assets: $629.4 mil, Deposits: $477.0 mil, headquarters in Moline, IL, positive income, Commercial Lending Specialization, 18 total offices, Holding Company: River Valley Bancorp, Inc.
For population 15 years and over in Pleasant Hill:
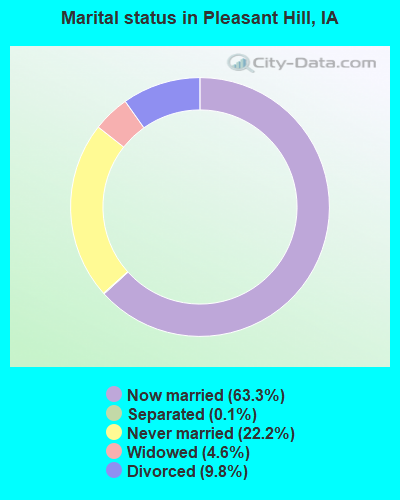
- Never married: 25.5%
- Now married: 60.6%
- Separated: 0.4%
- Widowed: 3.9%
- Divorced: 9.6%
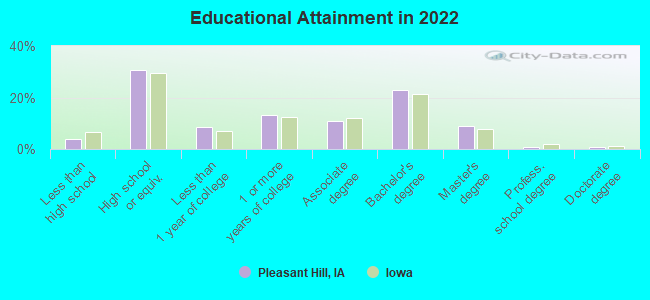
For population 25 years and over in Pleasant Hill:
- High school or higher: 97.3%
- Bachelor's degree or higher: 32.2%
- Graduate or professional degree: 9.3%
- Unemployed: 4.4%
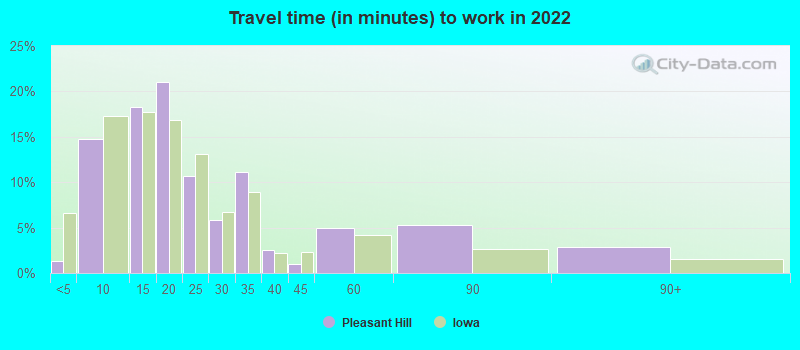
- Mean travel time to work (commute): 18.9 minutes
| Here: | 9.7 |
| Iowa average: | 10.7 |
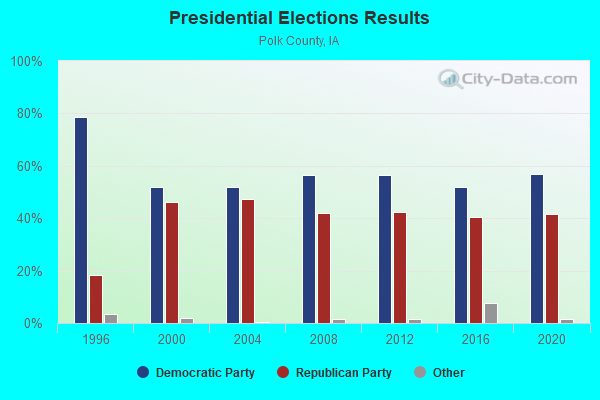
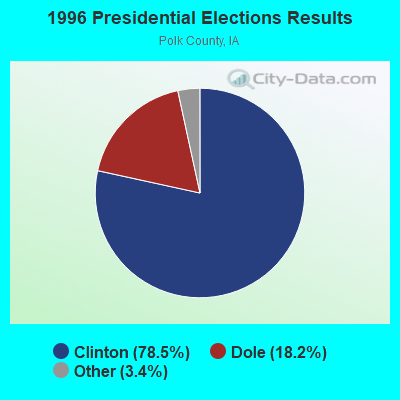
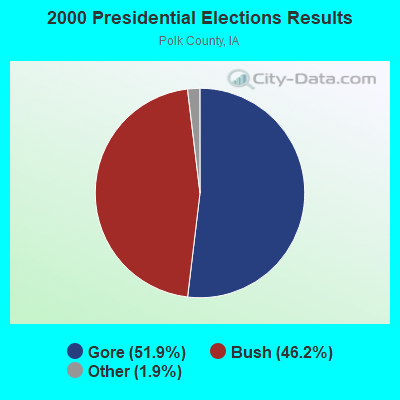
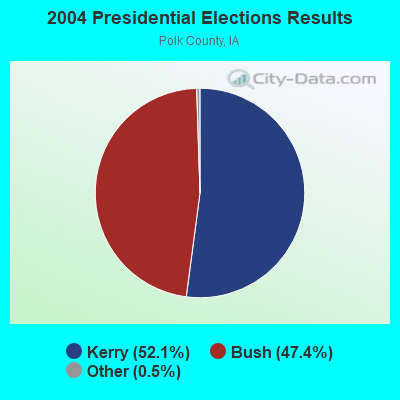
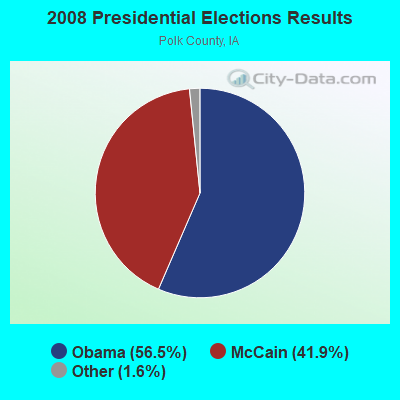

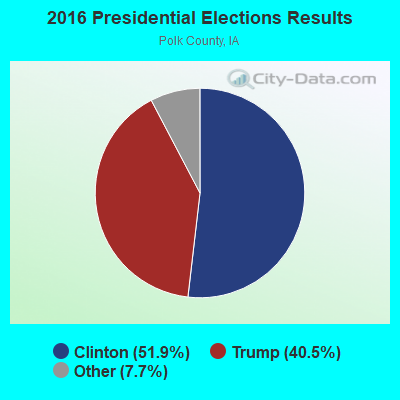
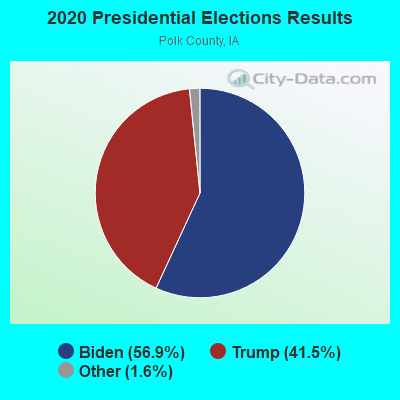

Graphs represent county-level data. Detailed 2008 Election Results
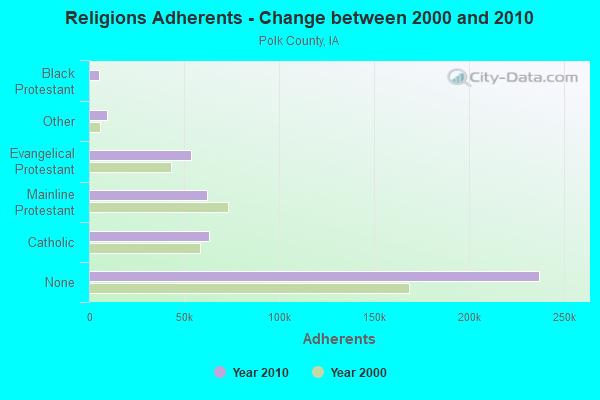
Religion statistics for Pleasant Hill, IA (based on Polk County data)
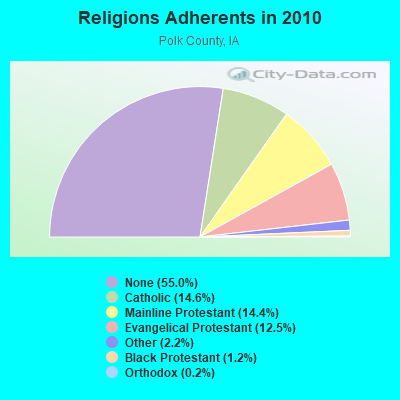
| Religion | Adherents | Congregations |
|---|---|---|
| Catholic | 62,867 | 19 |
| Mainline Protestant | 61,821 | 117 |
| Evangelical Protestant | 53,822 | 208 |
| Other | 9,331 | 35 |
| Black Protestant | 5,275 | 19 |
| Orthodox | 646 | 4 |
| None | 236,878 | - |
Food Environment Statistics:
| Here: | 1.51 / 10,000 pop. |
| State: | 2.14 / 10,000 pop. |
| Polk County: | 0.17 / 10,000 pop. |
| Iowa: | 0.23 / 10,000 pop. |
| Polk County: | 0.19 / 10,000 pop. |
| State: | 0.43 / 10,000 pop. |
| Polk County: | 3.78 / 10,000 pop. |
| Iowa: | 5.55 / 10,000 pop. |
| Polk County: | 7.57 / 10,000 pop. |
| Iowa: | 8.01 / 10,000 pop. |
| Polk County: | 7.3% |
| Iowa: | 7.8% |
| Polk County: | 25.8% |
| State: | 27.3% |
| This county: | 13.5% |
| Iowa: | 14.5% |
Health and Nutrition:
| This city: | 47.1% |
| Iowa: | 49.5% |
| This city: | 42.6% |
| Iowa: | 46.1% |
| Pleasant Hill: | 29.1 |
| Iowa: | 28.6 |
| Pleasant Hill: | 23.2% |
| Iowa: | 21.4% |
| Pleasant Hill: | 10.6% |
| State: | 10.4% |
| Here: | 6.8 |
| Iowa: | 6.8 |
| Pleasant Hill: | 34.8% |
| Iowa: | 33.8% |
| Pleasant Hill: | 54.3% |
| Iowa: | 55.9% |
| This city: | 78.0% |
| Iowa: | 77.7% |
More about Health and Nutrition of Pleasant Hill, IA Residents
| Local government employment and payroll (March 2022) | |||||
| Function | Full-time employees | Monthly full-time payroll | Average yearly full-time wage | Part-time employees | Monthly part-time payroll |
|---|---|---|---|---|---|
| Police Protection - Officers | 17 | $109,488 | $77,286 | 1 | $677 |
| Streets and Highways | 9 | $53,876 | $71,835 | 1 | $1,106 |
| Other Government Administration | 6 | $46,282 | $92,564 | 9 | $2,686 |
| Parks and Recreation | 3 | $15,257 | $61,028 | 0 | $0 |
| Local Libraries | 3 | $22,690 | $90,760 | 9 | $16,186 |
| Financial Administration | 2 | $16,095 | $96,570 | 3 | $5,652 |
| Police - Other | 2 | $10,812 | $64,872 | 0 | $0 |
| Other and Unallocable | 1 | $4,749 | $56,988 | 1 | $4,178 |
| Firefighters | 0 | $0 | 57 | $31,357 | |
| Totals for Government | 43 | $279,249 | $77,930 | 81 | $61,842 |
Pleasant Hill government finances - Expenditure in 2022 (per resident):
- Construction - General - Other: $1,961,000 ($175.31)
- Current Operations - General - Other: $8,424,000 ($753.08)
Police Protection: $2,756,000 ($246.38)
Sewerage: $1,605,000 ($143.48)
Regular Highways: $1,337,000 ($119.52)
Local Fire Protection: $1,228,000 ($109.78)
Central Staff Services: $928,000 ($82.96)
Financial Administration: $797,000 ($71.25)
Parks and Recreation: $767,000 ($68.57)
Libraries: $707,000 ($63.20)
Solid Waste Management: $552,000 ($49.35)
General Public Buildings: $540,000 ($48.27)
Health - Other: $169,000 ($15.11)
Judicial and Legal Services: $164,000 ($14.66)
Miscellaneous Commercial Activities - Other: $21,000 ($1.88)
- General - Interest on Debt: $856,000 ($76.52)
- Total Salaries and Wages: $4,996,000 ($446.63)
Pleasant Hill government finances - Revenue in 2022 (per resident):
- Charges - Sewerage: $2,403,000 ($214.82)
Other: $643,000 ($57.48)
Solid Waste Management: $565,000 ($50.51)
Miscellaneous Commercial Activities: $58,000 ($5.19)
Parks and Recreation: $10,000 ($0.89)
- Federal Intergovernmental - Other: $3,143,000 ($280.98)
- Local Intergovernmental - Other: $229,000 ($20.47)
- Miscellaneous - General Revenue - Other: $250,000 ($22.35)
Interest Earnings: $61,000 ($5.45)
Fines and Forfeits: $56,000 ($5.01)
Rents: $43,000 ($3.84)
Sale of Property: $1,000 ($0.09)
- Revenue - Water Utilities: $56,000 ($5.01)
- State Intergovernmental - Other: $1,709,000 ($152.78)
- Tax - Property: $10,165,000 ($908.73)
General Sales and Gross Receipts: $2,492,000 ($222.78)
Public Utilities Sales: $1,446,000 ($129.27)
Other License: $387,000 ($34.60)
Other Selective Sales: $158,000 ($14.12)
Pleasant Hill government finances - Debt in 2022 (per resident):
- Long Term Debt - Beginning Outstanding - Unspecified Public Purpose: $27,015,000 ($2415.07)
Outstanding Unspecified Public Purpose: $23,150,000 ($2069.55)
Retired Unspecified Public Purpose: $5,930,000 ($530.13)
Issue, Unspecified Public Purpose: $2,065,000 ($184.61)
| Businesses in Pleasant Hill, IA | ||||
| Name | Count | Name | Count | |
|---|---|---|---|---|
| Chevrolet | 1 | Sleep Inn | 1 | |
| Firestone Complete Auto Care | 1 | Subway | 1 | |
| McDonald's | 1 | UPS | 1 | |
Strongest AM radio stations in Pleasant Hill:
- KBGG (1700 AM; 10 kW; DES MOINES, IA; Owner: CITADEL BROADCASTING COMPANY)
- WHO (1040 AM; 50 kW; DES MOINES, IA; Owner: CITICASTERS LICENSES, L.P.)
- KRNT (1350 AM; 5 kW; DES MOINES, IA; Owner: SAGA COMMUNICATIONS OF IOWA, LLC)
- KXNO (1460 AM; 5 kW; DES MOINES, IA; Owner: CAPSTAR TX LIMITED PARTNERSHIP)
- KPSZ (940 AM; 10 kW; DES MOINES, IA; Owner: SAGA COMMUNICATIONS OF IOWA, LLC)
- WOI (640 AM; 5 kW; AMES, IA; Owner: IOWA STATE UNIV., OF SCIENCE & TECH.)
- KXEL (1540 AM; 50 kW; WATERLOO, IA; Owner: KXEL BROADCASTING COMPANY, INC.)
- KWKY (1150 AM; 1 kW; DES MOINES, IA; Owner: PUTBRESE COMMUNICATIONS, LTD.)
- KOIL (1020 AM; 50 kW; PLATTSMOUTH, NE; Owner: WAITT RADIO, INC.)
- KFGQ (1260 AM; 5 kW; BOONE, IA; Owner: BOONE BIBLICAL MINISTRIES, INC.)
- KXLQ (1490 AM; 1 kW; INDIANOLA, IA; Owner: WARREN BROADCASTING, INC.)
- KFAB (1110 AM; 50 kW; OMAHA, NE; Owner: CAPSTAR TX LIMITED PARTNERSHIP)
- KKAR (1290 AM; 50 kW; OMAHA, NE; Owner: WAITT RADIO, INC.)
Strongest FM radio stations in Pleasant Hill:
- KIOA (93.3 FM; DES MOINES, IA; Owner: SAGA COMMUNICATIONS OF IOWA, LLC)
- KDFR (91.3 FM; DES MOINES, IA; Owner: FAMILY STATIONS, INC.)
- KGGO (94.9 FM; DES MOINES, IA; Owner: CITADEL BROADCASTING COMPANY)
- KAZR (103.3 FM; PELLA, IA; Owner: SAGA COMMUNICATIONS OF IOWA, LLC)
- KJMC (89.3 FM; DES MOINES, IA; Owner: MINORITY COMMUNICATIONS, INC.)
- KMXD (100.3 FM; DES MOINES, IA; Owner: CITICASTERS LICENSES, L.P.)
- WOI-FM (90.1 FM; AMES, IA; Owner: IOWA STATE UNIVERSITY OF SCI & TECH)
- KSTZ (102.5 FM; DES MOINES, IA; Owner: SAGA COMMUNICATIONS OF IOWA, LLC)
- KKDM (107.5 FM; DES MOINES, IA; Owner: CLEAR CHANNEL BROADCASTING LICENSES, INC.)
- K269EJ (101.7 FM; DES MOINES, IA; Owner: UNIVERSITY OF NORTHERN IOWA)
- K213DV (90.5 FM; PLEASANT HILL, IA; Owner: EDUCATIONAL MEDIA FOUNDATION)
- KVJZ (106.3 FM; ANKENY, IA; Owner: CITICASTERS LICENSES, L.P.)
- KJJY (92.5 FM; WEST DES MOINES, IA; Owner: CITADEL BROADCASTING COMPANY)
- KHKI (97.3 FM; DES MOINES, IA; Owner: CITADEL BROADCASTING COMPANY)
- KLTI-FM (104.1 FM; AMES, IA; Owner: SAGA COMMUNICATIONS OF IOWA, LLC)
- K209EN (89.7 FM; CLIVE, IA; Owner: CALVARY CHAPEL OF TWIN FALLS, INC.)
- KRKQ (98.3 FM; BOONE, IA; Owner: CITADEL BROADCASTING COMPANY)
- KWDM (88.7 FM; WEST DES MOINES, IA; Owner: W. DES MOINES COMM. SCHOOL DISTRICT)
- KLRX (96.1 FM; MADRID, IA; Owner: THOMAS H. BURKE, RECEIVER FOR LIFESTYLE COMMUNICATIONS CORP.)
- KSTM (88.9 FM; INDIANOLA, IA; Owner: SIMPSON COLLEGE)
TV broadcast stations around Pleasant Hill:
- KRPG-LP (Channel 43; DES MOINES, IA; Owner: TIGER EYE BROADCASTING CORPORATION)
- WBXF-CA (Channel 4; DES MOINES, IA; Owner: THE BOX WORLDWIDE LLC)
- WOI-TV (Channel 5; AMES, IA; Owner: CAPITAL COMMUNICATIONS COMPANY, INC.)
- KDIN-TV (Channel 11; DES MOINES, IA; Owner: IOWA PUBLIC BROADCASTING BOARD)
- KPWB-TV (Channel 23; AMES, IA; Owner: PAPPAS TELECASTING OF IOWA, L.L.C.)
- KDSM-TV (Channel 17; DES MOINES, IA; Owner: KDSM LICENSEE, LLC)
- KCCI (Channel 8; DES MOINES, IA; Owner: DES MOINES HEARST-ARGYLE TV, INC.)
- WHO-TV (Channel 13; DES MOINES, IA; Owner: NEW YORK TIMES MANAGEMENT SERVICES)
- K29EA (Channel 29; DES MOINES, IA; Owner: TV-45, INC.)
- K46EY (Channel 46; DES MOINES, IA; Owner: TV-45, INC.)
- K41DD (Channel 41; DES MOINES, IA; Owner: VENTANA TELEVISION, INC.)
- KFPX (Channel 39; NEWTON, IA; Owner: PAXSON DES MOINES LICENSE, INC.)
- K48FZ (Channel 48; AMES, IA; Owner: TV-52, INC.)
- K56GD (Channel 56; AMES, IA; Owner: TV-45, INC.)
- National Bridge Inventory (NBI) Statistics
- 31Number of bridges
- 538ft / 164mTotal length
- 198,117Total average daily traffic
- 22,623Total average daily truck traffic
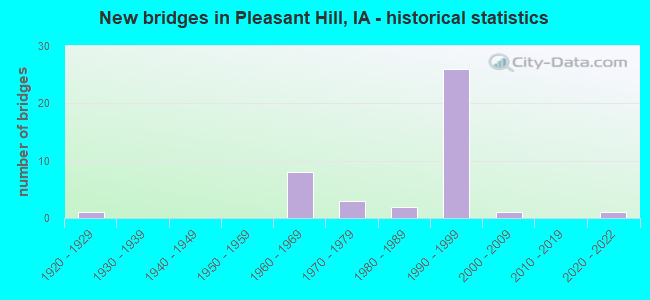
- New bridges - historical statistics
- 51960-1969
- 21980-1989
- 221990-1999
- 12000-2009
- 12020-2024
FCC Registered Antenna Towers:
28 (See the full list of FCC Registered Antenna Towers in Pleasant Hill)FCC Registered Commercial Land Mobile Towers:
2 (See the full list of FCC Registered Commercial Land Mobile Towers in Pleasant Hill, IA)FCC Registered Broadcast Land Mobile Towers:
11 (See the full list of FCC Registered Broadcast Land Mobile Towers)FCC Registered Microwave Towers:
3- POWER PLANT, 3391 Se 45th Street (Lat: 41.554000 Lon: -93.520750), Type: Mtower, Structure height: 79.3 m, Overall height: 81.1 m, Call Sign: WNTD834,
Assigned Frequencies: 928.693 MHz, 952.693 MHz, Grant Date: 04/08/2020, Expiration Date: 04/25/2030, Registrant: Midamerican Energy Company, 4124 Nw Urbandale Dr., Des Moines, IA 50306-0657, Phone: (515) 242-3030, Email:
- PLH, 5161 Maple Dr (Lat: 41.597333 Lon: -93.513694), Type: Ltower, Structure height: 50.3 m, Overall height: 56.4 m, Call Sign: WRBS652,
Assigned Frequencies: 10815.0 MHz, 10815.0 MHz, 10815.0 MHz, 10815.0 MHz, 10815.0 MHz, 10815.0 MHz, 10815.0 MHz, 10815.0 MHz, 10815.0 MHz, 10815.0 MHz, 10815.0 MHz, Grant Date: 06/07/2018, Expiration Date: 06/07/2028, Certifier: Donnie Happel, Registrant: Micronet Communications, Inc., 812 Lexington Dr, Plano, TX 75075, Phone: (972) 422-7200, Email:
- POWER PLANT, 3391 Se 45th Street (Lat: 41.554000 Lon: -93.520750), Type: Mtower, Structure height: 79.3 m, Overall height: 81.1 m, Call Sign: KAI99,
Assigned Frequencies: 6805.00 MHz, 6835.00 MHz, 5945.20 MHz, 6004.50 MHz, 5945.20 MHz, 5945.20 MHz, 5945.20 MHz, 5945.20 MHz, 5945.20 MHz, 5945.20 MHz... (+9 more), Grant Date: 04/10/2020, Expiration Date: 04/25/2030, Registrant: Midamerican Energy Company, 4124 Nw Urbandale Dr., Des Moines, IA 50306-0657, Phone: (515) 242-3030, Email:
FCC Registered Amateur Radio Licenses:
18 (See the full list of FCC Registered Amateur Radio Licenses in Pleasant Hill)FAA Registered Aircraft Manufacturers and Dealers:
2- CAMPBELL DANNY D, 420 Ne 72nd St, Pleasant Hill, IA 50327
Certificate: D002070 (Individual), Certificate Issue Date: 03/11/2020, Expiration Date: 03/10/2021 - WESTBROOK GROUP INC, 4835 Pinehurst Ct, Pleasant Hill, IA 50327
Certificate: D007296 (Corporation), Certificate Issue Date: 04/30/2019, Expiration Date: 04/29/2020
FAA Registered Aircraft:
5- Aircraft: NATIONAL BALLOONING LTD 858 (Category: Land, Seats: 4, Weight: Up to 12,499 Pounds), Engine: None
N-Number: 31817, N31817, N-31817, Serial Number: 174, Year manufactured: 2015, Airworthiness Date: 04/08/2015, Certificate Issue Date: 08/06/2015
Registrant (Individual): Danny D Campbell, 420 Ne 72nd St, Pleasant Hill, IA 50327 - Aircraft: CESSNA T210N (Category: Land, Seats: 6, Weight: Up to 12,499 Pounds), Engine: CONT MOTOR TSIO 520SER (350 HP) (Reciprocating)
N-Number: 6227Y, N6227Y, N-6227Y, Serial Number: 21064301, Year manufactured: 1981, Airworthiness Date: 03/04/2004, Certificate Issue Date: 05/09/2012
Registrant (Corporation): West Brook Group Inc, 4835 Pinehurst Ct, Pleasant Hill, IA 50327 - Aircraft: NATIONAL BALLOONING LTD 858 (Category: Land, Seats: 4, Weight: Up to 12,499 Pounds), Engine: None
N-Number: 7004N, N7004N, N-7004N, Serial Number: 128, Year manufactured: 1997, Airworthiness Date: 01/13/1997, Certificate Issue Date: 11/13/1996
Registrant (Individual): Danny D Campbell, 420 Ne 72nd St, Pleasant Hill, IA 50327 - Aircraft: LEIFFERT CHAD L SKYSTAR SERIES 5 (Category: Land, Seats: 2, Weight: Up to 12,499 Pounds), Engine: LYCOMING O-235-C (115 HP) (Reciprocating)
N-Number: 87CL, N87CL, N-87CL, Serial Number: C960Z0170, Year manufactured: 2008, Airworthiness Date: 08/29/2008, Certificate Issue Date: 03/03/1997
Registrant (Individual): Chad L Leiffert, 640 Ne 80th St, Pleasant Hill, IA 50327 - Aircraft: RICARDO DE ALMEIDA BALONISMOME SS-30BKD (Category: Land, Seats: 2, Weight: Up to 12,499 Pounds), Engine: None
N-Number: 967LD, N967LD, N-967LD, Serial Number: FMB200691, Certificate Issue Date: 06/09/2006
Registrant (Individual): Danny D Campbell, 420 Ne 72nd St, Pleasant Hill, IA 50237
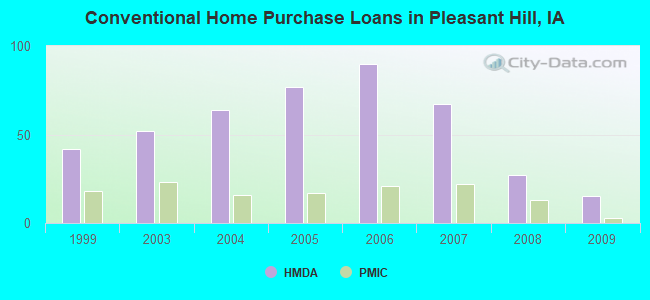
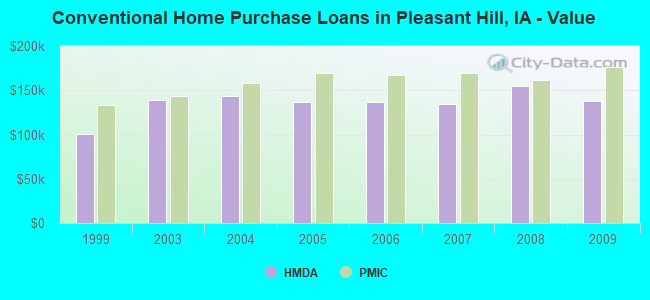
| Home Mortgage Disclosure Act Aggregated Statistics For Year 2009 (Based on 1 partial tract) | ||||||||||||||
| A) FHA, FSA/RHS & VA Home Purchase Loans | B) Conventional Home Purchase Loans | C) Refinancings | D) Home Improvement Loans | E) Loans on Dwellings For 5+ Families | F) Non-occupant Loans on < 5 Family Dwellings (A B C & D) | G) Loans On Manufactured Home Dwelling (A B C & D) | ||||||||
|---|---|---|---|---|---|---|---|---|---|---|---|---|---|---|
| Number | Average Value | Number | Average Value | Number | Average Value | Number | Average Value | Number | Average Value | Number | Average Value | Number | Average Value | |
| LOANS ORIGINATED | 15 | $152,514 | 15 | $138,041 | 121 | $157,229 | 9 | $31,831 | 1 | $1,540,600 | 3 | $97,440 | 0 | $0 |
| APPLICATIONS APPROVED, NOT ACCEPTED | 1 | $145,990 | 0 | $0 | 14 | $135,044 | 1 | $52,560 | 0 | $0 | 0 | $0 | 0 | $0 |
| APPLICATIONS DENIED | 1 | $199,920 | 1 | $178,280 | 30 | $156,350 | 3 | $46,143 | 0 | $0 | 1 | $82,440 | 1 | $14,430 |
| APPLICATIONS WITHDRAWN | 2 | $124,175 | 1 | $80,720 | 23 | $177,321 | 2 | $46,715 | 0 | $0 | 1 | $46,030 | 1 | $72,820 |
| FILES CLOSED FOR INCOMPLETENESS | 0 | $0 | 0 | $0 | 5 | $163,780 | 0 | $0 | 0 | $0 | 0 | $0 | 0 | $0 |
Detailed HMDA statistics for the following Tracts: 0108.01
| Private Mortgage Insurance Companies Aggregated Statistics For Year 2009 (Based on 1 partial tract) | ||||
| A) Conventional Home Purchase Loans | B) Refinancings | |||
|---|---|---|---|---|
| Number | Average Value | Number | Average Value | |
| LOANS ORIGINATED | 3 | $175,873 | 11 | $187,426 |
| APPLICATIONS APPROVED, NOT ACCEPTED | 1 | $108,550 | 1 | $200,260 |
| APPLICATIONS DENIED | 1 | $119,880 | 1 | $118,850 |
| APPLICATIONS WITHDRAWN | 0 | $0 | 0 | $0 |
| FILES CLOSED FOR INCOMPLETENESS | 0 | $0 | 0 | $0 |
Detailed PMIC statistics for the following Tracts: 0108.01
2002 - 2017 National Fire Incident Reporting System (NFIRS) incidents
- Fire incident types reported to NFIRS in Pleasant Hill, IA
- 28045.4%Structure Fires
- 21334.5%Outside Fires
- 7912.8%Mobile Property/Vehicle Fires
- 457.3%Other
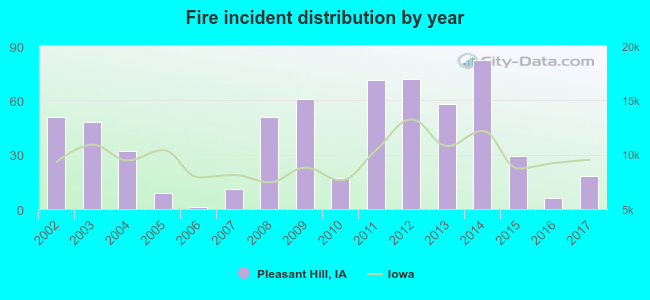 According to the data from the years 2002 - 2017 the average number of fire incidents per year is 39. The highest number of fires - 82 took place in 2014, and the least - 1 in 2006. The data has a declining trend.
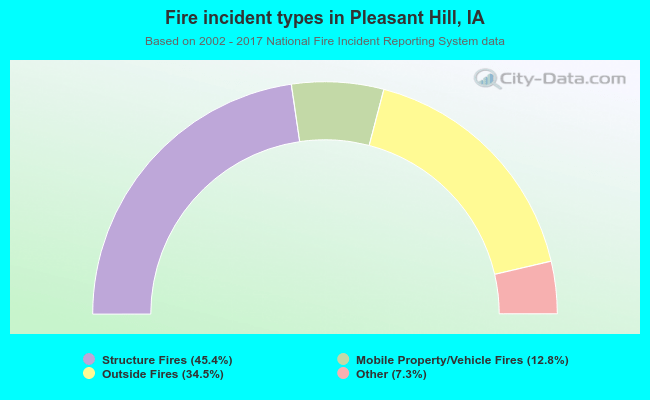 When looking into fire subcategories, the most reports belonged to: Structure Fires (45.4%), and Outside Fires (34.5%).
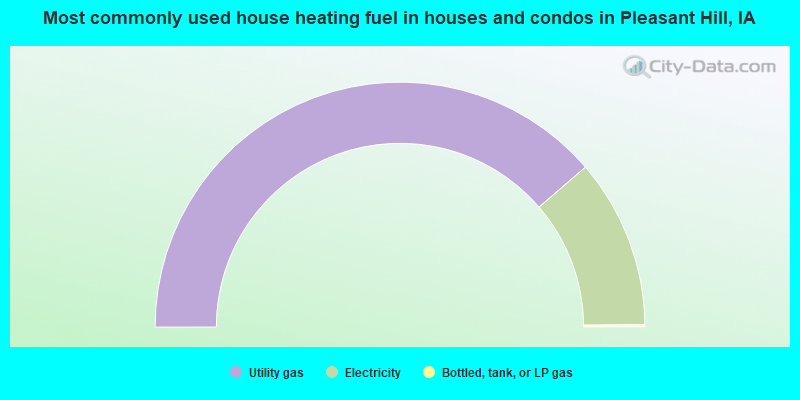
- 81.0%Utility gas
- 17.9%Electricity
- 0.5%Wood
- 0.5%Bottled, tank, or LP gas
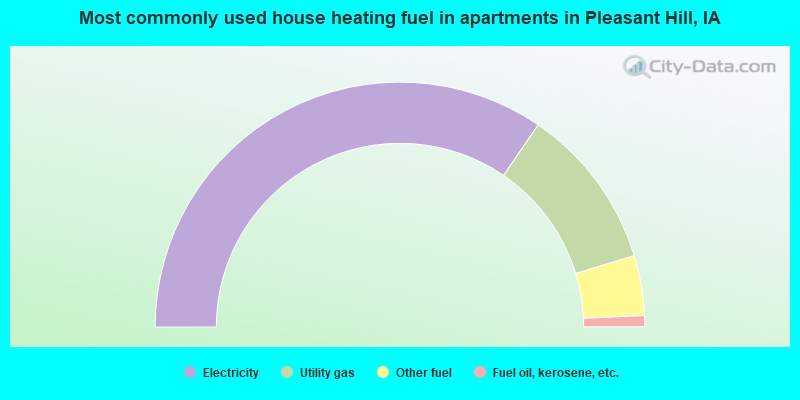
- 58.7%Electricity
- 33.1%Utility gas
- 6.9%Other fuel
- 1.3%Fuel oil, kerosene, etc.
Pleasant Hill compared to Iowa state average:
- Unemployed percentage significantly below state average.
- Black race population percentage above state average.
- Hispanic race population percentage above state average.
- Median age significantly below state average.
- Foreign-born population percentage above state average.
- Length of stay since moving in below state average.
- House age significantly below state average.
- Percentage of population with a bachelor's degree or higher above state average.
Pleasant Hill on our top lists:
- #79 on the list of "Top 101 cities with the largest city-data.com crime index increase from 2002 to 2012 (population 5,000+)"
- #23 on the list of "Top 101 counties with the lowest Sulfur Oxides Annual air pollution readings in 2012 (µg/m3)"
- #30 on the list of "Top 101 counties with the lowest percentage of residents relocating from foreign countries between 2010 and 2011"
- #46 on the list of "Top 101 counties with the lowest percentage of residents relocating to foreign countries in 2011"
- #47 on the list of "Top 101 counties with the highest percentage of residents that visited a dentist within the past year"
- #55 on the list of "Top 101 counties with the most Mainline Protestant adherents"

|
|
Total of 29 patent applications in 2008-2025.