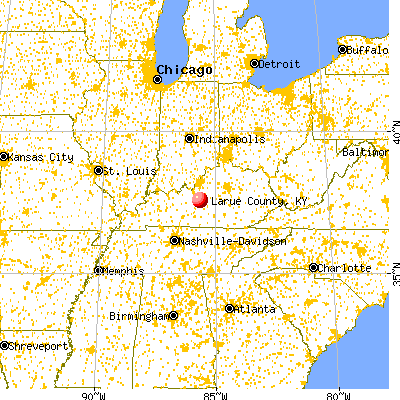
Larue County, Kentucky (KY)
County population in 2023: 15,079 (24% urban, 76% rural); it was 13,373 in 2000County owner-occupied with a mortgage or a loan houses and condos in 2010: 2,667County owner-occupied free and clear houses and condos in 2010: 1,580County owner-occupied houses and condos in 2000: 4,235Renter-occupied apartments: 1,368 (it was 1,040 in 2000)% of renters here:
20%State:
31%
Land area: 263 sq. mi.
Water area: 0.5 sq. mi.
Population density: 57 people per square mile (average).
December 2024 cost of living index in Larue County: 82.6 (low, U.S. average is 100) Industries providing employment: Manufacturing (26.9%), Educational, health and social services (25.6%).
Type of workers:
Private wage or salary: 77%Government: 17%Self-employed, not incorporated: 6%Unpaid family work: 0%
OSM Map
General Map
Google Map
MSN Map
OSM Map
General Map
Google Map
MSN Map
OSM Map
General Map
Google Map
MSN Map
OSM Map
General Map
Google Map
MSN Map
Please wait while loading the map...
Data:
Median household income ($)
Median household income (% change since 2000)
Household income diversity
Ratio of average income to average house value (%)
Ratio of average income to average rent
Median household income ($) - White
Median household income ($) - Black or African American
Median household income ($) - Asian
Median household income ($) - Hispanic or Latino
Median household income ($) - American Indian and Alaska Native
Median household income ($) - Multirace
Median household income ($) - Other Race
Median household income for houses/condos with a mortgage ($)
Median household income for apartments without a mortgage ($)
Races - White alone (%)
Races - White alone (% change since 2000)
Races - Black alone (%)
Races - Black alone (% change since 2000)
Races - American Indian alone (%)
Races - American Indian alone (% change since 2000)
Races - Asian alone (%)
Races - Asian alone (% change since 2000)
Races - Hispanic (%)
Races - Hispanic (% change since 2000)
Races - Native Hawaiian and Other Pacific Islander alone (%)
Races - Native Hawaiian and Other Pacific Islander alone (% change since 2000)
Races - Two or more races (%)
Races - Two or more races (% change since 2000)
Races - Other race alone (%)
Races - Other race alone (% change since 2000)
Racial diversity
Unemployment (%)
Unemployment (% change since 2000)
Unemployment (%) - White
Unemployment (%) - Black or African American
Unemployment (%) - Asian
Unemployment (%) - Hispanic or Latino
Unemployment (%) - American Indian and Alaska Native
Unemployment (%) - Multirace
Unemployment (%) - Other Race
Population density (people per square mile)
Population - Males (%)
Population - Females (%)
Population - Males (%) - White
Population - Males (%) - Black or African American
Population - Males (%) - Asian
Population - Males (%) - Hispanic or Latino
Population - Males (%) - American Indian and Alaska Native
Population - Males (%) - Multirace
Population - Males (%) - Other Race
Population - Females (%) - White
Population - Females (%) - Black or African American
Population - Females (%) - Asian
Population - Females (%) - Hispanic or Latino
Population - Females (%) - American Indian and Alaska Native
Population - Females (%) - Multirace
Population - Females (%) - Other Race
Coronavirus confirmed cases (May 11, 2025)
Deaths caused by coronavirus (May 11, 2025)
Coronavirus confirmed cases (per 100k population) (May 11, 2025)
Deaths caused by coronavirus (per 100k population) (May 11, 2025)
Daily increase in number of cases (May 11, 2025)
Weekly increase in number of cases (May 11, 2025)
Cases doubled (in days) (May 11, 2025)
Hospitalized patients (Apr 18, 2022)
Negative test results (Apr 18, 2022)
Total test results (Apr 18, 2022)
COVID Vaccine doses distributed (per 100k population) (Sep 19, 2023)
COVID Vaccine doses administered (per 100k population) (Sep 19, 2023)
COVID Vaccine doses distributed (Sep 19, 2023)
COVID Vaccine doses administered (Sep 19, 2023)
Likely homosexual households (%)
Likely homosexual households (% change since 2000)
Likely homosexual households - Lesbian couples (%)
Likely homosexual households - Lesbian couples (% change since 2000)
Likely homosexual households - Gay men (%)
Likely homosexual households - Gay men (% change since 2000)
Cost of living index
Median gross rent ($)
Median contract rent ($)
Median monthly housing costs ($)
Median house or condo value ($)
Median house or condo value ($ change since 2000)
Mean house or condo value by units in structure - 1, detached ($)
Mean house or condo value by units in structure - 1, attached ($)
Mean house or condo value by units in structure - 2 ($)
Mean house or condo value by units in structure by units in structure - 3 or 4 ($)
Mean house or condo value by units in structure - 5 or more ($)
Mean house or condo value by units in structure - Boat, RV, van, etc. ($)
Mean house or condo value by units in structure - Mobile home ($)
Median house or condo value ($) - White
Median house or condo value ($) - Black or African American
Median house or condo value ($) - Asian
Median house or condo value ($) - Hispanic or Latino
Median house or condo value ($) - American Indian and Alaska Native
Median house or condo value ($) - Multirace
Median house or condo value ($) - Other Race
Median resident age
Resident age diversity
Median resident age - Males
Median resident age - Females
Median resident age - White
Median resident age - Black or African American
Median resident age - Asian
Median resident age - Hispanic or Latino
Median resident age - American Indian and Alaska Native
Median resident age - Multirace
Median resident age - Other Race
Median resident age - Males - White
Median resident age - Males - Black or African American
Median resident age - Males - Asian
Median resident age - Males - Hispanic or Latino
Median resident age - Males - American Indian and Alaska Native
Median resident age - Males - Multirace
Median resident age - Males - Other Race
Median resident age - Females - White
Median resident age - Females - Black or African American
Median resident age - Females - Asian
Median resident age - Females - Hispanic or Latino
Median resident age - Females - American Indian and Alaska Native
Median resident age - Females - Multirace
Median resident age - Females - Other Race
Commute - mean travel time to work (minutes)
Travel time to work - Less than 5 minutes (%)
Travel time to work - Less than 5 minutes (% change since 2000)
Travel time to work - 5 to 9 minutes (%)
Travel time to work - 5 to 9 minutes (% change since 2000)
Travel time to work - 10 to 19 minutes (%)
Travel time to work - 10 to 19 minutes (% change since 2000)
Travel time to work - 20 to 29 minutes (%)
Travel time to work - 20 to 29 minutes (% change since 2000)
Travel time to work - 30 to 39 minutes (%)
Travel time to work - 30 to 39 minutes (% change since 2000)
Travel time to work - 40 to 59 minutes (%)
Travel time to work - 40 to 59 minutes (% change since 2000)
Travel time to work - 60 to 89 minutes (%)
Travel time to work - 60 to 89 minutes (% change since 2000)
Travel time to work - 90 or more minutes (%)
Travel time to work - 90 or more minutes (% change since 2000)
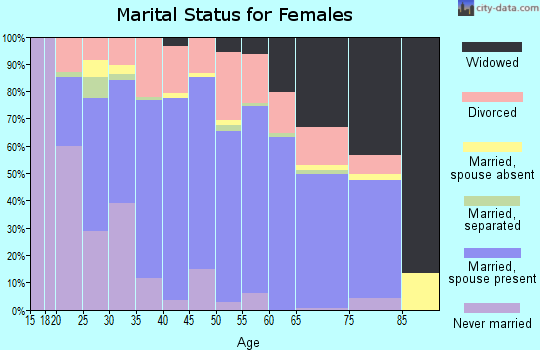
Marital status - Never married (%)
Marital status - Now married (%)
Marital status - Separated (%)
Marital status - Widowed (%)
Marital status - Divorced (%)
Median family income ($)
Median family income (% change since 2000)
Median non-family income ($)
Median non-family income (% change since 2000)
Median per capita income ($)
Median per capita income (% change since 2000)
Median family income ($) - White
Median family income ($) - Black or African American
Median family income ($) - Asian
Median family income ($) - Hispanic or Latino
Median family income ($) - American Indian and Alaska Native
Median family income ($) - Multirace
Median family income ($) - Other Race
Median year house/condo built
Median year apartment built
Year house built - Built 2005 or later (%)
Year house built - Built 2000 to 2004 (%)
Year house built - Built 1990 to 1999 (%)
Year house built - Built 1980 to 1989 (%)
Year house built - Built 1970 to 1979 (%)
Year house built - Built 1960 to 1969 (%)
Year house built - Built 1950 to 1959 (%)
Year house built - Built 1940 to 1949 (%)
Year house built - Built 1939 or earlier (%)
Average household size
Household density (households per square mile)
Average household size - White
Average household size - Black or African American
Average household size - Asian
Average household size - Hispanic or Latino
Average household size - American Indian and Alaska Native
Average household size - Multirace
Average household size - Other Race
Occupied housing units (%)
Vacant housing units (%)
Owner occupied housing units (%)
Renter occupied housing units (%)
Vacancy status - For rent (%)
Vacancy status - For sale only (%)
Vacancy status - Rented or sold, not occupied (%)
Vacancy status - For seasonal, recreational, or occasional use (%)
Vacancy status - For migrant workers (%)
Vacancy status - Other vacant (%)
Residents with income below the poverty level (%)
Residents with income below 50% of the poverty level (%)
Children below poverty level (%)
Poor families by family type - Married-couple family (%)
Poor families by family type - Male, no wife present (%)
Poor families by family type - Female, no husband present (%)
Poverty status for native-born residents (%)
Poverty status for foreign-born residents (%)
Poverty among high school graduates not in families (%)
Poverty among people who did not graduate high school not in families (%)
Residents with income below the poverty level (%) - White
Residents with income below the poverty level (%) - Black or African American
Residents with income below the poverty level (%) - Asian
Residents with income below the poverty level (%) - Hispanic or Latino
Residents with income below the poverty level (%) - American Indian and Alaska Native
Residents with income below the poverty level (%) - Multirace
Residents with income below the poverty level (%) - Other Race
Air pollution - Air Quality Index (AQI)
Air pollution - CO
Air pollution - NO2
Air pollution - SO2
Air pollution - Ozone
Air pollution - PM10
Air pollution - PM25
Air pollution - Pb
Crime - Murders per 100,000 population
Crime - Rapes per 100,000 population
Crime - Robberies per 100,000 population
Crime - Assaults per 100,000 population
Crime - Burglaries per 100,000 population
Crime - Thefts per 100,000 population
Crime - Auto thefts per 100,000 population
Crime - Arson per 100,000 population
Crime - City-data.com crime index
Crime - Violent crime index
Crime - Property crime index
Crime - Murders per 100,000 population (5 year average)
Crime - Rapes per 100,000 population (5 year average)
Crime - Robberies per 100,000 population (5 year average)
Crime - Assaults per 100,000 population (5 year average)
Crime - Burglaries per 100,000 population (5 year average)
Crime - Thefts per 100,000 population (5 year average)
Crime - Auto thefts per 100,000 population (5 year average)
Crime - Arson per 100,000 population (5 year average)
Crime - City-data.com crime index (5 year average)
Crime - Violent crime index (5 year average)
Crime - Property crime index (5 year average)
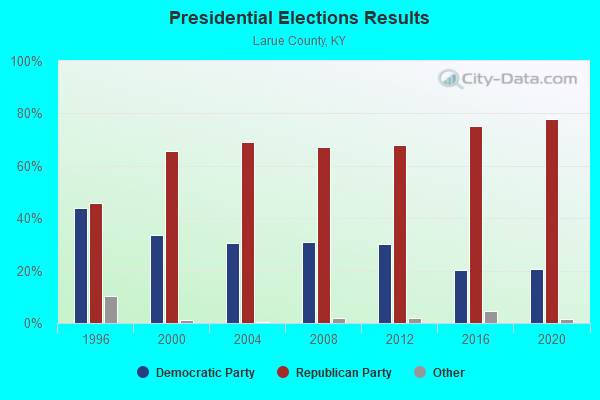
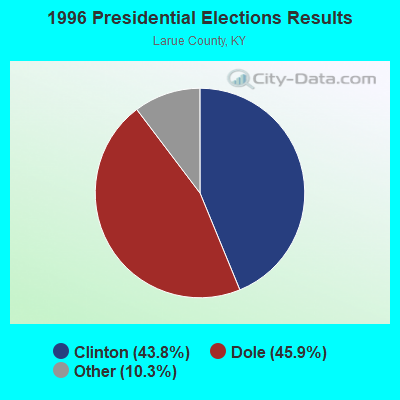
1996 Presidential Elections Results (%) - Democratic Party (Clinton)
1996 Presidential Elections Results (%) - Republican Party (Dole)
1996 Presidential Elections Results (%) - Other
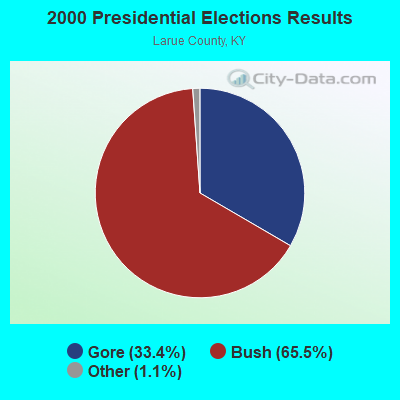
2000 Presidential Elections Results (%) - Democratic Party (Gore)
2000 Presidential Elections Results (%) - Republican Party (Bush)
2000 Presidential Elections Results (%) - Other
2004 Presidential Elections Results (%) - Democratic Party (Kerry)
2004 Presidential Elections Results (%) - Republican Party (Bush)
2004 Presidential Elections Results (%) - Other
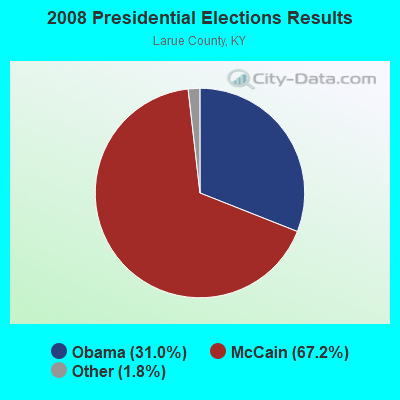
2008 Presidential Elections Results (%) - Democratic Party (Obama)
2008 Presidential Elections Results (%) - Republican Party (McCain)
2008 Presidential Elections Results (%) - Other
2012 Presidential Elections Results (%) - Democratic Party (Obama)
2012 Presidential Elections Results (%) - Republican Party (Romney)
2012 Presidential Elections Results (%) - Other
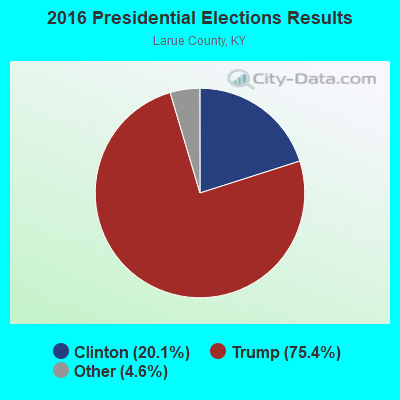
2016 Presidential Elections Results (%) - Democratic Party (Clinton)
2016 Presidential Elections Results (%) - Republican Party (Trump)
2016 Presidential Elections Results (%) - Other
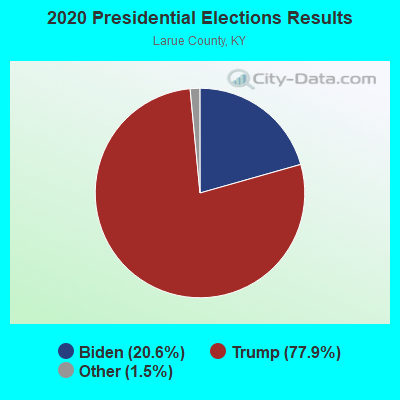
2020 Presidential Elections Results (%) - Democratic Party (Biden)
2020 Presidential Elections Results (%) - Republican Party (Trump)
2020 Presidential Elections Results (%) - Other
Ancestries Reported - Arab (%)
Ancestries Reported - Czech (%)
Ancestries Reported - Danish (%)
Ancestries Reported - Dutch (%)
Ancestries Reported - English (%)
Ancestries Reported - French (%)
Ancestries Reported - French Canadian (%)
Ancestries Reported - German (%)
Ancestries Reported - Greek (%)
Ancestries Reported - Hungarian (%)
Ancestries Reported - Irish (%)
Ancestries Reported - Italian (%)
Ancestries Reported - Lithuanian (%)
Ancestries Reported - Norwegian (%)
Ancestries Reported - Polish (%)
Ancestries Reported - Portuguese (%)
Ancestries Reported - Russian (%)
Ancestries Reported - Scotch-Irish (%)
Ancestries Reported - Scottish (%)
Ancestries Reported - Slovak (%)
Ancestries Reported - Subsaharan African (%)
Ancestries Reported - Swedish (%)
Ancestries Reported - Swiss (%)
Ancestries Reported - Ukrainian (%)
Ancestries Reported - United States (%)
Ancestries Reported - Welsh (%)
Ancestries Reported - West Indian (%)
Ancestries Reported - Other (%)
Educational Attainment - No schooling completed (%)
Educational Attainment - Less than high school (%)
Educational Attainment - High school or equivalent (%)
Educational Attainment - Less than 1 year of college (%)
Educational Attainment - 1 or more years of college (%)
Educational Attainment - Associate degree (%)
Educational Attainment - Bachelor's degree (%)
Educational Attainment - Master's degree (%)
Educational Attainment - Professional school degree (%)
Educational Attainment - Doctorate degree (%)
School Enrollment - Nursery, preschool (%)
School Enrollment - Kindergarten (%)
School Enrollment - Grade 1 to 4 (%)
School Enrollment - Grade 5 to 8 (%)
School Enrollment - Grade 9 to 12 (%)
School Enrollment - College undergrad (%)
School Enrollment - Graduate or professional (%)
School Enrollment - Not enrolled in school (%)
School enrollment - Public schools (%)
School enrollment - Private schools (%)
School enrollment - Not enrolled (%)
Median number of rooms in houses and condos
Median number of rooms in apartments
Housing units lacking complete plumbing facilities (%)
Housing units lacking complete kitchen facilities (%)
Density of houses
Urban houses (%)
Rural houses (%)
Households with people 60 years and over (%)
Households with people 65 years and over (%)
Households with people 75 years and over (%)
Households with one or more nonrelatives (%)
Households with no nonrelatives (%)
Population in households (%)
Family households (%)
Nonfamily households (%)
Population in families (%)
Family households with own children (%)
Median number of bedrooms in owner occupied houses
Mean number of bedrooms in owner occupied houses
Median number of bedrooms in renter occupied houses
Mean number of bedrooms in renter occupied houses
Median number of vehichles in owner occupied houses
Mean number of vehichles in owner occupied houses
Median number of vehichles in renter occupied houses
Mean number of vehichles in renter occupied houses
Mortgage status - with mortgage (%)
Mortgage status - with second mortgage (%)
Mortgage status - with home equity loan (%)
Mortgage status - with both second mortgage and home equity loan (%)
Mortgage status - without a mortgage (%)
Average family size
Average family size - White
Average family size - Black or African American
Average family size - Asian
Average family size - Hispanic or Latino
Average family size - American Indian and Alaska Native
Average family size - Multirace
Average family size - Other Race
Geographical mobility - Same house 1 year ago (%)
Geographical mobility - Moved within same county (%)
Geographical mobility - Moved from different county within same state (%)
Geographical mobility - Moved from different state (%)
Geographical mobility - Moved from abroad (%)
Place of birth - Born in state of residence (%)
Place of birth - Born in other state (%)
Place of birth - Native, outside of US (%)
Place of birth - Foreign born (%)
Housing units in structures - 1, detached (%)
Housing units in structures - 1, attached (%)
Housing units in structures - 2 (%)
Housing units in structures - 3 or 4 (%)
Housing units in structures - 5 to 9 (%)
Housing units in structures - 10 to 19 (%)
Housing units in structures - 20 to 49 (%)
Housing units in structures - 50 or more (%)
Housing units in structures - Mobile home (%)
Housing units in structures - Boat, RV, van, etc. (%)
House/condo owner moved in on average (years ago)
Renter moved in on average (years ago)
Year householder moved into unit - Moved in 1999 to March 2000 (%)
Year householder moved into unit - Moved in 1995 to 1998 (%)
Year householder moved into unit - Moved in 1990 to 1994 (%)
Year householder moved into unit - Moved in 1980 to 1989 (%)
Year householder moved into unit - Moved in 1970 to 1979 (%)
Year householder moved into unit - Moved in 1969 or earlier (%)
Means of transportation to work - Drove car alone (%)
Means of transportation to work - Carpooled (%)
Means of transportation to work - Public transportation (%)
Means of transportation to work - Bus or trolley bus (%)
Means of transportation to work - Streetcar or trolley car (%)
Means of transportation to work - Subway or elevated (%)
Means of transportation to work - Railroad (%)
Means of transportation to work - Ferryboat (%)
Means of transportation to work - Taxicab (%)
Means of transportation to work - Motorcycle (%)
Means of transportation to work - Bicycle (%)
Means of transportation to work - Walked (%)
Means of transportation to work - Other means (%)
Working at home (%)
Industry diversity
Most Common Industries - Agriculture, forestry, fishing and hunting, and mining (%)
Most Common Industries - Agriculture, forestry, fishing and hunting (%)
Most Common Industries - Mining, quarrying, and oil and gas extraction (%)
Most Common Industries - Construction (%)
Most Common Industries - Manufacturing (%)
Most Common Industries - Wholesale trade (%)
Most Common Industries - Retail trade (%)
Most Common Industries - Transportation and warehousing, and utilities (%)
Most Common Industries - Transportation and warehousing (%)
Most Common Industries - Utilities (%)
Most Common Industries - Information (%)
Most Common Industries - Finance and insurance, and real estate and rental and leasing (%)
Most Common Industries - Finance and insurance (%)
Most Common Industries - Real estate and rental and leasing (%)
Most Common Industries - Professional, scientific, and management, and administrative and waste management services (%)
Most Common Industries - Professional, scientific, and technical services (%)
Most Common Industries - Management of companies and enterprises (%)
Most Common Industries - Administrative and support and waste management services (%)
Most Common Industries - Educational services, and health care and social assistance (%)
Most Common Industries - Educational services (%)
Most Common Industries - Health care and social assistance (%)
Most Common Industries - Arts, entertainment, and recreation, and accommodation and food services (%)
Most Common Industries - Arts, entertainment, and recreation (%)
Most Common Industries - Accommodation and food services (%)
Most Common Industries - Other services, except public administration (%)
Most Common Industries - Public administration (%)
Occupation diversity
Most Common Occupations - Management, business, science, and arts occupations (%)
Most Common Occupations - Management, business, and financial occupations (%)
Most Common Occupations - Management occupations (%)
Most Common Occupations - Business and financial operations occupations (%)
Most Common Occupations - Computer, engineering, and science occupations (%)
Most Common Occupations - Computer and mathematical occupations (%)
Most Common Occupations - Architecture and engineering occupations (%)
Most Common Occupations - Life, physical, and social science occupations (%)
Most Common Occupations - Education, legal, community service, arts, and media occupations (%)
Most Common Occupations - Community and social service occupations (%)
Most Common Occupations - Legal occupations (%)
Most Common Occupations - Education, training, and library occupations (%)
Most Common Occupations - Arts, design, entertainment, sports, and media occupations (%)
Most Common Occupations - Healthcare practitioners and technical occupations (%)
Most Common Occupations - Health diagnosing and treating practitioners and other technical occupations (%)
Most Common Occupations - Health technologists and technicians (%)
Most Common Occupations - Service occupations (%)
Most Common Occupations - Healthcare support occupations (%)
Most Common Occupations - Protective service occupations (%)
Most Common Occupations - Fire fighting and prevention, and other protective service workers including supervisors (%)
Most Common Occupations - Law enforcement workers including supervisors (%)
Most Common Occupations - Food preparation and serving related occupations (%)
Most Common Occupations - Building and grounds cleaning and maintenance occupations (%)
Most Common Occupations - Personal care and service occupations (%)
Most Common Occupations - Sales and office occupations (%)
Most Common Occupations - Sales and related occupations (%)
Most Common Occupations - Office and administrative support occupations (%)
Most Common Occupations - Natural resources, construction, and maintenance occupations (%)
Most Common Occupations - Farming, fishing, and forestry occupations (%)
Most Common Occupations - Construction and extraction occupations (%)
Most Common Occupations - Installation, maintenance, and repair occupations (%)
Most Common Occupations - Production, transportation, and material moving occupations (%)
Most Common Occupations - Production occupations (%)
Most Common Occupations - Transportation occupations (%)
Most Common Occupations - Material moving occupations (%)
People in Group quarters - Institutionalized population (%)
People in Group quarters - Correctional institutions (%)
People in Group quarters - Federal prisons and detention centers (%)
People in Group quarters - Halfway houses (%)
People in Group quarters - Local jails and other confinement facilities (including police lockups) (%)
People in Group quarters - Military disciplinary barracks (%)
People in Group quarters - State prisons (%)
People in Group quarters - Other types of correctional institutions (%)
People in Group quarters - Nursing homes (%)
People in Group quarters - Hospitals/wards, hospices, and schools for the handicapped (%)
People in Group quarters - Hospitals/wards and hospices for chronically ill (%)
People in Group quarters - Hospices or homes for chronically ill (%)
People in Group quarters - Military hospitals or wards for chronically ill (%)
People in Group quarters - Other hospitals or wards for chronically ill (%)
People in Group quarters - Hospitals or wards for drug/alcohol abuse (%)
People in Group quarters - Mental (Psychiatric) hospitals or wards (%)
People in Group quarters - Schools, hospitals, or wards for the mentally retarded (%)
People in Group quarters - Schools, hospitals, or wards for the physically handicapped (%)
People in Group quarters - Institutions for the deaf (%)
People in Group quarters - Institutions for the blind (%)
People in Group quarters - Orthopedic wards and institutions for the physically handicapped (%)
People in Group quarters - Wards in general hospitals for patients who have no usual home elsewhere (%)
People in Group quarters - Wards in military hospitals for patients who have no usual home elsewhere (%)
People in Group quarters - Juvenile institutions (%)
People in Group quarters - Long-term care (%)
People in Group quarters - Homes for abused, dependent, and neglected children (%)
People in Group quarters - Residential treatment centers for emotionally disturbed children (%)
People in Group quarters - Training schools for juvenile delinquents (%)
People in Group quarters - Short-term care, detention or diagnostic centers for delinquent children (%)
People in Group quarters - Type of juvenile institution unknown (%)
People in Group quarters - Noninstitutionalized population (%)
People in Group quarters - College dormitories (includes college quarters off campus) (%)
People in Group quarters - Military quarters (%)
People in Group quarters - On base (%)
People in Group quarters - Barracks, unaccompanied personnel housing (UPH), (Enlisted/Officer), ;and similar group living quarters for military personnel (%)
People in Group quarters - Transient quarters for temporary residents (%)
People in Group quarters - Military ships (%)
People in Group quarters - Group homes (%)
People in Group quarters - Homes or halfway houses for drug/alcohol abuse (%)
People in Group quarters - Homes for the mentally ill (%)
People in Group quarters - Homes for the mentally retarded (%)
People in Group quarters - Homes for the physically handicapped (%)
People in Group quarters - Other group homes (%)
People in Group quarters - Religious group quarters (%)
People in Group quarters - Dormitories (%)
People in Group quarters - Agriculture workers' dormitories on farms (%)
People in Group quarters - Job Corps and vocational training facilities (%)
People in Group quarters - Other workers' dormitories (%)
People in Group quarters - Crews of maritime vessels (%)
People in Group quarters - Other nonhousehold living situations (%)
People in Group quarters - Other noninstitutional group quarters (%)
Residents speaking English at home (%)
Residents speaking English at home - Born in the United States (%)
Residents speaking English at home - Native, born elsewhere (%)
Residents speaking English at home - Foreign born (%)
Residents speaking Spanish at home (%)
Residents speaking Spanish at home - Born in the United States (%)
Residents speaking Spanish at home - Native, born elsewhere (%)
Residents speaking Spanish at home - Foreign born (%)
Residents speaking other language at home (%)
Residents speaking other language at home - Born in the United States (%)
Residents speaking other language at home - Native, born elsewhere (%)
Residents speaking other language at home - Foreign born (%)
Class of Workers - Employee of private company (%)
Class of Workers - Self-employed in own incorporated business (%)
Class of Workers - Private not-for-profit wage and salary workers (%)
Class of Workers - Local government workers (%)
Class of Workers - State government workers (%)
Class of Workers - Federal government workers (%)
Class of Workers - Self-employed workers in own not incorporated business and Unpaid family workers (%)
House heating fuel used in houses and condos - Utility gas (%)
House heating fuel used in houses and condos - Bottled, tank, or LP gas (%)
House heating fuel used in houses and condos - Electricity (%)
House heating fuel used in houses and condos - Fuel oil, kerosene, etc. (%)
House heating fuel used in houses and condos - Coal or coke (%)
House heating fuel used in houses and condos - Wood (%)
House heating fuel used in houses and condos - Solar energy (%)
House heating fuel used in houses and condos - Other fuel (%)
House heating fuel used in houses and condos - No fuel used (%)
House heating fuel used in apartments - Utility gas (%)
House heating fuel used in apartments - Bottled, tank, or LP gas (%)
House heating fuel used in apartments - Electricity (%)
House heating fuel used in apartments - Fuel oil, kerosene, etc. (%)
House heating fuel used in apartments - Coal or coke (%)
House heating fuel used in apartments - Wood (%)
House heating fuel used in apartments - Solar energy (%)
House heating fuel used in apartments - Other fuel (%)
House heating fuel used in apartments - No fuel used (%)
Armed forces status - In Armed Forces (%)
Armed forces status - Civilian (%)
Armed forces status - Civilian - Veteran (%)
Armed forces status - Civilian - Nonveteran (%)
Read more: https://www.city-data.com/accidents/acc-Addison-Illinois.html
Fatal accidents locations in years 2005-2022
Fatal accidents locations in 2022
Fatal accidents locations in 2021
Fatal accidents locations in 2020
Fatal accidents locations in 2019
Fatal accidents locations in 2018
Fatal accidents locations in 2017
Fatal accidents locations in 2016
Fatal accidents locations in 2015
Fatal accidents locations in 2014
Fatal accidents locations in 2013
Fatal accidents locations in 2012
Fatal accidents locations in 2011
Fatal accidents locations in 2010
Fatal accidents locations in 2009
Fatal accidents locations in 2008
Fatal accidents locations in 2007
Fatal accidents locations in 2006
Fatal accidents locations in 2005
Alcohol use - People drinking some alcohol every month (%)
Alcohol use - People not drinking at all (%)
Alcohol use - Average days/month drinking alcohol
Alcohol use - Average drinks/week
Alcohol use - Average days/year people drink much
Audiometry - Average condition of hearing (%)
Audiometry - People that can hear a whisper from across a quiet room (%)
Audiometry - People that can hear normal voice from across a quiet room (%)
Audiometry - Ears ringing, roaring, buzzing (%)
Audiometry - Had a job exposure to loud noise (%)
Audiometry - Had off-work exposure to loud noise (%)
Blood Pressure & Cholesterol - Has high blood pressure (%)
Blood Pressure & Cholesterol - Checking blood pressure at home (%)
Blood Pressure & Cholesterol - Frequently checking blood cholesterol (%)
Blood Pressure & Cholesterol - Has high cholesterol level (%)
Consumer Behavior - Money monthly spent on food at supermarket/grocery store
Consumer Behavior - Money monthly spent on food at other stores
Consumer Behavior - Money monthly spent on eating out
Consumer Behavior - Money monthly spent on carryout/delivered foods
Consumer Behavior - Income spent on food at supermarket/grocery store (%)
Consumer Behavior - Income spent on food at other stores (%)
Consumer Behavior - Income spent on eating out (%)
Consumer Behavior - Income spent on carryout/delivered foods (%)
Current Health Status - General health condition (%)
Current Health Status - Blood donors (%)
Current Health Status - Has blood ever tested for HIV virus (%)
Current Health Status - Left-handed people (%)
Dermatology - People using sunscreen (%)
Diabetes - Diabetics (%)
Diabetes - Had a blood test for high blood sugar (%)
Diabetes - People taking insulin (%)
Diet Behavior & Nutrition - Diet health (%)
Diet Behavior & Nutrition - Milk product consumption (# of products/month)
Diet Behavior & Nutrition - Meals not home prepared (#/week)
Diet Behavior & Nutrition - Meals from fast food or pizza place (#/week)
Diet Behavior & Nutrition - Ready-to-eat foods (#/month)
Diet Behavior & Nutrition - Frozen meals/pizza (#/month)
Drug Use - People that ever used marijuana or hashish (%)
Drug Use - Ever used hard drugs (%)
Drug Use - Ever used any form of cocaine (%)
Drug Use - Ever used heroin (%)
Drug Use - Ever used methamphetamine (%)
Health Insurance - People covered by health insurance (%)
Kidney Conditions-Urology - Avg. # of times urinating at night
Medical Conditions - People with asthma (%)
Medical Conditions - People with anemia (%)
Medical Conditions - People with psoriasis (%)
Medical Conditions - People with overweight (%)
Medical Conditions - Elderly people having difficulties in thinking or remembering (%)
Medical Conditions - People who ever received blood transfusion (%)
Medical Conditions - People having trouble seeing even with glass/contacts (%)
Medical Conditions - People with arthritis (%)
Medical Conditions - People with gout (%)
Medical Conditions - People with congestive heart failure (%)
Medical Conditions - People with coronary heart disease (%)
Medical Conditions - People with angina pectoris (%)
Medical Conditions - People who ever had heart attack (%)
Medical Conditions - People who ever had stroke (%)
Medical Conditions - People with emphysema (%)
Medical Conditions - People with thyroid problem (%)
Medical Conditions - People with chronic bronchitis (%)
Medical Conditions - People with any liver condition (%)
Medical Conditions - People who ever had cancer or malignancy (%)
Mental Health - People who have little interest in doing things (%)
Mental Health - People feeling down, depressed, or hopeless (%)
Mental Health - People who have trouble sleeping or sleeping too much (%)
Mental Health - People feeling tired or having little energy (%)
Mental Health - People with poor appetite or overeating (%)
Mental Health - People feeling bad about themself (%)
Mental Health - People who have trouble concentrating on things (%)
Mental Health - People moving or speaking slowly or too fast (%)
Mental Health - People having thoughts they would be better off dead (%)
Oral Health - Average years since last visit a dentist
Oral Health - People embarrassed because of mouth (%)
Oral Health - People with gum disease (%)
Oral Health - General health of teeth and gums (%)
Oral Health - Average days a week using dental floss/device
Oral Health - Average days a week using mouthwash for dental problem
Oral Health - Average number of teeth
Pesticide Use - Households using pesticides to control insects (%)
Pesticide Use - Households using pesticides to kill weeds (%)
Physical Activity - People doing vigorous-intensity work activities (%)
Physical Activity - People doing moderate-intensity work activities (%)
Physical Activity - People walking or bicycling (%)
Physical Activity - People doing vigorous-intensity recreational activities (%)
Physical Activity - People doing moderate-intensity recreational activities (%)
Physical Activity - Average hours a day doing sedentary activities
Physical Activity - Average hours a day watching TV or videos
Physical Activity - Average hours a day using computer
Physical Functioning - People having limitations keeping them from working (%)
Physical Functioning - People limited in amount of work they can do (%)
Physical Functioning - People that need special equipment to walk (%)
Physical Functioning - People experiencing confusion/memory problems (%)
Physical Functioning - People requiring special healthcare equipment (%)
Prescription Medications - Average number of prescription medicines taking
Preventive Aspirin Use - Adults 40+ taking low-dose aspirin (%)
Reproductive Health - Vaginal deliveries (%)
Reproductive Health - Cesarean deliveries (%)
Reproductive Health - Deliveries resulted in a live birth (%)
Reproductive Health - Pregnancies resulted in a delivery (%)
Reproductive Health - Women breastfeeding newborns (%)
Reproductive Health - Women that had a hysterectomy (%)
Reproductive Health - Women that had both ovaries removed (%)
Reproductive Health - Women that have ever taken birth control pills (%)
Reproductive Health - Women taking birth control pills (%)
Reproductive Health - Women that have ever used Depo-Provera or injectables (%)
Reproductive Health - Women that have ever used female hormones (%)
Sexual Behavior - People 18+ that ever had sex (vaginal, anal, or oral) (%)
Sexual Behavior - Males 18+ that ever had vaginal sex with a woman (%)
Sexual Behavior - Males 18+ that ever performed oral sex on a woman (%)
Sexual Behavior - Males 18+ that ever had anal sex with a woman (%)
Sexual Behavior - Males 18+ that ever had any sex with a man (%)
Sexual Behavior - Females 18+ that ever had vaginal sex with a man (%)
Sexual Behavior - Females 18+ that ever performed oral sex on a man (%)
Sexual Behavior - Females 18+ that ever had anal sex with a man (%)
Sexual Behavior - Females 18+ that ever had any kind of sex with a woman (%)
Sexual Behavior - Average age people first had sex
Sexual Behavior - Average number of female sex partners in lifetime (males 18+)
Sexual Behavior - Average number of female vaginal sex partners in lifetime (males 18+)
Sexual Behavior - Average age people first performed oral sex on a woman (18+)
Sexual Behavior - Average number of woman performed oral sex on in lifetime (18+)
Sexual Behavior - Average number of male sex partners in lifetime (males 18+)
Sexual Behavior - Average number of male anal sex partners in lifetime (males 18+)
Sexual Behavior - Average age people first performed oral sex on a man (18+)
Sexual Behavior - Average number of male oral sex partners in lifetime (18+)
Sexual Behavior - People using protection when performing oral sex (%)
Sexual Behavior - Average number of times people have vaginal or anal sex a year
Sexual Behavior - People having sex without condom (%)
Sexual Behavior - Average number of male sex partners in lifetime (females 18+)
Sexual Behavior - Average number of male vaginal sex partners in lifetime (females 18+)
Sexual Behavior - Average number of female sex partners in lifetime (females 18+)
Sexual Behavior - Circumcised males 18+ (%)
Sleep Disorders - Average hours sleeping at night
Sleep Disorders - People that has trouble sleeping (%)
Smoking-Cigarette Use - People smoking cigarettes (%)
Taste & Smell - People 40+ having problems with smell (%)
Taste & Smell - People 40+ having problems with taste (%)
Taste & Smell - People 40+ that ever had wisdom teeth removed (%)
Taste & Smell - People 40+ that ever had tonsils teeth removed (%)
Taste & Smell - People 40+ that ever had a loss of consciousness because of a head injury (%)
Taste & Smell - People 40+ that ever had a broken nose or other serious injury to face or skull (%)
Taste & Smell - People 40+ that ever had two or more sinus infections (%)
Weight - Average height (inches)
Weight - Average weight (pounds)
Weight - Average BMI
Weight - People that are obese (%)
Weight - People that ever were obese (%)
Weight - People trying to lose weight (%)
13,524 89.4% White Non-Hispanic Alone 696 4.6% Two or more races 512 3.4% Hispanic or Latino 286 1.9% Black Non-Hispanic Alone 94 0.6% Some other race alone 7 0.05% American Indian and Alaska Native alone 2 0.01% Asian alone Males: 7,476 Females: 7,603
Average household size: Larue County:
2.0 peopleKentucky:
2 people
Estimated median household income in 2023: $66,359 ($32,056 in 1999)This county:
$66,359Kentucky:
$61,118
Median contract rent in 2023 for apartments: $650 (lower quartile is $428, upper quartile is $824)This county:
$650State:
$745
Estimated median house or condo value in 2023: $195,499 (it was $73,900 in 2000 )
Larue:
$195,499Kentucky:
$211,800
Lower value quartile - upper value quartile: $117,692 - $314,648Mean price in 2023: Detached houses: $241,192 Here:
$241,192State:
$274,467
Townhouses or other attached units: $191,996 Here:
$191,996State:
$256,845
Mobile homes: $108,745 Here:
$108,745State:
$88,004
Median monthly housing costs for homes and condos with a mortgage: $1,298Median monthly housing costs for units without a mortgage: $388Institutionalized population: 308
Crime in 2023 (reported by the sheriff's office or county police, not the county total):
Murders: 1
Rapes: 0
Robberies: 2
Assaults: 2
Burglaries: 2
Thefts: 10
Auto thefts: 7
Crime in 2022 (reported by the sheriff's office or county police, not the county total):
Murders: 0
Rapes: 0
Robberies: 0
Assaults: 1
Burglaries: 5
Thefts: 9
Auto thefts: 5
Single-family new house construction building permits:
2023: 52 buildings, average cost: $275,7002022: 50 buildings, average cost: $251,5002021: 58 buildings, average cost: $238,2002020: 37 buildings, average cost: $233,8002019: 37 buildings, average cost: $236,8002018: 42 buildings, average cost: $235,7002017: 28 buildings, average cost: $230,3002016: 21 buildings, average cost: $227,1002015: 28 buildings, average cost: $225,7002014: 29 buildings, average cost: $215,6002013: 39 buildings, average cost: $197,8002012: 35 buildings, average cost: $197,8002011: 23 buildings, average cost: $123,8002010: 33 buildings, average cost: $173,5002009: 50 buildings, average cost: $72,4002008: 25 buildings, average cost: $120,8002007: 86 buildings, average cost: $167,6002006: 55 buildings, average cost: $129,4002005: 94 buildings, average cost: $91,9002004: 83 buildings, average cost: $91,9002003: 60 buildings, average cost: $96,0002002: 55 buildings, average cost: $83,0002001: 98 buildings, average cost: $45,1002000: 107 buildings, average cost: $40,0001999: 179 buildings, average cost: $24,6001998: 175 buildings, average cost: $24,6001997: 153 buildings, average cost: $24,800Median real estate property taxes paid for housing units with mortgages in 2023: $1,271 (0.6%)Median real estate property taxes paid for housing units with no mortgage in 2023: $965 (0.5%)
Percentage of residents living in poverty in 2023: 19.1%Larue County:
19.1%Kentucky:
16.4%
for White Non-Hispanic residents , 60.2% for Black residents , 38.9% for Hispanic or Latino residents , 20.0% for American Indian residents , 2.8% for other race residents , 32.1% for two or more races residents )Median age of residents in 2023: 41.4 years oldMales: 40.3 years old, Females: 42.7 years old)Median age for: White residents: 42.5 years old, Black residents: 48.3 years old, Hispanic or Latino residents: 25.6 years old, Other race residents: 35.7 years old)
Area name: Elizabethtown, KY MSAFair market rent in 2006 for a 1-bedroom apartment in Larue County is $404 a month.Fair market rent for a 2-bedroom apartment is $487 a month.Fair market rent for a 3-bedroom apartment is $693 a month.
Larue County has a predicted average indoor radon screening level between 2 and 4 pCi/L (pico curies per liter) - Moderate Potential
Unemployment in November 2024: Current college students: 400People 25 years of age or older with a high school degree or higher: 86.0%People 25 years of age or older with a bachelor's degree or higher: 15.6%
Number of foreign born residents: 202 (83.0% naturalized citizens )
Larue County:
1.3%Whole state:
4.5%
Year of entry for the foreign-born population
7 2010 or later 30 2000 to 2009 52 1990 to 1999 35 1980 to 1989 7 1970 to 1979 8 Before 1970
Mean travel time to work (commute): � minutes
Percentage of county residents living and working in this county: 99.1%
Housing units in structures:
One, detached: 5,523One, attached: 13Two: 1153 or 4: 115 to 9: 11710 to 19: 42Mobile homes: 773
Housing units in Larue County with a mortgage: 2,696 (398 second mortgage , 0 home equity loan , 394 both second mortgage and home equity loan )Houses without a mortgage: 93
Here:
2.1% with mortgage State:
96.8% with mortgage
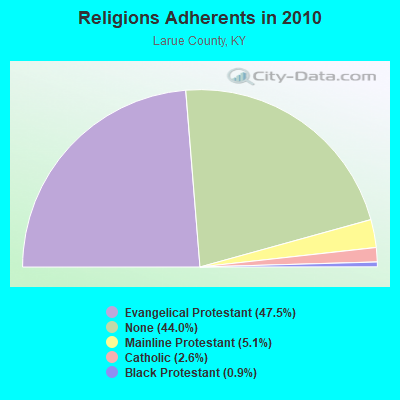
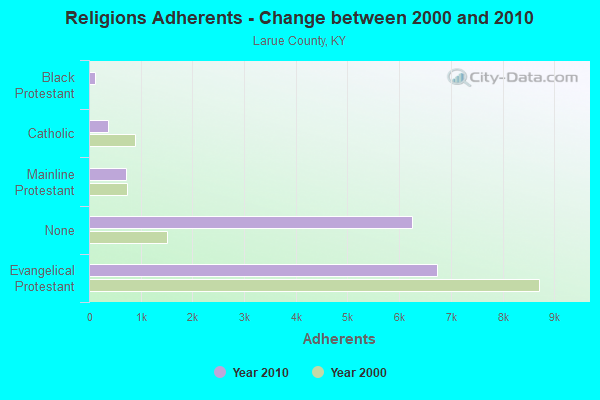
Religion statistics for Larue County
Religion Adherents Congregations Evangelical Protestant 6,740 30 Mainline Protestant 722 5 Catholic 370 1 Black Protestant 122 1 Other - - None 6,239 -
Larue County Religion Details Source: Clifford Grammich, Kirk Hadaway, Richard Houseal, Dale E.Jones, Alexei Krindatch, Richie Stanley and Richard H.Taylor. 2012. 2010 U.S.Religion Census: Religious Congregations & Membership Study. Association of Statisticians of American Religious Bodies. Jones, Dale E., et al. 2002. Congregations and Membership in the United States 2000. Nashville, TN: Glenmary Research Center. Food Environment Statistics: Number of grocery stores : 4Larue County :
2.93 / 10,000 pop.State :
2.19 / 10,000 pop.
Number of convenience stores (no gas) : 1This county :
0.73 / 10,000 pop.Kentucky :
0.74 / 10,000 pop.
Number of convenience stores (with gas) : 5Larue County :
3.66 / 10,000 pop.Kentucky :
4.36 / 10,000 pop.
Number of full-service restaurants : 5This county :
3.66 / 10,000 pop.State :
5.74 / 10,000 pop.
Adult diabetes rate : Larue County :
12.0%Kentucky :
11.0%
Adult obesity rate : Larue County :
29.2%State :
30.0%
Low-income preschool obesity rate : Agriculture in Larue County:
Average size of farms: 151 acresAverage value of agricultural products sold per farm: $23,712Average value of crops sold per acre for harvested cropland: $176.60The value of nursery, greenhouse, floriculture, and sod as a percentage of the total market value of agricultural products sold: 7.51%The value of livestock, poultry, and their products as a percentage of the total market value of agricultural products sold: 49.48%Average total farm production expenses per farm: $26,711Harvested cropland as a percentage of land in farms: 44.82%Irrigated harvested cropland as a percentage of land in farms: 0.20%Average market value of all machinery and equipment per farm: $48,615The percentage of farms operated by a family or individual: 91.89%Average age of principal farm operators: 55 yearsAverage number of cattle and calves per 100 acres of all land in farms: 21.15Milk cows as a percentage of all cattle and calves: 8.45%Corn for grain: 11757 harvested acres All wheat for grain: 1017 harvested acres Soybeans for beans: 15486 harvested acres Vegetables: 73 harvested acres Land in orchards: 69 acres Earthquake activity:
Larue County-area historical earthquake activity is significantly above Kentucky state average. It is 127% greater than the overall U.S. average. On 4/18/2008 at 09:36:59, a magnitude 5.4 (5.1 MB, 4.8 MS, 5.4 MW, 5.2 MW, Class: Moderate, Intensity: VI - VII) earthquake occurred 135.5 miles away from Larue County center On 7/27/1980 at 18:52:21, a magnitude 5.2 (5.1 MB, 4.7 MS, 5.0 UK, 5.2 UK) earthquake occurred 106.5 miles away from the county center On 4/18/2008 at 09:36:59, a magnitude 5.2 (5.2 MW, Depth: 8.9 mi) earthquake occurred 135.5 miles away from the county center On 6/18/2002 at 17:37:15, a magnitude 5.0 (4.3 MB, 4.6 MW, 5.0 LG) earthquake occurred 118.4 miles away from the county center On 6/10/1987 at 23:48:54, a magnitude 5.1 (4.9 MB, 4.4 MS, 4.6 MS, 5.1 LG) earthquake occurred 148.9 miles away from Larue County center On 4/18/2008 at 15:14:16, a magnitude 4.8 (4.5 MB, 4.8 MW, 4.6 MW, Class: Light, Intensity: IV - V) earthquake occurred 134.4 miles away from the county center Magnitude types: regional Lg-wave magnitude (LG), body-wave magnitude (MB), surface-wave magnitude (MS), moment magnitude (MW) Most recent natural disasters: Kentucky Severe Storms, Straight-line Winds, Tornadoes, Landslides, and Mudslides, Incident Period: May 21, 2024 - May 27, 2024, FEMA Id: 4804, Natural disaster type: Storm, Tornado, Mudslide, Landslide, Wind
Kentucky Covid-19 Pandemic, Incident Period: January 20, 2020, FEMA Id: 4497, Natural disaster type: Other
Kentucky Severe Winter Storm, Snowstorm, Flooding, Landslides, and Mudslides, Incident Period: March 03, 2015 to March 09, 2015, Major Disaster (Presidential) Declared DR-4218: May 12, 2015, FEMA Id: 4218, Natural disaster type: Snowstorm, Winter Storm, Mudslide, Landslide, Flood
Kentucky Severe Storms, Tornadoes, Straight-line Winds, and Flooding, Incident Period: February 29, 2012 to March 03, 2012, Major Disaster (Presidential) Declared DR-4057: March 06, 2012, FEMA Id: 4057, Natural disaster type: Storm, Tornado, Flood, Wind
Kentucky Severe Storms, Flooding, Mudslides, and Tornadoes, Incident Period: May 01, 2010 to June 01, 2010, Major Disaster (Presidential) Declared DR-1912: May 11, 2010, FEMA Id: 1912, Natural disaster type: Storm, Tornado, Mudslide, Flood
Kentucky Severe Winter Storm, Incident Period: January 27, 2009 to February 05, 2009, Emergency Declared EM-3302: January 28, 2009, FEMA Id: 3302, Natural disaster type: Winter Storm
Kentucky Severe Winter Storm and Flooding, Incident Period: January 26, 2009 to February 13, 2009, Major Disaster (Presidential) Declared DR-1818: February 05, 2009, FEMA Id: 1818, Natural disaster type: Winter Storm, Flood
Kentucky Hurricane Katrina Evacuation, Incident Period: August 29, 2005 to October 01, 2005, Emergency Declared EM-3231: September 10, 2005, FEMA Id: 3231, Natural disaster type: Hurricane
Kentucky Severe Winter Storm and Record Snow, Incident Period: December 21, 2004 to December 23, 2004, Major Disaster (Presidential) Declared DR-1578: February 08, 2005, FEMA Id: 1578, Natural disaster type: Winter Storm, Snow
Kentucky Severe Storms and Flooding, Incident Period: July 13, 2004 to July 15, 2004, Major Disaster (Presidential) Declared DR-1537: August 06, 2004, FEMA Id: 1537, Natural disaster type: Storm, Flood
10 other natural disasters have been reported since 1953. The number of natural disasters in Larue County (20) is near the US average (19).Major Disasters (Presidential) Declared: 14Emergencies Declared: 2Floods: 12, Storms: 12, Tornadoes: 6, Mudslides: 4, Winter Storms: 4, Landslides: 3, Winds: 3, Snows: 2, Blizzard: 1, Freeze: 1, Hurricane: 1, Snowstorm: 1, Other: 2 (Note: some incidents may be assigned to more than one category).
Means of transportation to work:
Drove a car alone : 2,152 (71.3%)Carpooled : 326 (10.8%)Taxicab, motorcycle, or other means : 6 (0.2%)Walked : 10 (0.3%)Worked at home : 540 (17.9%)
Most common industries in 2023 (%)
Males Females
Health care and social assistance (21%)Manufacturing (16%)Educational services (12%)Public administration (5%)Professional, scientific, and technical services (4%)Retail trade (4%)Accommodation and food services (4%)
Health care and social assistance (27%)Manufacturing (20%)Educational services (15%)Public administration (7%)Professional, scientific, and technical services (5%)Retail trade (5%)Accommodation and food services (5%)
Most common occupations in 2023 (%)
Males Females
Production occupations (16%)Construction and extraction occupations (12%)Material moving occupations (10%)Architecture and engineering occupations (8%)Building and grounds cleaning and maintenance occupations (7%)Sales and related occupations (7%)Transportation occupations (6%)
Office and administrative support occupations (19%)Educational instruction, and library occupations (11%)Production occupations (9%)Management occupations (7%)Healthcare support occupations (6%)Sales and related occupations (6%)Health diagnosing and treating practitioners and other technical occupations (6%)
Dominican Republic (50%)Mexico (32%)Greece (10%)Spain (9%)United Kingdom, excluding England and Scotland (2%)Philippines (1%)Norway (0%)
American (33%)English (14%)Irish (10%)German (4%)Scotch-Irish (2%)Scottish (2%)Welsh (1%)
People in group quarters in Larue County, Kentucky in 2010:
150 people in local jails and other municipal confinement facilities
122 people in nursing facilities/skilled-nursing facilities
36 people in residential treatment centers for juveniles (non-correctional)
5 people in workers' group living quarters and job corps centers
People in group quarters in Larue County, Kentucky in 2000:
123 people in nursing homes
71 people in local jails and other confinement facilities (including police lockups)
12 people in homes for the mentally retarded
8 people in other noninstitutional group quarters
Average gross adjusted income of non-migrant taxpayers in this county in 2020 was $52,014.
8.51% of this county's 2021 resident taxpayers lived in other counties in 2020 ( $46,785 average adjusted gross income)
Here:
8.51%Kentucky average:
7.04%
10 or fewer of this county's residents moved from foreign countries. relocated from other counties in Kentucky ($40,099 average AGI)relocated from other states ($6,686 average AGI)Larue County:
1.32%Kentucky average:
2.87%
Top counties from which taxpayers relocated into this county between 2020 and 2021: from Hardin County, KY from Bullitt County, KY from Jefferson County, KY from Nelson County, KY from Hart County, KY
8.14% of this county's 2020 resident taxpayers moved to other counties in 2021 ( $40,194 average adjusted gross income)
Here:
8.14%Kentucky average:
6.89%
10 or fewer of this county's residents moved to foreign countries. relocated to other counties in Kentucky ($34,402 average AGI)relocated to other states ($5,792 average AGI)Larue County:
1.14%Kentucky average:
2.73%
Top counties to which taxpayers relocated from this county between 2020 and 2021: Births per 1000 population from 1990 to 1999: 12.3Births per 1000 population from 2000 to 2006: 12.3
Deaths per 1000 population from 1990 to 1999: 10.5Deaths per 1000 population from 2000 to 2009: 11.1Deaths per 1000 population from 2010 to 2020: 11.9
Infant deaths per 1000 live births from 1990 to 1999: 11.6Infant deaths per 1000 live births from 2000 to 2006: 9.6
Population without health insurance coverage in 2018: 7.2%Persons under 19 years old without health insurance coverage in 2018: 4.7%Persons enrolled in hospital insurance and/or supplemental medical insurance (Medicare) in July 1, 2007: 2,552 (2,023 aged , 529 disabled )Children under 18 without health insurance coverage in 2007: 294 (9%)Most common underlying causes of death in Larue County, Kentucky in 1999 - 2019:
Acute myocardial infarction, unspecified (260)
Bronchus or lung, unspecified - Malignant neoplasms (183)
Unspecified dementia (84)
Chronic obstructive pulmonary disease, unspecified (81)
Alzheimer disease, unspecified (77)
Atherosclerotic heart disease (70)
Congestive heart failure (13)
Population without health insurance coverage in 2000: 13%Children under 18 without health insurance coverage in 2000: 9%
General practice office based MDs per 100,000 population in 2005: 964Medical specialist MDs per 100,000 population in 2005: 1,175Total births per 100,000 population, July 2005 - July 2006 : 15Total deaths per 100,000 population, July 2005 - July 2006: 58Limited-service eating places per 100,000 population in 2005 : 22Household type by relationship:
Households: 15,079
Male householders: 2,946 (733 living alone ), Female householders: 3,224 (779 living alone )3,270 spouses (3,270 opposite-sex spouses ), 416 unmarried partners , (414 opposite-sex unmarried partners ), 3,906 children (3,450 natural , 146 adopted , 302 stepchildren ), 397 grandchildren , 143 brothers or sisters , 150 parents , 1 foster children , 275 other relatives , 127 non-relatives In group quarters: 250
Size of family households: 1,710 2-persons , 1,207 3-persons , 724 4-persons , 413 5-persons , 186 6-persons , 43 7-or-more-persons .
Size of nonfamily households: 1,515 1-person , 327 2-persons , 25 3-persons .
2,073 married couples with children. single-parent households (214 men , 630 women ).
97.1% of residents of Larue speak English at home. of residents speak Spanish at home (72% speak English very well , 16% speak English well , 11% speak English not well , 2% don't speak English at all ).of residents speak other Indo-European language at home (100% speak English very well ).
In fiscal year 2004:
Federal Government expenditure: $74,324,000 ($5,512 per capita )Department of Defense expenditure: $2,828,000Federal direct payments to individuals for retirement and disability: $36,250,000Federal other direct payments to individuals: $18,214,000Federal direct payments not to individuals: $1,486,000Federal grants: $14,944,000Federal procurement contracts: $980,000 ($389,000 Department of Defense )Federal salaries and wages: $2,450,000 ($0,000 Department of Defense )Federal Government direct loans: $93,000Federal guaranteed/insured loans: $4,171,000Federal Government insurance: $4,682,000
Population change from April 1, 2000 to July 1, 2005:
Births: 829Here:
61 per 1000 residentsState:
69 per 1000 residents
Deaths: 800Here:
58 per 1000 residentsState:
50 per 1000 residents
Net international migration: -2
Here : State :
Net internal migration: +329Here:
+24 per 1000 residentsState:
+8 per 1000 residents
Total withdrawal of fresh water for public supply: 0.61 millions of gallons per day (all from surface)
Median number of rooms in houses and condos:
Median number of rooms in apartments:
Year house built in Larue County, Kentucky
59 2020 or later543 2010 to 2019977 2000 to 20091,025 1990 to 1999778 1980 to 1989785 1970 to 1979818 1960 to 1969558 1950 to 1959169 1940 to 1949794 1939 or earlier
87.1% of Larue County residents lived in the same house 1 years ago.
Out of people who lived in different houses, 28% lived in this county.
Out of people who lived in different counties, 82% lived in Kentucky.
Larue County:
87.1%State average:
87.7%
Place of birth for U.S.-born residents:
This state: 12,053Other state: 2,753Northeast: 276Midwest: 910South: 1,161West: 407 Private vs. public school enrollment:
Students in private schools in grades 1 to 8 (elementary and middle school): 255
Students in private schools in grades 9 to 12 (high school): 59
Students in private undergraduate colleges: 68
Larue County government finances - Expenditure in 2022:
Charges - Other: $1,240,000
Regular Highways: $1,000Construction - Regular Highways: $459,000
Correctional Institutions: $1,000 Central Staff Services: $1,000Current Operations - General - Other: $2,339,000
Correctional Institutions: $1,375,000 Health - Other: $986,000 Regular Highways: $889,000 Central Staff Services: $314,000 Solid Waste Management: $180,000 Financial Administration: $101,000 Judicial and Legal Services: $92,000 General Public Buildings: $89,000 Police Protection: $65,000 Parks and Recreation: $62,000 Natural Resources - Other: $61,000 Local Fire Protection: $29,000 Public Welfare - Other: $8,000Federal Intergovernmental - Other: $2,000
General - Interest on Debt: $42,000
Intergovernmental to Local - Other - General - Other: $66,000
Local Intergovernmental - Other: $7,000
Miscellaneous - General Revenue - Other: $283,000
Sale of Property: $130,000 Interest Earnings: $38,000 Rents: $13,000State Intergovernmental - Other: $3,415,000
Tax - Property: $1,843,000
Public Utilities Sales: $635,000 Corporation License: $112,000 Documentary and Stock Transfer: $73,000Total Salaries and Wages: $2,568,000
Larue County government finances - Revenue in 2022:
Charges - Other: $1,240,000
Regular Highways: $1,000Construction - Regular Highways: $459,000
Correctional Institutions: $1,000 Central Staff Services: $1,000Current Operations - General - Other: $2,339,000
Correctional Institutions: $1,375,000 Health - Other: $986,000 Regular Highways: $889,000 Central Staff Services: $314,000 Solid Waste Management: $180,000 Financial Administration: $101,000 Judicial and Legal Services: $92,000 General Public Buildings: $89,000 Police Protection: $65,000 Parks and Recreation: $62,000 Natural Resources - Other: $61,000 Local Fire Protection: $29,000 Public Welfare - Other: $8,000Federal Intergovernmental - Other: $2,000
General - Interest on Debt: $42,000
Intergovernmental to Local - Other - General - Other: $66,000
Local Intergovernmental - Other: $7,000
Miscellaneous - General Revenue - Other: $283,000
Sale of Property: $130,000 Interest Earnings: $38,000 Rents: $13,000State Intergovernmental - Other: $3,415,000
Tax - Property: $1,843,000
Public Utilities Sales: $635,000 Corporation License: $112,000 Documentary and Stock Transfer: $73,000Total Salaries and Wages: $2,568,000
Larue County government finances - Debt in 2022:
Charges - Other: $1,240,000
Regular Highways: $1,000Construction - Regular Highways: $459,000
Correctional Institutions: $1,000 Central Staff Services: $1,000Current Operations - General - Other: $2,339,000
Correctional Institutions: $1,375,000 Health - Other: $986,000 Regular Highways: $889,000 Central Staff Services: $314,000 Solid Waste Management: $180,000 Financial Administration: $101,000 Judicial and Legal Services: $92,000 General Public Buildings: $89,000 Police Protection: $65,000 Parks and Recreation: $62,000 Natural Resources - Other: $61,000 Local Fire Protection: $29,000 Public Welfare - Other: $8,000Federal Intergovernmental - Other: $2,000
General - Interest on Debt: $42,000
Intergovernmental to Local - Other - General - Other: $66,000
Local Intergovernmental - Other: $7,000
Miscellaneous - General Revenue - Other: $283,000
Sale of Property: $130,000 Interest Earnings: $38,000 Rents: $13,000State Intergovernmental - Other: $3,415,000
Tax - Property: $1,843,000
Public Utilities Sales: $635,000 Corporation License: $112,000 Documentary and Stock Transfer: $73,000Total Salaries and Wages: $2,568,000
Larue County government finances - Cash and Securities in 2022:
Charges - Other: $1,240,000
Regular Highways: $1,000Construction - Regular Highways: $459,000
Correctional Institutions: $1,000 Central Staff Services: $1,000Current Operations - General - Other: $2,339,000
Correctional Institutions: $1,375,000 Health - Other: $986,000 Regular Highways: $889,000 Central Staff Services: $314,000 Solid Waste Management: $180,000 Financial Administration: $101,000 Judicial and Legal Services: $92,000 General Public Buildings: $89,000 Police Protection: $65,000 Parks and Recreation: $62,000 Natural Resources - Other: $61,000 Local Fire Protection: $29,000 Public Welfare - Other: $8,000Federal Intergovernmental - Other: $2,000
General - Interest on Debt: $42,000
Intergovernmental to Local - Other - General - Other: $66,000
Local Intergovernmental - Other: $7,000
Miscellaneous - General Revenue - Other: $283,000
Sale of Property: $130,000 Interest Earnings: $38,000 Rents: $13,000State Intergovernmental - Other: $3,415,000
Tax - Property: $1,843,000
Public Utilities Sales: $635,000 Corporation License: $112,000 Documentary and Stock Transfer: $73,000Total Salaries and Wages: $2,568,000
Supplemental Security Income (SSI) in 2006:
Total number of recipients: 503Number of aged recipients: 68Number of blind and disabled recipients: 435Number of recipients under 18: 74Number of recipients between 18 and 64: 307Number of recipients older than 64: 122Number of recipients also receiving OASDI: 211Amount of payments (thousands of dollars): 222
Most common first names in Larue County, KY among deceased individuals Name Count Lived (average)
William 81 76.7 years Mary 72 79.6 years James 69 72.7 years John 51 76.5 years Robert 41 70.9 years Charles 30 75.4 years George 23 75.5 years Edna 22 79.8 years Joseph 20 69.3 years David 20 70.7 years
Most common last names in Larue County, KY among deceased individuals Last name Count Lived (average)
Brown 62 74.6 years Skaggs 43 76.3 years Warren 34 79.6 years Williams 30 74.8 years Smith 30 70.8 years Thompson 30 74.2 years Howell 30 80.5 years Cruse 28 75.5 years Gardner 27 78.0 years Reed 23 74.6 years
Businesses in Larue County, KY
Name Count Name Count
Curves 1 McDonald's 1 FedEx 1 Papa John's Pizza 1 GNC 1 Pizza Hut 1 H&R Block 1 Rite Aid 1 Hardee's 1 Subway 1 La-Z-Boy 1 U-Haul 1 Lane Furniture 1


 , Marin County, California
  , Martin County
  .
.