Estimated zip code population in 2023: 1,812 Zip code population in 2010: 1,963 Zip code population in 2000: 1,518
Houses and condos: 714 Renter-occupied apartments: 111
% of renters here:
17%
State:
44%
March 2022 cost of living index in zip code 95372: 91.1 (less than average, U.S. average is 100)
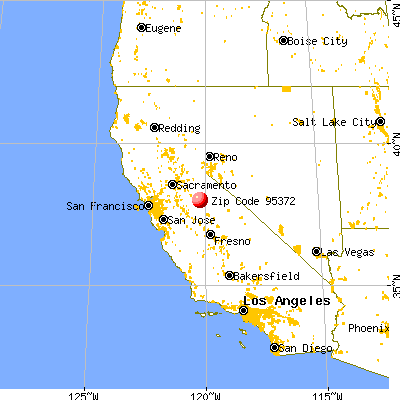
Land area: 2.7 sq. mi. Water area: 0.0 sq. mi.
Population density: 676 people per square mile
(low).
OSM Map
General Map
Google Map
MSN Map
OSM Map
General Map
Google Map
MSN Map
OSM Map
General Map
Google Map
MSN Map
OSM Map
General Map
Google Map
MSN Map
Please wait while loading the map...
Real estate property taxes paid for housing units in 2023:
This zip code:
0.8% ($2,822)
California:
0.7% ($5,114)
Median real estate property taxes paid for housing units with mortgages in 2023: $2,642 (0.7%) Median real estate property taxes paid for housing units with no mortgage in 2023: $3,163 (0.8%)
Business Search- 14 Million verified businesses
Males: 988
(54.5%)
Females: 823
(45.5%)
For population 25 years and over in 95372:
High school or higher: 93.8%
Bachelor's degree or higher: 22.1%
Graduate or professional degree: 6.2%
Unemployed: 11.5%
Mean travel time to work (commute): 44.2 minutes
For population 15 years and over in 95372:
Never married: 24.7%
Now married: 56.2%
Separated: 2.1%
Widowed: 2.6%
Divorced: 14.4%
Zip code 95372 compared to state average:
Median house value below state average.
Unemployed percentage above state average.
Black race population percentage significantly below state average.
Hispanic race population percentage below state average.
Foreign-born population percentage significantly below state average.
Renting percentage significantly below state average.
Length of stay since moving in significantly above state average.
Number of college students significantly below state average.
Percentage of population with a bachelor's degree or higher below state average.
Estimated median house/condo value in 2023: $369,893
95372:
$369,893
California:
$725,800
According to our research of California and other state lists, there was 1 registered sex offender living in 95372 zip code as of April 28, 2025. The ratio of all residents to sex offenders in zip code 95372 is 2,097 to 1. The ratio of registered sex offenders to all residents in this zip code is much lower than the state average.
Median resident age:
This zip code:
37.6 years
California median age:
38.2 years
Average household size:
This zip code:
2.7 people
California:
2.8 people
Averages for the 2020 tax year for zip code 95372, filed in 2021:
Average Adjusted Gross Income (AGI) in 2020: $67,466 (Individual Income Tax Returns)
Here:
$67,466
State:
$95,910
Salary/wage: $58,988 (reported on 72.9% of returns)
Here:
$58,988
State:
$77,331
(% of AGI for various income ranges: 975.8% for AGIs below $25k, 3755.9% for AGIs $25k-50k, 6319.3% for AGIs $50k-75k, 8793.0% for AGIs $75k-100k, 14850.8% for AGIs $100k-200k)
Taxable interest for individuals: $633 (reported on 44.1% of returns)
This zip code:
$633
California:
$2,294
(% of AGI for various income ranges: 27.4% for AGIs below $25k, 20.0% for AGIs $25k-50k, 13.6% for AGIs $50k-75k, 69.0% for AGIs $75k-100k, 65.8% for AGIs $100k-200k)
Ordinary dividends: $4,441 (reported on 18.6% of returns)
Here:
$4,441
State:
$10,949
(% of AGI for various income ranges: 62.6% for AGIs below $25k, 70.6% for AGIs $25k-50k, 100.0% for AGIs $50k-75k, 75.0% for AGIs $75k-100k, 435.8% for AGIs $100k-200k)
Net capital gain/loss in AGI: +$10,976 (reported on 17.8% of returns)
Here:
+$10,976
State:
+$49,306
(% of AGI for various income ranges: 28.9% for AGIs below $25k, 12.4% for AGIs $25k-50k, 19.3% for AGIs $50k-75k, 118.0% for AGIs $75k-100k, 1736.7% for AGIs $100k-200k)
Profit/loss from business: +$13,005 (reported on 16.9% of returns)
Here:
+$13,005
State:
+$15,671
(% of AGI for various income ranges: 191.6% for AGIs below $25k, 254.1% for AGIs $25k-50k, 480.0% for AGIs $50k-75k, 493.0% for AGIs $75k-100k, 533.3% for AGIs $100k-200k)
Taxable individual retirement arrangement distribution: $15,346 (reported on 11.0% of returns)
95372:
$15,346
California:
$23,505
(% of AGI for various income ranges: 124.2% for AGIs below $25k, 210.0% for AGIs $25k-50k, 423.6% for AGIs $50k-75k, 674.2% for AGIs $100k-200k)
Total itemized deductions: $28,100 (reported on 11.0% of returns)
Here:
$28,100
State:
$39,517
(% of AGI for various income ranges: 354.7% for AGIs $25k-50k, 905.0% for AGIs $50k-75k, 1485.8% for AGIs $100k-200k)
Charity contributions: $5,440 (reported on 8.5% of returns)
Here:
$5,440
State:
$12,598
(% of AGI for various income ranges: 30.5% for AGIs below $25k, 81.4% for AGIs $50k-75k, 310.0% for AGIs $100k-200k)
Taxes paid: $6,885 (reported on 11.0% of returns)
95372:
$6,885
State:
$8,807
(% of AGI for various income ranges: 54.1% for AGIs $25k-50k, 182.1% for AGIs $50k-75k, 456.7% for AGIs $100k-200k)
Earned income credit: $1,664 (reported on 11.9% of returns)
Here:
$1,664
State:
$2,074
(% of AGI for various income ranges: 73.2% for AGIs below $25k, 55.3% for AGIs $25k-50k)
Percentage of individuals using paid preparers for their 2020 taxes: 95.8%
Here:
96%
State:
92%
(% for various income ranges: 93.5% for AGIs below $25k, 96.3% for AGIs $25k-50k, 100.0% for AGIs $50k-75k, 93.3% for AGIs $75k-100k, 95.0% for AGIs $100k-200k, 100.0% for AGIs over 200k)
Averages for the 2012 tax year for zip code 95372, filed in 2013:
Average Adjusted Gross Income (AGI) in 2012: $49,086 (Individual Income Tax Returns)
Here:
$49,086
State:
$72,726
Salary/wage: $40,464 (reported on 76.9% of returns)
Here:
$40,464
State:
$59,079
(% of AGI for various income ranges: 61.7% for AGIs below $25k, 66.6% for AGIs $25k-50k, 64.4% for AGIs $50k-75k, 64.0% for AGIs $75k-100k, 61.1% for AGIs $100k-200k)
Taxable interest for individuals: $773 (reported on 41.9% of returns)
This zip code:
$773
California:
$2,146
(% of AGI for various income ranges: 2.4% for AGIs below $25k, 0.8% for AGIs $25k-50k, 0.4% for AGIs $50k-75k, 0.3% for AGIs $75k-100k, 0.4% for AGIs $100k-200k)
Ordinary dividends: $2,914 (reported on 18.8% of returns)
Here:
$2,914
State:
$9,308
(% of AGI for various income ranges: 2.9% for AGIs below $25k, 1.1% for AGIs $25k-50k, 0.8% for AGIs $50k-75k, 1.0% for AGIs $75k-100k, 0.8% for AGIs $100k-200k)
Net capital gain/loss in AGI: +$4,271 (reported on 14.5% of returns)
Here:
+$4,271
State:
+$30,460
(% of AGI for various income ranges: 0.3% for AGIs $25k-50k, 4.2% for AGIs $100k-200k)
Profit/loss from business: +$11,376 (reported on 21.4% of returns)
Here:
+$11,376
State:
+$17,064
(% of AGI for various income ranges: 12.7% for AGIs below $25k, 6.7% for AGIs $25k-50k, 7.2% for AGIs $50k-75k, 2.1% for AGIs $75k-100k, 1.6% for AGIs $100k-200k)
Taxable individual retirement arrangement distribution: $10,829 (reported on 12.0% of returns)
95372:
$10,829
California:
$19,557
(% of AGI for various income ranges: 3.4% for AGIs below $25k, 2.9% for AGIs $25k-50k, 3.7% for AGIs $50k-75k, 5.3% for AGIs $75k-100k)
Total itemized deductions: $20,391 (27% of AGI, reported on 37.6% of returns)
Here:
$20,391
State:
$34,004
Here:
26.9% of AGI
State:
22.7% of AGI
(% of AGI for various income ranges: 16.8% for AGIs below $25k, 13.1% for AGIs $25k-50k, 16.7% for AGIs $50k-75k, 14.9% for AGIs $75k-100k, 16.4% for AGIs $100k-200k)
Charity contributions: $2,652 (reported on 28.2% of returns)
Here:
$2,652
State:
$4,659
(% of AGI for various income ranges: 0.5% for AGIs below $25k, 1.3% for AGIs $25k-50k, 2.0% for AGIs $50k-75k, 1.4% for AGIs $75k-100k, 1.7% for AGIs $100k-200k)
Taxes paid: $5,800 (reported on 37.6% of returns)
95372:
$5,800
State:
$14,448
(% of AGI for various income ranges: 2.6% for AGIs below $25k, 2.8% for AGIs $25k-50k, 4.0% for AGIs $50k-75k, 4.4% for AGIs $75k-100k, 6.3% for AGIs $100k-200k)
Earned income credit: $2,075 (reported on 17.1% of returns)
Here:
$2,075
State:
$2,286
(% of AGI for various income ranges: 5.4% for AGIs below $25k, 1.0% for AGIs $25k-50k)
Percentage of individuals using paid preparers for their 2012 taxes: 68.4%
Here:
68%
State:
64%
(% for various income ranges: 60.9% for AGIs below $25k, 71.4% for AGIs $25k-50k, 75.0% for AGIs $50k-75k, 75.0% for AGIs $75k-100k, 72.7% for AGIs $100k-200k)
Averages for the 2004 tax year for zip code 95372, filed in 2005:
Average Adjusted Gross Income (AGI) in 2004: $40,139 (Individual Income Tax Returns)
Here:
$40,139
State:
$58,600
Salary/wage: $34,597 (reported on 80.2% of returns)
Here:
$34,597
State:
$49,455
(% of AGI for various income ranges: 103.6% for AGIs below $10k, 67.0% for AGIs $10k-25k, 72.7% for AGIs $25k-50k, 73.2% for AGIs $50k-75k, 74.6% for AGIs $75k-100k, 54.8% for AGIs over 100k)
Taxable interest for individuals: $1,113 (reported on 45.6% of returns)
This zip code:
$1,113
California:
$2,365
(% of AGI for various income ranges: 4.9% for AGIs below $10k, 3.0% for AGIs $10k-25k, 1.0% for AGIs $25k-50k, 0.6% for AGIs $50k-75k, 0.8% for AGIs $75k-100k, 1.4% for AGIs over 100k)
Taxable dividends: $3,045 (reported on 19.1% of returns)
Here:
$3,045
State:
$4,746
(% of AGI for various income ranges: 2.5% for AGIs below $10k, 1.9% for AGIs $10k-25k, 0.7% for AGIs $25k-50k, 0.2% for AGIs $50k-75k, 0.6% for AGIs $75k-100k, 4.0% for AGIs over 100k)
Net capital gain/loss: +$13,200 (reported on 15.4% of returns)
Here:
+$13,200
State:
+$23,418
(% of AGI for various income ranges: -4.0% for AGIs below $10k, 0.8% for AGIs $10k-25k, 1.4% for AGIs $25k-50k, 1.8% for AGIs $50k-75k, 4.5% for AGIs $75k-100k, 16.0% for AGIs over 100k)
Profit/loss from business: +$15,164 (reported on 18.3% of returns)
Here:
+$15,164
State:
+$16,826
(% of AGI for various income ranges: 6.3% for AGIs below $10k, 11.9% for AGIs $10k-25k, 7.3% for AGIs $25k-50k, 8.3% for AGIs $50k-75k, 5.6% for AGIs $75k-100k, 3.4% for AGIs over 100k)
IRA payment deduction: $3,556 (reported on 3.6% of returns)
95372:
$3,556
California:
$3,192
(% of AGI for various income ranges: 0.6% for AGIs $10k-25k, 0.5% for AGIs $50k-75k, 0.7% for AGIs $75k-100k)
Total itemized deductions: $18,023 (28% of AGI, reported on 38.1% of returns)
Here:
$18,023
State:
$28,113
Here:
27.7% of AGI
State:
25.3% of AGI
(% of AGI for various income ranges: 32.3% for AGIs below $10k, 14.1% for AGIs $10k-25k, 14.9% for AGIs $25k-50k, 18.6% for AGIs $50k-75k, 19.9% for AGIs $75k-100k, 16.0% for AGIs over 100k)
Charity contributions deductions: $2,209 (3% of AGI, reported on 31.7% of returns)
Here:
$2,209
State:
$3,923
Here:
3.3% of AGI
State:
3.3% of AGI
(% of AGI for various income ranges: 1.8% for AGIs below $10k, 1.1% for AGIs $10k-25k, 1.1% for AGIs $25k-50k, 1.8% for AGIs $50k-75k, 2.1% for AGIs $75k-100k, 2.4% for AGIs over 100k)
Total tax: $4,979 (reported on 77.5% of returns)
95372:
$4,979
State:
$10,761
(% of AGI for various income ranges: 4.7% for AGIs below $10k, 5.1% for AGIs $10k-25k, 7.0% for AGIs $25k-50k, 8.6% for AGIs $50k-75k, 10.1% for AGIs $75k-100k, 15.7% for AGIs over 100k)
Earned income credit: $1,409 (reported on 16.4% of returns)
Here:
$1,409
State:
$1,763
Percentage of individuals using paid preparers for their 2004 taxes: 65.5%
Here:
66%
State:
66%
(% for various income ranges: 53.1% for AGIs below $10k, 63.4% for AGIs $10k-25k, 71.5% for AGIs $25k-50k, 67.5% for AGIs $50k-75k, 69.4% for AGIs $75k-100k, 77.8% for AGIs over 100k)
Household received Food Stamps/SNAP in the past 12 months: 44 Household did not receive Food Stamps/SNAP in the past 12 months: 624
Women who had a birth in the past 12 months: 37 (37 now married, 0 unmarried) Women who did not have a birth in the past 12 months: 239 (151 now married, 85 unmarried)
Housing units in zip code 95372 with a mortgage: 434 (73 second mortgage, 74 both second mortgage and home equity loan) Residents with income below the poverty level in 2023:
This zip code:
3.8%
Whole state:
12.0%
Median number of rooms in houses and condos:
Here:
5.3
State:
6.0
Median number of rooms in apartments:
Here:
3.1
State:
3.9
Notable locations in this zip code not listed on our city pages
Size of family households: 226 2-persons, 86 3-persons, 65 4-persons, 48 5-persons, 20 6-persons
Size of nonfamily households: 99 1-person, 131 2-persons
326 married couples with children.
0 single-parent households ().
97.8% of residents of 95372 zip code speak English at home.
Foreign born population: 60 (3.3%) (100.0% of them are naturalized citizens)
This zip code:
3.3%
Whole state:
27.3%
68%Guyana
12%Indonesia
22%English
10%American
4%Irish
3%European
3%German
2%Canadian
2%Scottish
Year of entry for the foreign-born population
02010 or later
02000 to 2009
01990 to 1999
92Before 1990
45.9%Bottled, tank, or LP gas
25.1%Wood
20.4%Electricity
8.9%Utility gas
Population in 1990: 1,566.
Place of birth for U.S.-born residents:
This state: 1,600
Northeast: 8
South: 77
West: 19
54% of the 95372 zip code residents lived in the same house 5 years ago. Out of people who lived in different houses, 68% lived in this county. Out of people who lived in different counties, 50% lived in California.
91% of the 95372 zip code residents lived in the same house 1 year ago. Out of people who lived in different houses, 72% moved from this county. Out of people who lived in different houses, 27% moved from different state.
Private vs. public school enrollment:
Students in private schools in grades 1 to 8 (elementary and middle school): 111
Here:
55.2%
California:
10.0%
Students in private schools in grades 9 to 12 (high school):
Here:
0.0%
California:
8.8%
Occupation by median earnings in the past 12 months ($)
39,505Office and administrative support occupations
31,947Installation, maintenance, and repair occupations
Top industries in this zip code by the number of employees in 2005:
Health Care and Social Assistance: Services for the Elderly and Persons with Disabilities (20-49 employees: 1 establishment)
Construction: New Single-Family Housing Construction (except Operative Builders) (5-9: 1, 1-4: 6)
Accommodation and Food Services: Limited-Service Restaurants (10-19: 1)
Wholesale Trade: Drugs and Druggists' Sundries Merchant Wholesalers (10-19: 1)
Other Services (except Public Administration): Civic and Social Organizations (5-9: 1)
Other Services (except Public Administration): Religious Organizations (5-9: 1)
Construction: Electrical Contractors (5-9: 1)
Administrative and Support and Waste Management and Remediation Services: Landscaping Services (1-4: 2)
Fatal accident statistics in 2012:
Fatal accident count: 1
Vehicles involved in fatal accidents: 1
Fatal accidents caused by drunken drivers: 1
Fatalities: 1
Persons involved in fatal accidents: 1
Pedestrians involved in fatal accidents: 0
Most common first names in zip code 95372 among deceased individuals
Name
Count
Lived (average)
Mary
14
74.5 years
John
13
71.5 years
George
11
74.6 years
James
10
77.1 years
Robert
9
79.9 years
William
7
73.1 years
Dorothy
7
81.9 years
Jack
7
75.0 years
Charles
6
72.2 years
Paul
6
83.2 years
Most common last names in zip code 95372 among deceased individuals
Last name
Count
Lived (average)
Smith
6
82.5 years
James
5
77.2 years
Anderson
4
89.0 years
Johnson
4
82.0 years
Oliver
4
75.7 years
Davis
3
67.4 years
Jones
3
76.0 years
Foster
3
80.0 years
Carothers
3
46.0 years
Cardoza
3
71.0 years
Discuss Soulsbyville, California (CA) on our hugely popular California forum.


 Nearest zip codes: 95370, 95379, 95346, 95383, 95310, 95305.


