More than just K-12 substr. MG1655

More than 500 E. coli strain databases are available via the "Change Current Database" button above. They are less curated than EcoCyc but work with all our website tools, from Omics Dashboard to metabolic route search.

Collage
	      of photos of 6 E. coli strains

Except for top right (CC By 2.5) all images public domain.

The side of a brick building on which is painted
		 a large yellow rectangle with the slogan "Nightly
		 bile beans keep you healthy, bright-eyed and slim."

Cropped image of signage by Ilovetigerplanes. Used under creative commons license.

Hazards of the Gut Habitat: Bile

Bile acids are secreted into the intestine, where they promote digestion and absorption of dietary fats. Bile salts are able to diffuse across the inner membrane of E. coli and are cytotoxic. The MdtM antiporter contributes significantly to E. coli's resistance to bile salts, which may represent the natural substrate of this inner membrane transporter.

Cascade to the Rescue!

From protecting E. coli against phage infection to the promise of gene therapy: How does Cascade do it? Recent crystal structures of the enzyme are improving our understanding of this enzyme.

Learn More

Crystal structure of E. coli Cascade protein

Crystal structure of E. coli Cascade. Image from the RCSB PDB (www.rcsb.org) of PDB ID 1VY8 (R.N. Jackson et al. (2014) Science 345:1473-9).

A quantitative metabolic model for E. coli K-12 derived from EcoCyc is available.

Learn More

EcoCyc pathway display with popup bar charts
			showing changing metabolic flux over time for different reactions.

Metabolic Model for E. coli K-12

Maintaining the Outer Membrane

The 5-subunit Bam complex is responsible for the assembly and insertion of beta-barrel proteins into the OM of E. coli. Although a full understanding of its function in beta-barrel folding remains elusive, recent work has yielded many insights into subunit interaction and activity.

schematic showing arrangement of components of
		   the Bam complex with respect to the outer membrane

Schematic diagram of the Bam complex, Fig. 1a in Kim et al.. Used under creative commons license.

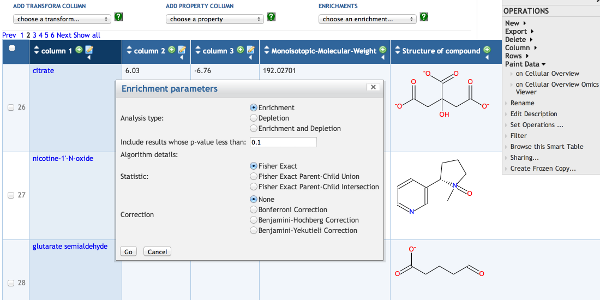
Metabolomics Data Analysis

Multiple tools are available in this website for metabolomics data analysis.

Learn More

Dialog for specifying parameters in an
			enrichment analysis superimposed over an image
			of a SmartTable

SmartTable display generated by Pathway Tools.

Comparative Genome Analysis

Multiple comparative analysis tools are available in this website.

Learn More

A fragment of a Comparative Genome
			Browser display showing the region around
			the trpA gene for 5 E. coli
			strains. Orthologous genes are colored
			the same color in each strain.

Multi-organism Genome Browser image generated by Pathway Tools.

Gene Expression Data Analysis

Multiple tools are available in this website for analysis of gene expression data.

Learn More

a portion of a cellular overview diagram,
			  overlaid with a gene expression time series
			  dataset. Detail popups are shown for three
			  reactions in three different styles: a bar
			  chart, a heatmap, and a line graph.

Cellular Overview Omics Viewer image generated by Pathway Tools.

EcoCyc E. coli Database

EcoCyc captures information from 44,000 publications for Escherichia coli K-12 substr. MG1655. Use EcoCyc to search for knowledge on E. coli genes, regulation, and metabolism; analyze transcriptomics data; perform comparative analyses; and run a metabolic model.

New to EcoCyc? See the EcoCyc project overview.

EcoCyc is part of the larger BioCyc collection of thousands of Pathway/Genome Databases for sequenced genomes. Click "Change Current Database" above to explore the available databases.

What people are saying

"BsubCyc is a tool of the utmost value."

Penn State

Paul Babitzke
Prof. of Biochemistry
& Molecular Biology

"My lab uses these resources on a daily basis."

University of Wisconsin

Patricia Kiley,
Professor and Chair,
Dep't. of Biomolecular Chemistry

"We rely on BioCyc's Gene Pages and Overview Diagrams almost daily."

University of Minnesota

Arkady Khodursky
Assoc. Prof. Biochemistry

"We use BioCyc and MetaCyc extensively to investigate the metabolic and regulatory processes of organisms we study."

Pacific Northwest National Lab

William Cannon, Team Lead
Computational Biology

"BioCyc is the go-to resource of knowledge and tools for Ginkgo scientists."

Ginkgo Bioworks

"BioCyc is a tremendous resource for pathway analysis in metabolomics."

University of Georgia

Art Edison, Dept of Genetics

"We make extensive use of the BioCyc full metabolic network diagram for omics data analysis."

Great Lakes Bioenergy

Timothy J. Donohue, Director

"I have not found another database that has a better interface than BioCyc."

University of Michigan

Gary B. Huffnagle, Professor
Microbiology and Immunology

Learning Library

Tutorial Series

Tutorial #1: Introduction to BioCyc
These six sequential segments, giving you a guided tour of the BioCyc collection in concise bites. To download or view, just click on one of the links following each segment's name.
Tutorial #2: Introduction to SmartTables
The following Tutorial will guide you through SmartTables, which enable you to create, upload, share, and analyze sets of genes, metabolites, pathways, and sequence sites. The Tutorial is broken up into parts, ranging from basic operations to more advanced uses such as gene expression analysis and metabolomics. To download or view, click one of the links below.
Tutorial #3: Zoomable Metabolic Map, Comparative Tools, Regulatory Network
This tutorial introduces users to many of the advanced tools available on the BioCyc.org website for navigating cellular networks, analyzing large-scale datasets, and comparing organisms.
Tutorial #4: Omics Data Analysis
This tutorial will show you how to use BioCyc's tools for omics data analysis, including the cellular omics viewer, the omics dashboard, and other tools.
Tutorial #5: Pathway Collages
Pathway collages are multi-pathway diagrams that you can customize by, for example, overlaying omics data, altering the relative positions of pathways, and modifying connections among pathways. Learn how to generate, customize and export high-quality pathway-collage diagrams showing collections of user-specified pathways.
Tutorial #6: Creating a Pathway/Genome Database
Tutorial #7: Using the Structured Advanced Query Page
An introduction to the Structured Advanced Query Page, which allows complex queries and queries across one or more databases in the BioCyc collection. You'll learn about:The basic steps of setting up an advanced query; Four examples of increasingly complex queries, including how to query across multiple databases; Where to learn more about the structure of BioCyc databases.