Marcellus play.ppt
- 1. Marcellus shale structure map EIA
- 2. Marcellus play regional structure
- 3. Marcellus depth map MCOR
- 4. Marcellus depth structure + wet gas vs dry gas windows
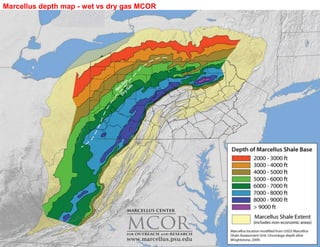
- 5. Marcellus depth map - wet vs dry gas MCOR
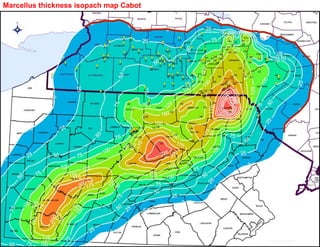
- 6. Marcellus thickness isopach map Cabot
- 7. Marcellus shale low - normal - over pressure areas map
- 8. Marcellus gas play map EIA
- 9. Marcellus - Utica - Devonian - Antrim - New Albany plays MCOR map
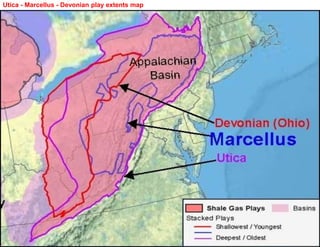
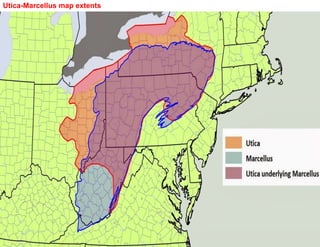
- 10. Utica - Marcellus - Devonian play extents map
- 12. PA stacked pays in Devonian - Marcellus - Utica
- 13. Utica - Marcellus - Devonian gas in place map Range Resources
- 14. Marcellus stratigraphy WV + PA
- 15. Utica -Marcellus cartoon cross section OH - PA
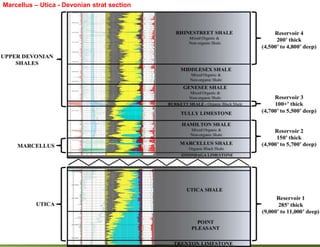
- 16. Marcellus – Utica - Devonian strat section
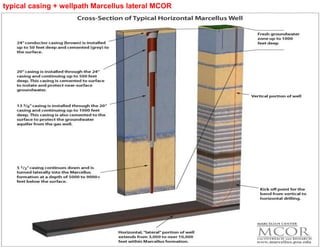
- 17. typical casing + wellpath Marcellus lateral MCOR
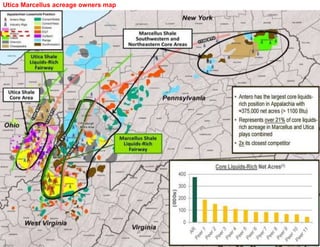
- 18. Utica Marcellus acreage owners map
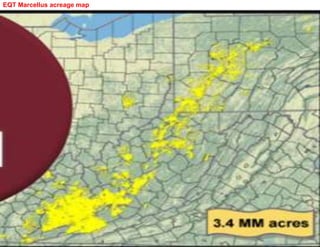
- 19. EQT Marcellus acreage map
- 20. NW WV Marcellus production + operators
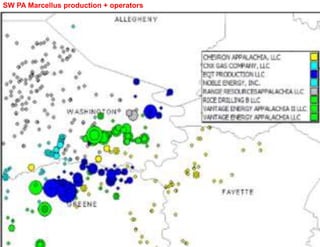
- 21. SW PA Marcellus production + operators
- 22. Marcellus shale thickness map MCOR
- 23. Marcellus organic carbon thickness map
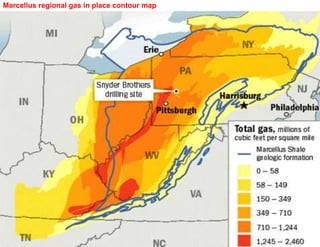
- 24. Marcellus regional gas in place contour map
- 25. Marcellus 3 and 6 month mcfg cum prod increase 2013 to 2016
- 26. Marcellus peak IP per 1000 ft lateral vs lbs proppant 2013 to 2016
- 27. Marcellus - Utica - Barnett - Haynesville break even gas price
- 28. Marcellus wet gas economics + prod type curve
- 29. Marcellus dry gas economics + prod type curve
- 30. Marcellus dry gas IRR + NPV vs well cost.jpg
- 31. Diamondback Marcellus – Utica break even price vs various oil plays
- 32. Marcellus ft spacing between wells vs other resource plays
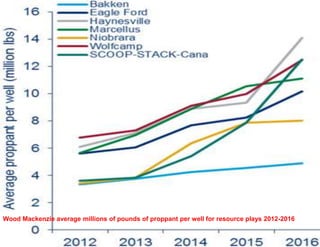
- 33. Wood Mackenzie average millions of pounds of proppant per well for resource plays 2012-2016
- 34. Marcellus – Utica proppant pounds per foot vs other resource plays
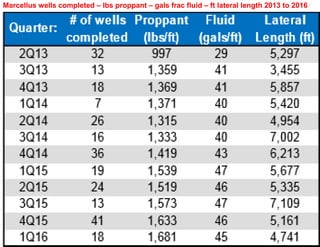
- 35. Marcellus wells completed – lbs proppant – gals frac fluid – ft lateral length 2013 to 2016
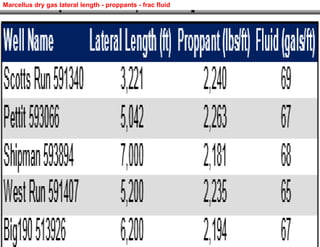
- 37. Marcellus dry gas lateral length - proppants - frac fluid
- 38. Marcellus – Utica vs other resource play gas prod 2000 to 2016
- 39. Marcellus – Utica vs other resource plays detail oil production 2007 to 2016
- 40. detail resource play oil production 2007 to 2016 without Permian
- 41. Marcellus – Utica vs other resource plays oil prod 2002 to 2016
- 42. Marcellus – Utica new well production per rig vs other resource plays
- 43. Marcellus – Utica vs other major US resource play oil production per rig 2010 to 2016


