Milford, Pennsylvania Submit your own pictures of this borough and show them to the world
OSM Map
General Map
Google Map
MSN Map
OSM Map
General Map
Google Map
MSN Map
OSM Map
General Map
Google Map
MSN Map
OSM Map
General Map
Google Map
MSN Map
Please wait while loading the map...
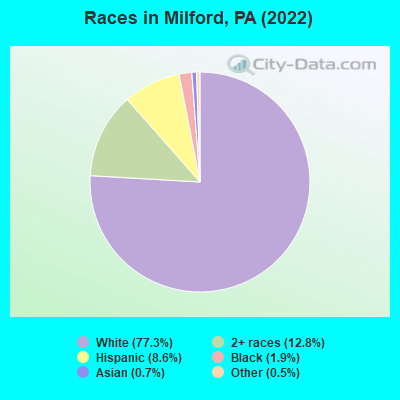
Population in 2022: 1,123 (100% urban, 0% rural). Population change since 2000: +1.7%Males: 457 Females: 666
December 2024 cost of living index in Milford: 116.8 (more than average, U.S. average is 100) Percentage of residents living in poverty in 2023: 9.3%for White Non-Hispanic residents , 19.3% for Hispanic or Latino residents , 4.3% for other race residents , 7.6% for two or more races residents )
Profiles of local businesses
Business Search - 14 Million verified businesses
Data:
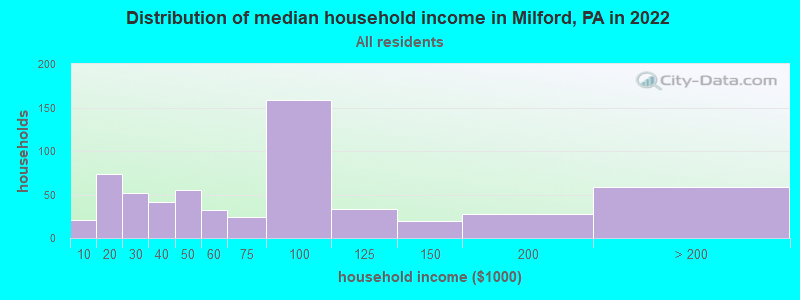
Median household income ($)
Median household income (% change since 2000)
Household income diversity
Ratio of average income to average house value (%)
Ratio of average income to average rent
Median household income ($) - White
Median household income ($) - Black or African American
Median household income ($) - Asian
Median household income ($) - Hispanic or Latino
Median household income ($) - American Indian and Alaska Native
Median household income ($) - Multirace
Median household income ($) - Other Race
Median household income for houses/condos with a mortgage ($)
Median household income for apartments without a mortgage ($)
Races - White alone (%)
Races - White alone (% change since 2000)
Races - Black alone (%)
Races - Black alone (% change since 2000)
Races - American Indian alone (%)
Races - American Indian alone (% change since 2000)
Races - Asian alone (%)
Races - Asian alone (% change since 2000)
Races - Hispanic (%)
Races - Hispanic (% change since 2000)
Races - Native Hawaiian and Other Pacific Islander alone (%)
Races - Native Hawaiian and Other Pacific Islander alone (% change since 2000)
Races - Two or more races (%)
Races - Two or more races (% change since 2000)
Races - Other race alone (%)
Races - Other race alone (% change since 2000)
Racial diversity
Unemployment (%)
Unemployment (% change since 2000)
Unemployment (%) - White
Unemployment (%) - Black or African American
Unemployment (%) - Asian
Unemployment (%) - Hispanic or Latino
Unemployment (%) - American Indian and Alaska Native
Unemployment (%) - Multirace
Unemployment (%) - Other Race
Population density (people per square mile)
Population - Males (%)
Population - Females (%)
Population - Males (%) - White
Population - Males (%) - Black or African American
Population - Males (%) - Asian
Population - Males (%) - Hispanic or Latino
Population - Males (%) - American Indian and Alaska Native
Population - Males (%) - Multirace
Population - Males (%) - Other Race
Population - Females (%) - White
Population - Females (%) - Black or African American
Population - Females (%) - Asian
Population - Females (%) - Hispanic or Latino
Population - Females (%) - American Indian and Alaska Native
Population - Females (%) - Multirace
Population - Females (%) - Other Race
Coronavirus confirmed cases (May 09, 2025)
Deaths caused by coronavirus (May 09, 2025)
Coronavirus confirmed cases (per 100k population) (May 09, 2025)
Deaths caused by coronavirus (per 100k population) (May 09, 2025)
Daily increase in number of cases (May 09, 2025)
Weekly increase in number of cases (May 09, 2025)
Cases doubled (in days) (May 09, 2025)
Hospitalized patients (Apr 18, 2022)
Negative test results (Apr 18, 2022)
Total test results (Apr 18, 2022)
COVID Vaccine doses distributed (per 100k population) (Sep 19, 2023)
COVID Vaccine doses administered (per 100k population) (Sep 19, 2023)
COVID Vaccine doses distributed (Sep 19, 2023)
COVID Vaccine doses administered (Sep 19, 2023)
Likely homosexual households (%)
Likely homosexual households (% change since 2000)
Likely homosexual households - Lesbian couples (%)
Likely homosexual households - Lesbian couples (% change since 2000)
Likely homosexual households - Gay men (%)
Likely homosexual households - Gay men (% change since 2000)
Cost of living index
Median gross rent ($)
Median contract rent ($)
Median monthly housing costs ($)
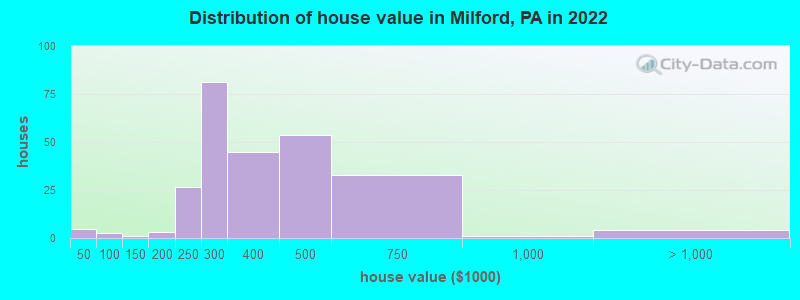
Median house or condo value ($)
Median house or condo value ($ change since 2000)
Mean house or condo value by units in structure - 1, detached ($)
Mean house or condo value by units in structure - 1, attached ($)
Mean house or condo value by units in structure - 2 ($)
Mean house or condo value by units in structure by units in structure - 3 or 4 ($)
Mean house or condo value by units in structure - 5 or more ($)
Mean house or condo value by units in structure - Boat, RV, van, etc. ($)
Mean house or condo value by units in structure - Mobile home ($)
Median house or condo value ($) - White
Median house or condo value ($) - Black or African American
Median house or condo value ($) - Asian
Median house or condo value ($) - Hispanic or Latino
Median house or condo value ($) - American Indian and Alaska Native
Median house or condo value ($) - Multirace
Median house or condo value ($) - Other Race
Median resident age
Resident age diversity
Median resident age - Males
Median resident age - Females
Median resident age - White
Median resident age - Black or African American
Median resident age - Asian
Median resident age - Hispanic or Latino
Median resident age - American Indian and Alaska Native
Median resident age - Multirace
Median resident age - Other Race
Median resident age - Males - White
Median resident age - Males - Black or African American
Median resident age - Males - Asian
Median resident age - Males - Hispanic or Latino
Median resident age - Males - American Indian and Alaska Native
Median resident age - Males - Multirace
Median resident age - Males - Other Race
Median resident age - Females - White
Median resident age - Females - Black or African American
Median resident age - Females - Asian
Median resident age - Females - Hispanic or Latino
Median resident age - Females - American Indian and Alaska Native
Median resident age - Females - Multirace
Median resident age - Females - Other Race
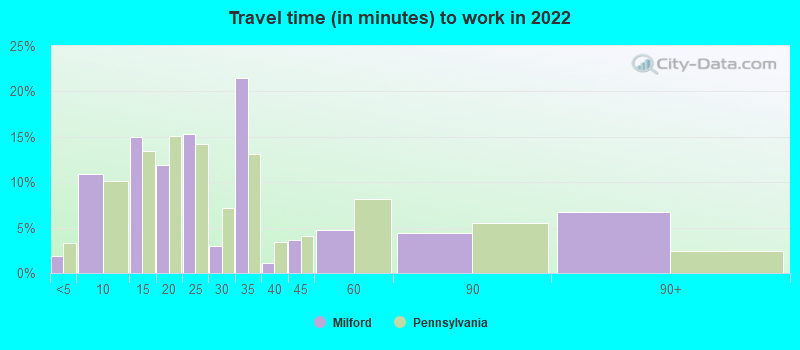
Commute - mean travel time to work (minutes)
Travel time to work - Less than 5 minutes (%)
Travel time to work - Less than 5 minutes (% change since 2000)
Travel time to work - 5 to 9 minutes (%)
Travel time to work - 5 to 9 minutes (% change since 2000)
Travel time to work - 10 to 19 minutes (%)
Travel time to work - 10 to 19 minutes (% change since 2000)
Travel time to work - 20 to 29 minutes (%)
Travel time to work - 20 to 29 minutes (% change since 2000)
Travel time to work - 30 to 39 minutes (%)
Travel time to work - 30 to 39 minutes (% change since 2000)
Travel time to work - 40 to 59 minutes (%)
Travel time to work - 40 to 59 minutes (% change since 2000)
Travel time to work - 60 to 89 minutes (%)
Travel time to work - 60 to 89 minutes (% change since 2000)
Travel time to work - 90 or more minutes (%)
Travel time to work - 90 or more minutes (% change since 2000)
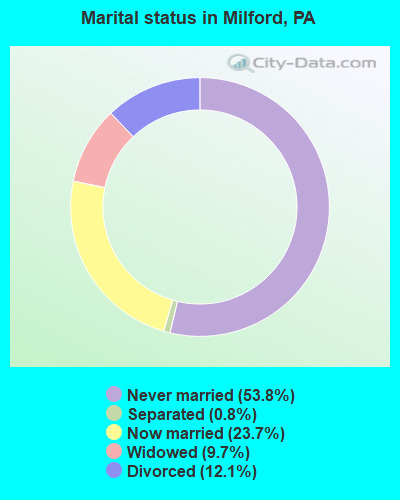
Marital status - Never married (%)
Marital status - Now married (%)
Marital status - Separated (%)
Marital status - Widowed (%)
Marital status - Divorced (%)
Median family income ($)
Median family income (% change since 2000)
Median non-family income ($)
Median non-family income (% change since 2000)
Median per capita income ($)
Median per capita income (% change since 2000)
Median family income ($) - White
Median family income ($) - Black or African American
Median family income ($) - Asian
Median family income ($) - Hispanic or Latino
Median family income ($) - American Indian and Alaska Native
Median family income ($) - Multirace
Median family income ($) - Other Race
Median year house/condo built
Median year apartment built
Year house built - Built 2005 or later (%)
Year house built - Built 2000 to 2004 (%)
Year house built - Built 1990 to 1999 (%)
Year house built - Built 1980 to 1989 (%)
Year house built - Built 1970 to 1979 (%)
Year house built - Built 1960 to 1969 (%)
Year house built - Built 1950 to 1959 (%)
Year house built - Built 1940 to 1949 (%)
Year house built - Built 1939 or earlier (%)
Average household size
Household density (households per square mile)
Average household size - White
Average household size - Black or African American
Average household size - Asian
Average household size - Hispanic or Latino
Average household size - American Indian and Alaska Native
Average household size - Multirace
Average household size - Other Race
Occupied housing units (%)
Vacant housing units (%)
Owner occupied housing units (%)
Renter occupied housing units (%)
Vacancy status - For rent (%)
Vacancy status - For sale only (%)
Vacancy status - Rented or sold, not occupied (%)
Vacancy status - For seasonal, recreational, or occasional use (%)
Vacancy status - For migrant workers (%)
Vacancy status - Other vacant (%)
Residents with income below the poverty level (%)
Residents with income below 50% of the poverty level (%)
Children below poverty level (%)
Poor families by family type - Married-couple family (%)
Poor families by family type - Male, no wife present (%)
Poor families by family type - Female, no husband present (%)
Poverty status for native-born residents (%)
Poverty status for foreign-born residents (%)
Poverty among high school graduates not in families (%)
Poverty among people who did not graduate high school not in families (%)
Residents with income below the poverty level (%) - White
Residents with income below the poverty level (%) - Black or African American
Residents with income below the poverty level (%) - Asian
Residents with income below the poverty level (%) - Hispanic or Latino
Residents with income below the poverty level (%) - American Indian and Alaska Native
Residents with income below the poverty level (%) - Multirace
Residents with income below the poverty level (%) - Other Race
Air pollution - Air Quality Index (AQI)
Air pollution - CO
Air pollution - NO2
Air pollution - SO2
Air pollution - Ozone
Air pollution - PM10
Air pollution - PM25
Air pollution - Pb
Crime - Murders per 100,000 population
Crime - Rapes per 100,000 population
Crime - Robberies per 100,000 population
Crime - Assaults per 100,000 population
Crime - Burglaries per 100,000 population
Crime - Thefts per 100,000 population
Crime - Auto thefts per 100,000 population
Crime - Arson per 100,000 population
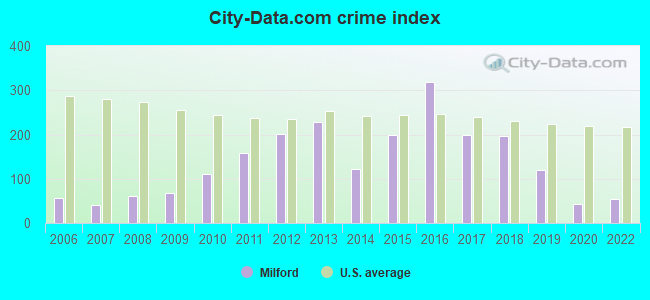
Crime - City-data.com crime index
Crime - Violent crime index
Crime - Property crime index
Crime - Murders per 100,000 population (5 year average)
Crime - Rapes per 100,000 population (5 year average)
Crime - Robberies per 100,000 population (5 year average)
Crime - Assaults per 100,000 population (5 year average)
Crime - Burglaries per 100,000 population (5 year average)
Crime - Thefts per 100,000 population (5 year average)
Crime - Auto thefts per 100,000 population (5 year average)
Crime - Arson per 100,000 population (5 year average)
Crime - City-data.com crime index (5 year average)
Crime - Violent crime index (5 year average)
Crime - Property crime index (5 year average)
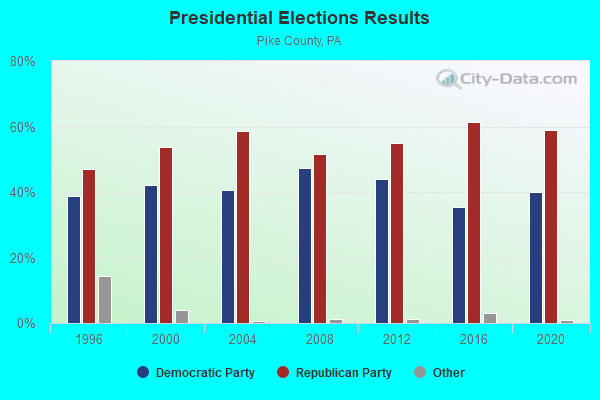
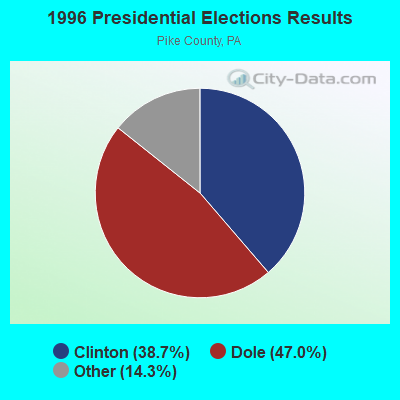
1996 Presidential Elections Results (%) - Democratic Party (Clinton)
1996 Presidential Elections Results (%) - Republican Party (Dole)
1996 Presidential Elections Results (%) - Other
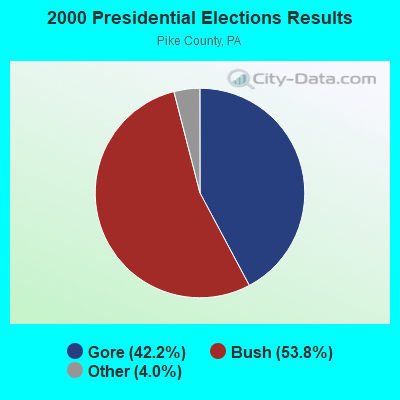
2000 Presidential Elections Results (%) - Democratic Party (Gore)
2000 Presidential Elections Results (%) - Republican Party (Bush)
2000 Presidential Elections Results (%) - Other
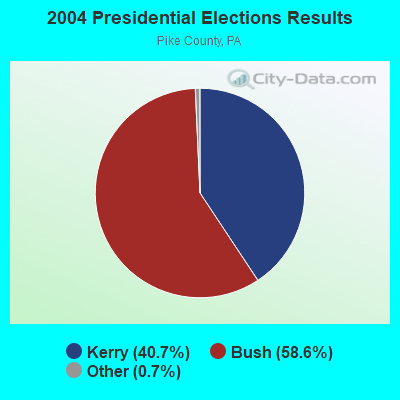
2004 Presidential Elections Results (%) - Democratic Party (Kerry)
2004 Presidential Elections Results (%) - Republican Party (Bush)
2004 Presidential Elections Results (%) - Other
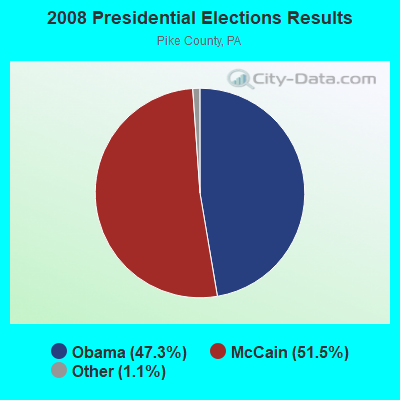
2008 Presidential Elections Results (%) - Democratic Party (Obama)
2008 Presidential Elections Results (%) - Republican Party (McCain)
2008 Presidential Elections Results (%) - Other
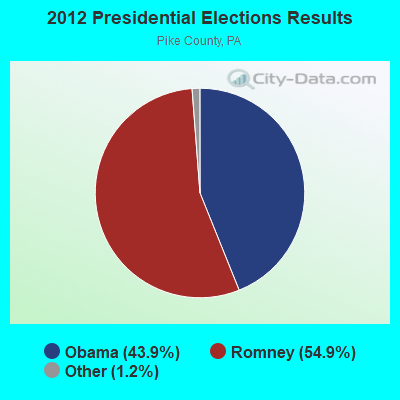
2012 Presidential Elections Results (%) - Democratic Party (Obama)
2012 Presidential Elections Results (%) - Republican Party (Romney)
2012 Presidential Elections Results (%) - Other
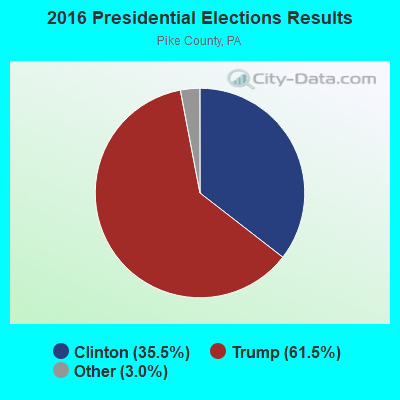
2016 Presidential Elections Results (%) - Democratic Party (Clinton)
2016 Presidential Elections Results (%) - Republican Party (Trump)
2016 Presidential Elections Results (%) - Other
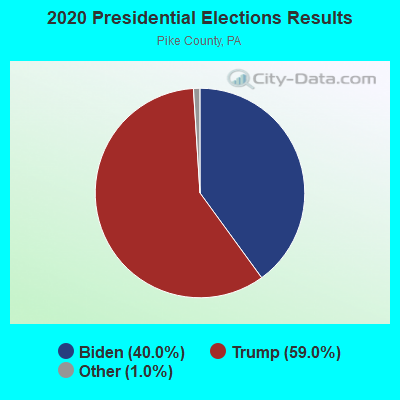
2020 Presidential Elections Results (%) - Democratic Party (Biden)
2020 Presidential Elections Results (%) - Republican Party (Trump)
2020 Presidential Elections Results (%) - Other
Ancestries Reported - Arab (%)
Ancestries Reported - Czech (%)
Ancestries Reported - Danish (%)
Ancestries Reported - Dutch (%)
Ancestries Reported - English (%)
Ancestries Reported - French (%)
Ancestries Reported - French Canadian (%)
Ancestries Reported - German (%)
Ancestries Reported - Greek (%)
Ancestries Reported - Hungarian (%)
Ancestries Reported - Irish (%)
Ancestries Reported - Italian (%)
Ancestries Reported - Lithuanian (%)
Ancestries Reported - Norwegian (%)
Ancestries Reported - Polish (%)
Ancestries Reported - Portuguese (%)
Ancestries Reported - Russian (%)
Ancestries Reported - Scotch-Irish (%)
Ancestries Reported - Scottish (%)
Ancestries Reported - Slovak (%)
Ancestries Reported - Subsaharan African (%)
Ancestries Reported - Swedish (%)
Ancestries Reported - Swiss (%)
Ancestries Reported - Ukrainian (%)
Ancestries Reported - United States (%)
Ancestries Reported - Welsh (%)
Ancestries Reported - West Indian (%)
Ancestries Reported - Other (%)
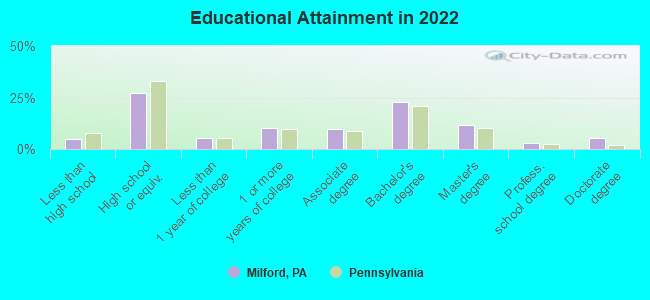
Educational Attainment - No schooling completed (%)
Educational Attainment - Less than high school (%)
Educational Attainment - High school or equivalent (%)
Educational Attainment - Less than 1 year of college (%)
Educational Attainment - 1 or more years of college (%)
Educational Attainment - Associate degree (%)
Educational Attainment - Bachelor's degree (%)
Educational Attainment - Master's degree (%)
Educational Attainment - Professional school degree (%)
Educational Attainment - Doctorate degree (%)
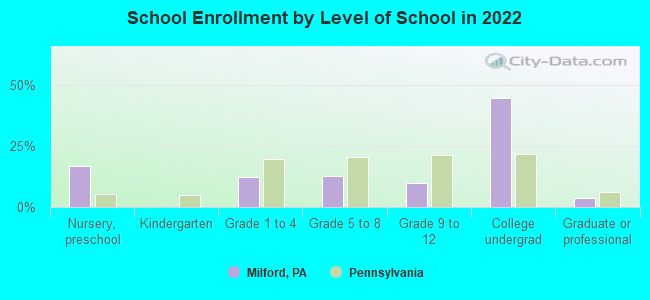
School Enrollment - Nursery, preschool (%)
School Enrollment - Kindergarten (%)
School Enrollment - Grade 1 to 4 (%)
School Enrollment - Grade 5 to 8 (%)
School Enrollment - Grade 9 to 12 (%)
School Enrollment - College undergrad (%)
School Enrollment - Graduate or professional (%)
School Enrollment - Not enrolled in school (%)
School enrollment - Public schools (%)
School enrollment - Private schools (%)
School enrollment - Not enrolled (%)
Median number of rooms in houses and condos
Median number of rooms in apartments
Housing units lacking complete plumbing facilities (%)
Housing units lacking complete kitchen facilities (%)
Density of houses
Urban houses (%)
Rural houses (%)
Households with people 60 years and over (%)
Households with people 65 years and over (%)
Households with people 75 years and over (%)
Households with one or more nonrelatives (%)
Households with no nonrelatives (%)
Population in households (%)
Family households (%)
Nonfamily households (%)
Population in families (%)
Family households with own children (%)
Median number of bedrooms in owner occupied houses
Mean number of bedrooms in owner occupied houses
Median number of bedrooms in renter occupied houses
Mean number of bedrooms in renter occupied houses
Median number of vehichles in owner occupied houses
Mean number of vehichles in owner occupied houses
Median number of vehichles in renter occupied houses
Mean number of vehichles in renter occupied houses
Mortgage status - with mortgage (%)
Mortgage status - with second mortgage (%)
Mortgage status - with home equity loan (%)
Mortgage status - with both second mortgage and home equity loan (%)
Mortgage status - without a mortgage (%)
Average family size
Average family size - White
Average family size - Black or African American
Average family size - Asian
Average family size - Hispanic or Latino
Average family size - American Indian and Alaska Native
Average family size - Multirace
Average family size - Other Race
Geographical mobility - Same house 1 year ago (%)
Geographical mobility - Moved within same county (%)
Geographical mobility - Moved from different county within same state (%)
Geographical mobility - Moved from different state (%)
Geographical mobility - Moved from abroad (%)
Place of birth - Born in state of residence (%)
Place of birth - Born in other state (%)
Place of birth - Native, outside of US (%)
Place of birth - Foreign born (%)
Housing units in structures - 1, detached (%)
Housing units in structures - 1, attached (%)
Housing units in structures - 2 (%)
Housing units in structures - 3 or 4 (%)
Housing units in structures - 5 to 9 (%)
Housing units in structures - 10 to 19 (%)
Housing units in structures - 20 to 49 (%)
Housing units in structures - 50 or more (%)
Housing units in structures - Mobile home (%)
Housing units in structures - Boat, RV, van, etc. (%)
House/condo owner moved in on average (years ago)
Renter moved in on average (years ago)
Year householder moved into unit - Moved in 1999 to March 2000 (%)
Year householder moved into unit - Moved in 1995 to 1998 (%)
Year householder moved into unit - Moved in 1990 to 1994 (%)
Year householder moved into unit - Moved in 1980 to 1989 (%)
Year householder moved into unit - Moved in 1970 to 1979 (%)
Year householder moved into unit - Moved in 1969 or earlier (%)
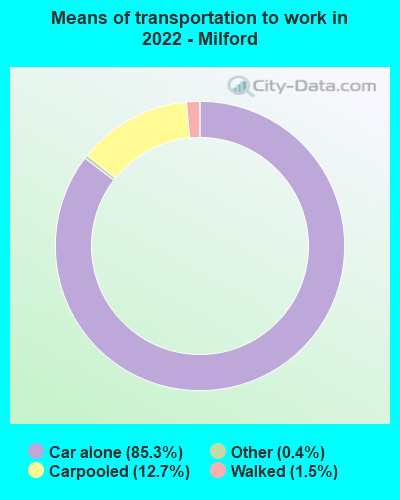
Means of transportation to work - Drove car alone (%)
Means of transportation to work - Carpooled (%)
Means of transportation to work - Public transportation (%)
Means of transportation to work - Bus or trolley bus (%)
Means of transportation to work - Streetcar or trolley car (%)
Means of transportation to work - Subway or elevated (%)
Means of transportation to work - Railroad (%)
Means of transportation to work - Ferryboat (%)
Means of transportation to work - Taxicab (%)
Means of transportation to work - Motorcycle (%)
Means of transportation to work - Bicycle (%)
Means of transportation to work - Walked (%)
Means of transportation to work - Other means (%)
Working at home (%)
Industry diversity
Most Common Industries - Agriculture, forestry, fishing and hunting, and mining (%)
Most Common Industries - Agriculture, forestry, fishing and hunting (%)
Most Common Industries - Mining, quarrying, and oil and gas extraction (%)
Most Common Industries - Construction (%)
Most Common Industries - Manufacturing (%)
Most Common Industries - Wholesale trade (%)
Most Common Industries - Retail trade (%)
Most Common Industries - Transportation and warehousing, and utilities (%)
Most Common Industries - Transportation and warehousing (%)
Most Common Industries - Utilities (%)
Most Common Industries - Information (%)
Most Common Industries - Finance and insurance, and real estate and rental and leasing (%)
Most Common Industries - Finance and insurance (%)
Most Common Industries - Real estate and rental and leasing (%)
Most Common Industries - Professional, scientific, and management, and administrative and waste management services (%)
Most Common Industries - Professional, scientific, and technical services (%)
Most Common Industries - Management of companies and enterprises (%)
Most Common Industries - Administrative and support and waste management services (%)
Most Common Industries - Educational services, and health care and social assistance (%)
Most Common Industries - Educational services (%)
Most Common Industries - Health care and social assistance (%)
Most Common Industries - Arts, entertainment, and recreation, and accommodation and food services (%)
Most Common Industries - Arts, entertainment, and recreation (%)
Most Common Industries - Accommodation and food services (%)
Most Common Industries - Other services, except public administration (%)
Most Common Industries - Public administration (%)
Occupation diversity
Most Common Occupations - Management, business, science, and arts occupations (%)
Most Common Occupations - Management, business, and financial occupations (%)
Most Common Occupations - Management occupations (%)
Most Common Occupations - Business and financial operations occupations (%)
Most Common Occupations - Computer, engineering, and science occupations (%)
Most Common Occupations - Computer and mathematical occupations (%)
Most Common Occupations - Architecture and engineering occupations (%)
Most Common Occupations - Life, physical, and social science occupations (%)
Most Common Occupations - Education, legal, community service, arts, and media occupations (%)
Most Common Occupations - Community and social service occupations (%)
Most Common Occupations - Legal occupations (%)
Most Common Occupations - Education, training, and library occupations (%)
Most Common Occupations - Arts, design, entertainment, sports, and media occupations (%)
Most Common Occupations - Healthcare practitioners and technical occupations (%)
Most Common Occupations - Health diagnosing and treating practitioners and other technical occupations (%)
Most Common Occupations - Health technologists and technicians (%)
Most Common Occupations - Service occupations (%)
Most Common Occupations - Healthcare support occupations (%)
Most Common Occupations - Protective service occupations (%)
Most Common Occupations - Fire fighting and prevention, and other protective service workers including supervisors (%)
Most Common Occupations - Law enforcement workers including supervisors (%)
Most Common Occupations - Food preparation and serving related occupations (%)
Most Common Occupations - Building and grounds cleaning and maintenance occupations (%)
Most Common Occupations - Personal care and service occupations (%)
Most Common Occupations - Sales and office occupations (%)
Most Common Occupations - Sales and related occupations (%)
Most Common Occupations - Office and administrative support occupations (%)
Most Common Occupations - Natural resources, construction, and maintenance occupations (%)
Most Common Occupations - Farming, fishing, and forestry occupations (%)
Most Common Occupations - Construction and extraction occupations (%)
Most Common Occupations - Installation, maintenance, and repair occupations (%)
Most Common Occupations - Production, transportation, and material moving occupations (%)
Most Common Occupations - Production occupations (%)
Most Common Occupations - Transportation occupations (%)
Most Common Occupations - Material moving occupations (%)
People in Group quarters - Institutionalized population (%)
People in Group quarters - Correctional institutions (%)
People in Group quarters - Federal prisons and detention centers (%)
People in Group quarters - Halfway houses (%)
People in Group quarters - Local jails and other confinement facilities (including police lockups) (%)
People in Group quarters - Military disciplinary barracks (%)
People in Group quarters - State prisons (%)
People in Group quarters - Other types of correctional institutions (%)
People in Group quarters - Nursing homes (%)
People in Group quarters - Hospitals/wards, hospices, and schools for the handicapped (%)
People in Group quarters - Hospitals/wards and hospices for chronically ill (%)
People in Group quarters - Hospices or homes for chronically ill (%)
People in Group quarters - Military hospitals or wards for chronically ill (%)
People in Group quarters - Other hospitals or wards for chronically ill (%)
People in Group quarters - Hospitals or wards for drug/alcohol abuse (%)
People in Group quarters - Mental (Psychiatric) hospitals or wards (%)
People in Group quarters - Schools, hospitals, or wards for the mentally retarded (%)
People in Group quarters - Schools, hospitals, or wards for the physically handicapped (%)
People in Group quarters - Institutions for the deaf (%)
People in Group quarters - Institutions for the blind (%)
People in Group quarters - Orthopedic wards and institutions for the physically handicapped (%)
People in Group quarters - Wards in general hospitals for patients who have no usual home elsewhere (%)
People in Group quarters - Wards in military hospitals for patients who have no usual home elsewhere (%)
People in Group quarters - Juvenile institutions (%)
People in Group quarters - Long-term care (%)
People in Group quarters - Homes for abused, dependent, and neglected children (%)
People in Group quarters - Residential treatment centers for emotionally disturbed children (%)
People in Group quarters - Training schools for juvenile delinquents (%)
People in Group quarters - Short-term care, detention or diagnostic centers for delinquent children (%)
People in Group quarters - Type of juvenile institution unknown (%)
People in Group quarters - Noninstitutionalized population (%)
People in Group quarters - College dormitories (includes college quarters off campus) (%)
People in Group quarters - Military quarters (%)
People in Group quarters - On base (%)
People in Group quarters - Barracks, unaccompanied personnel housing (UPH), (Enlisted/Officer), ;and similar group living quarters for military personnel (%)
People in Group quarters - Transient quarters for temporary residents (%)
People in Group quarters - Military ships (%)
People in Group quarters - Group homes (%)
People in Group quarters - Homes or halfway houses for drug/alcohol abuse (%)
People in Group quarters - Homes for the mentally ill (%)
People in Group quarters - Homes for the mentally retarded (%)
People in Group quarters - Homes for the physically handicapped (%)
People in Group quarters - Other group homes (%)
People in Group quarters - Religious group quarters (%)
People in Group quarters - Dormitories (%)
People in Group quarters - Agriculture workers' dormitories on farms (%)
People in Group quarters - Job Corps and vocational training facilities (%)
People in Group quarters - Other workers' dormitories (%)
People in Group quarters - Crews of maritime vessels (%)
People in Group quarters - Other nonhousehold living situations (%)
People in Group quarters - Other noninstitutional group quarters (%)
Residents speaking English at home (%)
Residents speaking English at home - Born in the United States (%)
Residents speaking English at home - Native, born elsewhere (%)
Residents speaking English at home - Foreign born (%)
Residents speaking Spanish at home (%)
Residents speaking Spanish at home - Born in the United States (%)
Residents speaking Spanish at home - Native, born elsewhere (%)
Residents speaking Spanish at home - Foreign born (%)
Residents speaking other language at home (%)
Residents speaking other language at home - Born in the United States (%)
Residents speaking other language at home - Native, born elsewhere (%)
Residents speaking other language at home - Foreign born (%)
Class of Workers - Employee of private company (%)
Class of Workers - Self-employed in own incorporated business (%)
Class of Workers - Private not-for-profit wage and salary workers (%)
Class of Workers - Local government workers (%)
Class of Workers - State government workers (%)
Class of Workers - Federal government workers (%)
Class of Workers - Self-employed workers in own not incorporated business and Unpaid family workers (%)
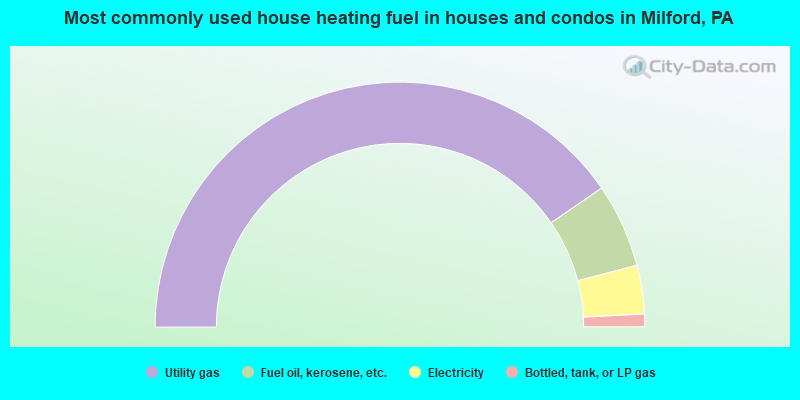
House heating fuel used in houses and condos - Utility gas (%)
House heating fuel used in houses and condos - Bottled, tank, or LP gas (%)
House heating fuel used in houses and condos - Electricity (%)
House heating fuel used in houses and condos - Fuel oil, kerosene, etc. (%)
House heating fuel used in houses and condos - Coal or coke (%)
House heating fuel used in houses and condos - Wood (%)
House heating fuel used in houses and condos - Solar energy (%)
House heating fuel used in houses and condos - Other fuel (%)
House heating fuel used in houses and condos - No fuel used (%)
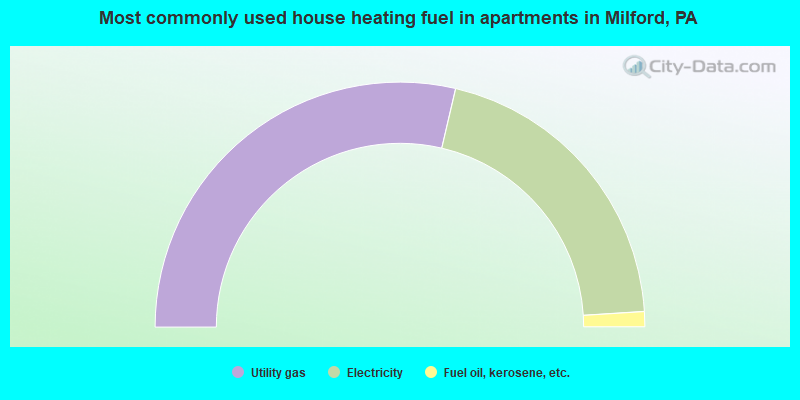
House heating fuel used in apartments - Utility gas (%)
House heating fuel used in apartments - Bottled, tank, or LP gas (%)
House heating fuel used in apartments - Electricity (%)
House heating fuel used in apartments - Fuel oil, kerosene, etc. (%)
House heating fuel used in apartments - Coal or coke (%)
House heating fuel used in apartments - Wood (%)
House heating fuel used in apartments - Solar energy (%)
House heating fuel used in apartments - Other fuel (%)
House heating fuel used in apartments - No fuel used (%)
Armed forces status - In Armed Forces (%)
Armed forces status - Civilian (%)
Armed forces status - Civilian - Veteran (%)
Armed forces status - Civilian - Nonveteran (%)
Read more: https://www.city-data.com/accidents/acc-Addison-Illinois.html
Fatal accidents locations in years 2005-2022
Fatal accidents locations in 2022
Fatal accidents locations in 2021
Fatal accidents locations in 2020
Fatal accidents locations in 2019
Fatal accidents locations in 2018
Fatal accidents locations in 2017
Fatal accidents locations in 2016
Fatal accidents locations in 2015
Fatal accidents locations in 2014
Fatal accidents locations in 2013
Fatal accidents locations in 2012
Fatal accidents locations in 2011
Fatal accidents locations in 2010
Fatal accidents locations in 2009
Fatal accidents locations in 2008
Fatal accidents locations in 2007
Fatal accidents locations in 2006
Fatal accidents locations in 2005
Alcohol use - People drinking some alcohol every month (%)
Alcohol use - People not drinking at all (%)
Alcohol use - Average days/month drinking alcohol
Alcohol use - Average drinks/week
Alcohol use - Average days/year people drink much
Audiometry - Average condition of hearing (%)
Audiometry - People that can hear a whisper from across a quiet room (%)
Audiometry - People that can hear normal voice from across a quiet room (%)
Audiometry - Ears ringing, roaring, buzzing (%)
Audiometry - Had a job exposure to loud noise (%)
Audiometry - Had off-work exposure to loud noise (%)
Blood Pressure & Cholesterol - Has high blood pressure (%)
Blood Pressure & Cholesterol - Checking blood pressure at home (%)
Blood Pressure & Cholesterol - Frequently checking blood cholesterol (%)
Blood Pressure & Cholesterol - Has high cholesterol level (%)
Consumer Behavior - Money monthly spent on food at supermarket/grocery store
Consumer Behavior - Money monthly spent on food at other stores
Consumer Behavior - Money monthly spent on eating out
Consumer Behavior - Money monthly spent on carryout/delivered foods
Consumer Behavior - Income spent on food at supermarket/grocery store (%)
Consumer Behavior - Income spent on food at other stores (%)
Consumer Behavior - Income spent on eating out (%)
Consumer Behavior - Income spent on carryout/delivered foods (%)
Current Health Status - General health condition (%)
Current Health Status - Blood donors (%)
Current Health Status - Has blood ever tested for HIV virus (%)
Current Health Status - Left-handed people (%)
Dermatology - People using sunscreen (%)
Diabetes - Diabetics (%)
Diabetes - Had a blood test for high blood sugar (%)
Diabetes - People taking insulin (%)
Diet Behavior & Nutrition - Diet health (%)
Diet Behavior & Nutrition - Milk product consumption (# of products/month)
Diet Behavior & Nutrition - Meals not home prepared (#/week)
Diet Behavior & Nutrition - Meals from fast food or pizza place (#/week)
Diet Behavior & Nutrition - Ready-to-eat foods (#/month)
Diet Behavior & Nutrition - Frozen meals/pizza (#/month)
Drug Use - People that ever used marijuana or hashish (%)
Drug Use - Ever used hard drugs (%)
Drug Use - Ever used any form of cocaine (%)
Drug Use - Ever used heroin (%)
Drug Use - Ever used methamphetamine (%)
Health Insurance - People covered by health insurance (%)
Kidney Conditions-Urology - Avg. # of times urinating at night
Medical Conditions - People with asthma (%)
Medical Conditions - People with anemia (%)
Medical Conditions - People with psoriasis (%)
Medical Conditions - People with overweight (%)
Medical Conditions - Elderly people having difficulties in thinking or remembering (%)
Medical Conditions - People who ever received blood transfusion (%)
Medical Conditions - People having trouble seeing even with glass/contacts (%)
Medical Conditions - People with arthritis (%)
Medical Conditions - People with gout (%)
Medical Conditions - People with congestive heart failure (%)
Medical Conditions - People with coronary heart disease (%)
Medical Conditions - People with angina pectoris (%)
Medical Conditions - People who ever had heart attack (%)
Medical Conditions - People who ever had stroke (%)
Medical Conditions - People with emphysema (%)
Medical Conditions - People with thyroid problem (%)
Medical Conditions - People with chronic bronchitis (%)
Medical Conditions - People with any liver condition (%)
Medical Conditions - People who ever had cancer or malignancy (%)
Mental Health - People who have little interest in doing things (%)
Mental Health - People feeling down, depressed, or hopeless (%)
Mental Health - People who have trouble sleeping or sleeping too much (%)
Mental Health - People feeling tired or having little energy (%)
Mental Health - People with poor appetite or overeating (%)
Mental Health - People feeling bad about themself (%)
Mental Health - People who have trouble concentrating on things (%)
Mental Health - People moving or speaking slowly or too fast (%)
Mental Health - People having thoughts they would be better off dead (%)
Oral Health - Average years since last visit a dentist
Oral Health - People embarrassed because of mouth (%)
Oral Health - People with gum disease (%)
Oral Health - General health of teeth and gums (%)
Oral Health - Average days a week using dental floss/device
Oral Health - Average days a week using mouthwash for dental problem
Oral Health - Average number of teeth
Pesticide Use - Households using pesticides to control insects (%)
Pesticide Use - Households using pesticides to kill weeds (%)
Physical Activity - People doing vigorous-intensity work activities (%)
Physical Activity - People doing moderate-intensity work activities (%)
Physical Activity - People walking or bicycling (%)
Physical Activity - People doing vigorous-intensity recreational activities (%)
Physical Activity - People doing moderate-intensity recreational activities (%)
Physical Activity - Average hours a day doing sedentary activities
Physical Activity - Average hours a day watching TV or videos
Physical Activity - Average hours a day using computer
Physical Functioning - People having limitations keeping them from working (%)
Physical Functioning - People limited in amount of work they can do (%)
Physical Functioning - People that need special equipment to walk (%)
Physical Functioning - People experiencing confusion/memory problems (%)
Physical Functioning - People requiring special healthcare equipment (%)
Prescription Medications - Average number of prescription medicines taking
Preventive Aspirin Use - Adults 40+ taking low-dose aspirin (%)
Reproductive Health - Vaginal deliveries (%)
Reproductive Health - Cesarean deliveries (%)
Reproductive Health - Deliveries resulted in a live birth (%)
Reproductive Health - Pregnancies resulted in a delivery (%)
Reproductive Health - Women breastfeeding newborns (%)
Reproductive Health - Women that had a hysterectomy (%)
Reproductive Health - Women that had both ovaries removed (%)
Reproductive Health - Women that have ever taken birth control pills (%)
Reproductive Health - Women taking birth control pills (%)
Reproductive Health - Women that have ever used Depo-Provera or injectables (%)
Reproductive Health - Women that have ever used female hormones (%)
Sexual Behavior - People 18+ that ever had sex (vaginal, anal, or oral) (%)
Sexual Behavior - Males 18+ that ever had vaginal sex with a woman (%)
Sexual Behavior - Males 18+ that ever performed oral sex on a woman (%)
Sexual Behavior - Males 18+ that ever had anal sex with a woman (%)
Sexual Behavior - Males 18+ that ever had any sex with a man (%)
Sexual Behavior - Females 18+ that ever had vaginal sex with a man (%)
Sexual Behavior - Females 18+ that ever performed oral sex on a man (%)
Sexual Behavior - Females 18+ that ever had anal sex with a man (%)
Sexual Behavior - Females 18+ that ever had any kind of sex with a woman (%)
Sexual Behavior - Average age people first had sex
Sexual Behavior - Average number of female sex partners in lifetime (males 18+)
Sexual Behavior - Average number of female vaginal sex partners in lifetime (males 18+)
Sexual Behavior - Average age people first performed oral sex on a woman (18+)
Sexual Behavior - Average number of woman performed oral sex on in lifetime (18+)
Sexual Behavior - Average number of male sex partners in lifetime (males 18+)
Sexual Behavior - Average number of male anal sex partners in lifetime (males 18+)
Sexual Behavior - Average age people first performed oral sex on a man (18+)
Sexual Behavior - Average number of male oral sex partners in lifetime (18+)
Sexual Behavior - People using protection when performing oral sex (%)
Sexual Behavior - Average number of times people have vaginal or anal sex a year
Sexual Behavior - People having sex without condom (%)
Sexual Behavior - Average number of male sex partners in lifetime (females 18+)
Sexual Behavior - Average number of male vaginal sex partners in lifetime (females 18+)
Sexual Behavior - Average number of female sex partners in lifetime (females 18+)
Sexual Behavior - Circumcised males 18+ (%)
Sleep Disorders - Average hours sleeping at night
Sleep Disorders - People that has trouble sleeping (%)
Smoking-Cigarette Use - People smoking cigarettes (%)
Taste & Smell - People 40+ having problems with smell (%)
Taste & Smell - People 40+ having problems with taste (%)
Taste & Smell - People 40+ that ever had wisdom teeth removed (%)
Taste & Smell - People 40+ that ever had tonsils teeth removed (%)
Taste & Smell - People 40+ that ever had a loss of consciousness because of a head injury (%)
Taste & Smell - People 40+ that ever had a broken nose or other serious injury to face or skull (%)
Taste & Smell - People 40+ that ever had two or more sinus infections (%)
Weight - Average height (inches)
Weight - Average weight (pounds)
Weight - Average BMI
Weight - People that are obese (%)
Weight - People that ever were obese (%)
Weight - People trying to lose weight (%)
Officers per 1,000 residents here:
2.65Pennsylvania average:
2.72
Latest news from Milford, PA collected exclusively by city-data.com from local newspapers, TV, and radio stations
Ancestries: Irish (20.9%), German (14.3%), English (12.0%), Italian (12.0%), Polish (6.1%), Russian (2.0%).
Current Local Time:
Incorporated on 12/25/1874
Land area: 0.48 square miles.
Population density: 2,358 people per square mile (low).
97 residents are foreign born (3.7% Latin America , 1.8% Europe ).
This borough:
7.6%Pennsylvania:
7.4%
Median real estate property taxes paid for housing units with mortgages in 2023: $5,821 (1.4%)Median real estate property taxes paid for housing units with no mortgage in 2023: $5,315 (1.5%)
Nearest city with pop. 50,000+: Wayne, NJ
Nearest city with pop. 200,000+: Newark, NJ
Nearest city with pop. 1,000,000+: Manhattan, NY
Nearest cities:
Latitude: 41.32 N, Longitude: 74.80 W
Milford tourist attractions:
Unemployment in November 2024: Here:
4.2%Pennsylvania:
3.3%
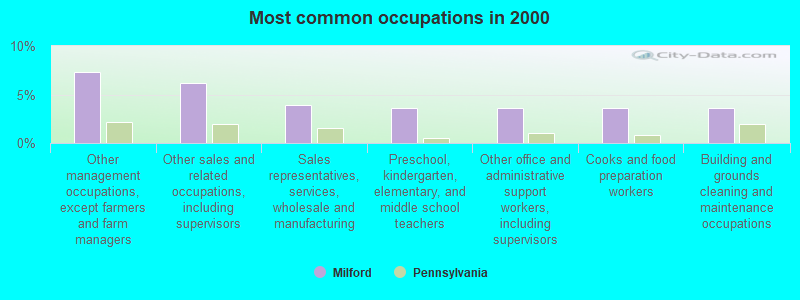
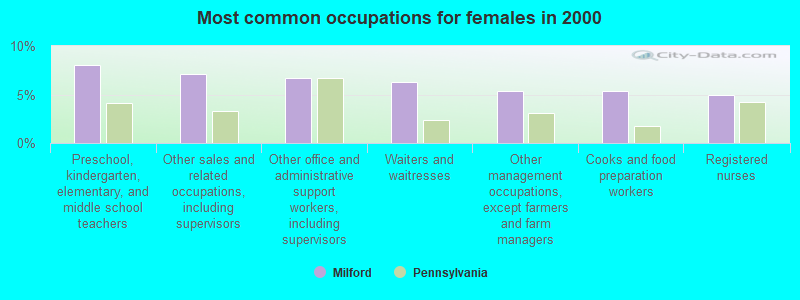
Most common occupations in Milford, PA (%)
Both Males Females
Other management occupations, except farmers and farm managers (7.3%)
Other sales and related occupations, including supervisors (6.2%)
Sales representatives, services, wholesale and manufacturing (4.0%)
Preschool, kindergarten, elementary, and middle school teachers (3.6%)
Other office and administrative support workers, including supervisors (3.6%)
Cooks and food preparation workers (3.6%)
Building and grounds cleaning and maintenance occupations (3.6%)
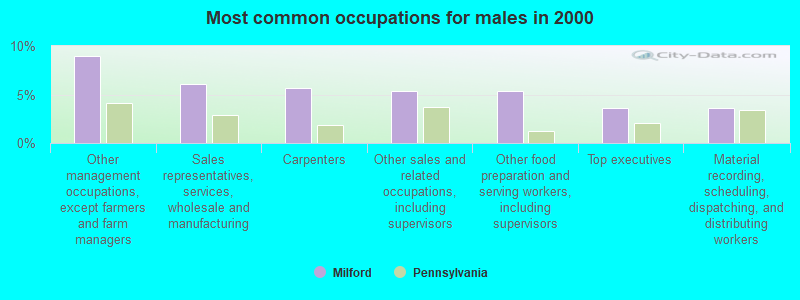
Other management occupations, except farmers and farm managers (8.9%)
Sales representatives, services, wholesale and manufacturing (6.1%)
Carpenters (5.7%)
Other sales and related occupations, including supervisors (5.4%)
Other food preparation and serving workers, including supervisors (5.4%)
Top executives (3.6%)
Material recording, scheduling, dispatching, and distributing workers (3.6%)
Preschool, kindergarten, elementary, and middle school teachers (8.0%)
Other sales and related occupations, including supervisors (7.1%)
Other office and administrative support workers, including supervisors (6.7%)
Waiters and waitresses (6.2%)
Other management occupations, except farmers and farm managers (5.4%)
Cooks and food preparation workers (5.4%)
Registered nurses (4.9%)
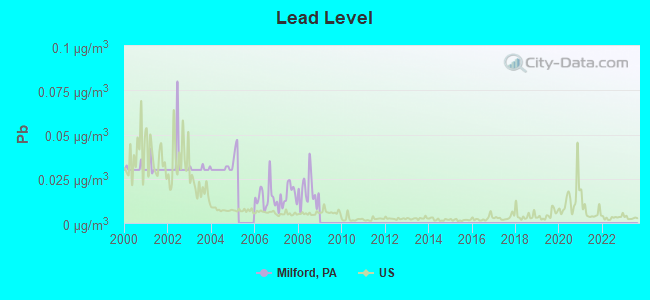
Air pollution and air quality trends(lower is better)
Pb
Lead (Pb) [µg/m3 ] level in 2008 was 0.0181. This is significantly worse than average. Closest monitor was 24.5 miles away from the city center.
Tornado activity:
Milford-area historical tornado activity is slightly below Pennsylvania state average. It is 35% smaller than the overall U.S. average.
On 5/31/1998, a category F3 (max. wind speeds 158-206 mph) tornado 7.4 miles away from the Milford borough center injured 2 people and caused $1 million in damages.
On 7/14/1988, a category F3 tornado 14.2 miles away from the borough center injured one person and caused between $500,000 and $5,000,000 in damages.
Earthquake activity:
Milford-area historical earthquake activity is significantly above Pennsylvania state average. It is 67% smaller than the overall U.S. average. On 10/7/1983 at 10:18:46, a magnitude 5.3 (5.1 MB, 5.3 LG, 5.1 ML, Class: Moderate, Intensity: VI - VII) earthquake occurred 183.3 miles away from the city center On 8/23/2011 at 17:51:04, a magnitude 5.8 (5.8 MW, Depth: 3.7 mi) earthquake occurred 289.2 miles away from Milford center On 4/20/2002 at 10:50:47, a magnitude 5.3 (5.3 ML, Depth: 3.0 mi) earthquake occurred 227.5 miles away from the city center On 1/16/1994 at 01:49:16, a magnitude 4.6 (4.6 MB, 4.6 LG, Depth: 3.1 mi, Class: Light, Intensity: IV - V) earthquake occurred 94.3 miles away from the city center On 4/20/2002 at 10:50:47, a magnitude 5.2 (5.2 MB, 4.2 MS, 5.2 MW, 5.0 MW) earthquake occurred 225.6 miles away from the city center On 1/16/1994 at 00:42:43, a magnitude 4.2 (4.2 MB, 4.0 LG, Depth: 3.1 mi) earthquake occurred 93.4 miles away from the city center Magnitude types: regional Lg-wave magnitude (LG), body-wave magnitude (MB), local magnitude (ML), surface-wave magnitude (MS), moment magnitude (MW) Natural disasters: The number of natural disasters in Pike County (17) is near the US average (19).Major Disasters (Presidential) Declared: 12Emergencies Declared: 4Floods: 5, Hurricanes: 5, Storms: 4, Blizzard: 1, Mudslide: 1, Snowfall: 1, Tornado: 1, Tropical Depression: 1, Tropical Storm: 1, Water Shortage: 1, Winter Storm: 1, Other: 2 (Note: some incidents may be assigned to more than one category). Hospitals and medical centers in Milford: BELLE REVE HEALTH CARE CENTER (404 EAST HARFORD STREET)
HEAD INJURY RECOVERY CTR AT HILLCREST (404 E HARFORD ST)
MILFORD SENIOR CARE AND REHAB (264 ROUTE 6 & 209)
DAVITA - DELAWARE VALLEY DIALYSIS CENTER (102 DAVITA DRIVE)
ALL ASPECTS HOME HEALTH AGENCY, LLC (109 9TH STREET)
IN HOME HEALTH SERVICES (111 EAST CATHARINE STREET SUITE 2400)
Airports located in Milford: Colleges/universities with over 2000 students nearest to Milford:
Sussex County Community College (about 18 miles; Newton, NJ ; Full-time enrollment: 2,402)
Orange County Community College (about 22 miles; Middletown, NY ; FT enrollment: 4,742)
East Stroudsburg University of Pennsylvania (about 30 miles; East Stroudsburg, PA ; FT enrollment: 6,195)
Centenary College (about 33 miles; Hackettstown, NJ ; FT enrollment: 2,271)
County College of Morris (about 35 miles; Randolph, NJ ; FT enrollment: 6,427)
Rockland Community College (about 40 miles; Suffern, NY ; FT enrollment: 6,026)
William Paterson University of New Jersey (about 41 miles; Wayne, NJ ; FT enrollment: 10,198)
Public high school in Milford:
Public elementary/middle schools in Milford:
See full list of schools located in Milford Library in Milford: PIKE COUNTY PUBLIC LIBRARY Operating income: $613,215; Location: 201 BROAD STREET; 64,017 books ; 3,481 audio materials ; 3,182 video materials ; 2 local licensed databases ; 41 state licensed databases ; 4 other licensed databases ; 105 print serial subscriptions )
User-submitted facts and corrections:
DV High School - 2,500 Students
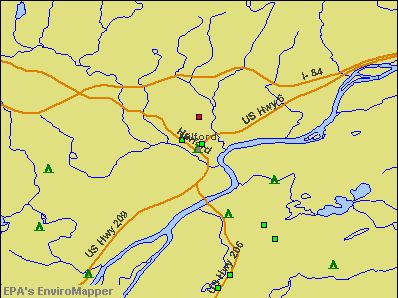
Notable location: (A) . Display/hide its location on the map
Streams, rivers, and creeks: (A) , Sawkill Creek (B) . Display/hide their locations on the map
Tourist attraction:
Hotel:
Court:
Birthplace of: Vanessa Carlton - Musician, Allyn Joslyn - Actor, Bill Steele - Baseball player, Charles Clarence Pratt - Politician.
Pike County has a predicted average indoor radon screening level between 2 and 4 pCi/L (pico curies per liter) - Moderate Potential Drinking water stations with addresses in Milford and their reported violations in the past:
KINGDOM HALL JEHOVAHS WITNESS (Population served: 250, Groundwater):
Past health violations:
MCL, Monthly (TCR) - Between JUL-2011 and SEP-2011, Contaminant: Coliform. Follow-up actions: St Public Notif requested (NOV-08-2011), St Public Notif received (NOV-08-2011), St Compliance achieved (NOV-08-2011), St Violation/Reminder Notice (NOV-08-2011)
Past monitoring violations:
Monitoring, Source Water (GWR) - Between SEP-26-2011 and OCT-26-2011, Contaminant: E. COLI. Follow-up actions: St Public Notif requested (NOV-08-2011), St Public Notif received (NOV-08-2011), St Compliance achieved (NOV-08-2011), St Violation/Reminder Notice (NOV-08-2011)
Population served: 125, Groundwater):
Past health violations:
MCL, Monthly (TCR) - Between OCT-2013 and DEC-2013, Contaminant: Coliform. Follow-up actions: St Public Notif requested (NOV-22-2013), St Public Notif received (NOV-22-2013), St Compliance achieved (NOV-22-2013), St Site Visit (enforcement) (NOV-22-2013)
MCL, Monthly (TCR) - In JUL-2013, Contaminant: Coliform. Follow-up actions: St Public Notif requested (SEP-20-2013), St Public Notif received (SEP-20-2013), St Compliance achieved (SEP-20-2013), St Violation/Reminder Notice (SEP-20-2013)
MCL, Monthly (TCR) - In JUN-2013, Contaminant: Coliform. Follow-up actions: St Public Notif requested (AUG-14-2013), St Public Notif received (AUG-14-2013), St Compliance achieved (AUG-14-2013), St Violation/Reminder Notice (AUG-14-2013)
MCL, Monthly (TCR) - In MAY-2013, Contaminant: Coliform. Follow-up actions: St Public Notif requested (JUL-09-2013), St Public Notif received (JUL-09-2013), St Compliance achieved (JUL-09-2013), St Violation/Reminder Notice (JUL-09-2013)
MCL, Monthly (TCR) - Between APR-2013 and JUN-2013, Contaminant: Coliform. Follow-up actions: St Public Notif requested (MAY-22-2013), St Public Notif received (MAY-22-2013), St Compliance achieved (MAY-22-2013), St Site Visit (enforcement) (MAY-22-2013), St Violation/Reminder Notice (MAY-22-2013)
MCL, Monthly (TCR) - Between JUL-2011 and SEP-2011, Contaminant: Coliform. Follow-up actions: St Site Visit (enforcement) (NOV-08-2011), St Public Notif requested (NOV-08-2011), St Public Notif received (NOV-08-2011), St Violation/Reminder Notice (NOV-08-2011), St Compliance achieved (NOV-08-2011)
3 other older health violations
Past monitoring violations:
Monitoring, Source Water (GWR) - Between JUN-08-2013 and JUL-08-2013, Contaminant: E. COLI. Follow-up actions: St Public Notif requested (AUG-14-2013), St Public Notif received (AUG-14-2013), St Compliance achieved (AUG-14-2013), St Violation/Reminder Notice (AUG-14-2013)
Monitoring, Source Water (GWR) - Between APR-10-2013 and MAY-10-2013, Contaminant: E. COLI. Follow-up actions: St Public Notif requested (MAY-22-2013), St Public Notif received (MAY-22-2013), St Compliance achieved (MAY-22-2013), St Site Visit (enforcement) (MAY-22-2013), St Violation/Reminder Notice (MAY-22-2013)
Monitoring, Source Water (GWR) - Between JAN-22-2011 and FEB-22-2011, Contaminant: E. COLI. Follow-up actions: St Site Visit (enforcement) (MAR-09-2011), St Public Notif requested (MAR-09-2011), St Public Notif received (MAR-09-2011), St Violation/Reminder Notice (MAR-09-2011), St Compliance achieved (MAR-09-2011)
Population served: 100, Groundwater):
Past monitoring violations:
One routine major monitoring violation
Population served: 80, Groundwater):
Past monitoring violations:
Monitoring of Treatment (SWTR-Unfilt/GWR) - In JAN-2014, Contaminant: GROUNDWATER RULE. Follow-up actions: St Violation/Reminder Notice (FEB-28-2014), St Compliance achieved (FEB-28-2014)
Monitoring of Treatment (SWTR-Unfilt/GWR) - In APR-2013, Contaminant: GROUNDWATER RULE. Follow-up actions: St Public Notif requested (MAY-23-2013), St Formal NOV issued (MAY-23-2013), St Compliance achieved (MAY-28-2013)
Population served: 75, Groundwater):
Past health violations:
MCL, Monthly (TCR) - In OCT-2006, Contaminant: Coliform. Follow-up actions: St Public Notif requested (DEC-07-2006), St Violation/Reminder Notice (DEC-07-2006), St Public Notif received (DEC-07-2006), St Site Visit (enforcement) (DEC-07-2006), St Compliance achieved (JAN-04-2007)
Population served: 75, Groundwater):
Past health violations:
MCL, Monthly (TCR) - Between APR-2010 and JUN-2010, Contaminant: Coliform. Follow-up actions: St Public Notif requested (MAY-20-2010), St Violation/Reminder Notice (MAY-20-2010), St Public Notif received (MAY-20-2010), St Compliance achieved (JUN-22-2010)
Population served: 75, Groundwater):
Past health violations:
MCL, Monthly (TCR) - Between JUL-2009 and SEP-2009, Contaminant: Coliform. Follow-up actions: St Public Notif requested (OCT-21-2009), St Violation/Reminder Notice (OCT-21-2009), St Public Notif received (OCT-21-2009), St Site Visit (enforcement) (OCT-21-2009), St Compliance achieved (OCT-30-2009)
MCL, Monthly (TCR) - In JUL-2007, Contaminant: Coliform. Follow-up actions: St Public Notif requested (AUG-22-2007), St Violation/Reminder Notice (AUG-22-2007), St Public Notif received (2 times from AUG-22-2007 to AUG-22-2007), St Public Notif requested (AUG-22-2007), St Site Visit (enforcement) (2 times from AUG-22-2007 to AUG-22-2007), St Violation/Reminder Notice (AUG-22-2007), St Compliance achieved (OCT-02-2007)
MCL, Acute (TCR) - Between APR-2007 and JUN-2007, Contaminant: Coliform. Follow-up actions: St Public Notif requested (JUL-20-2007), St Violation/Reminder Notice (JUL-20-2007), St Site Visit (enforcement) (JUL-20-2007), St Public Notif received (JUL-20-2007), St Boil Water Order (AUG-31-2007), St Compliance achieved (OCT-02-2007)
MCL, Monthly (TCR) - Between APR-2007 and JUN-2007, Contaminant: Coliform. Follow-up actions: St Public Notif requested (JUL-20-2007), St Violation/Reminder Notice (JUL-20-2007), St Public Notif received (AUG-13-2007), St Compliance achieved (OCT-02-2007)
Past monitoring violations:
2 routine major monitoring violations
Population served: 50, Groundwater):
Past health violations:
MCL, Monthly (TCR) - Between APR-2012 and JUN-2012, Contaminant: Coliform. Follow-up actions: St Public Notif requested (JUL-26-2012), St Public Notif received (JUL-26-2012), St Compliance achieved (JUL-26-2012), St Site Visit (enforcement) (JUL-26-2012), St Violation/Reminder Notice (JUL-26-2012)
MCL, Monthly (TCR) - Between JUL-2010 and SEP-2010, Contaminant: Coliform. Follow-up actions: St Public Notif requested (OCT-05-2010), St Site Visit (enforcement) (OCT-05-2010), St Public Notif received (OCT-05-2010), St Compliance achieved (OCT-28-2010)
Past monitoring violations:
One routine major monitoring violation
Drinking water stations with addresses in Milford that have no violations reported:
MILFORD BIBLE CHURCH (Population served: 600, Primary Water Source Type: Groundwater)
ST VINCENT DE PAUL RC CHURCH (Population served: 300, Primary Water Source Type: Groundwater)
GOLD KEY CLUBHOUSE (Population served: 80, Primary Water Source Type: Groundwater)
RED CARPET INN (Population served: 55, Primary Water Source Type: Groundwater)
SCOTTISH INNS (Population served: 40, Primary Water Source Type: Groundwater)
MARSCH KELLOGG POST 139 (Population served: 40, Primary Water Source Type: Groundwater)
UPPER DEL VALLEY CANCER CENTER (Population served: 40, Primary Water Source Type: Groundwater)
Average household size: This borough:
2.0 peoplePennsylvania:
2.5 people
Percentage of family households: This borough:
48.1%Whole state:
65.0%
Percentage of households with unmarried partners: This borough:
7.9%Whole state:
6.6%
Likely homosexual households (counted as self-reported same-sex unmarried-partner households)
Lesbian couples: 0.6% of all households Gay men: 2.0% of all households
32 people in nursing facilities/skilled-nursing facilities in 2010
Banks with branches in Milford (2011 data):
Wells Fargo Bank, National Association: The Dingman Hills Branch at 1294 Route 739, branch established on 1973/05/07; Milford Branch at 224 Broad Street, branch established on 1900/07/01. Info updated 2011/04/05: Bank assets: $1,161,490.0 mil, Deposits: $905,653.0 mil, headquarters in Sioux Falls, SD, positive income , 6395 total offices , Holding Company: Wells Fargo & Company
NBT Bank, National Association: Milford Branch at 214 West Hartford Street, branch established on 1996/12/23; Milford Twp. Pocono Branch at 101 Pocono Drive, branch established on 1988/11/09. Info updated 2012/02/02: Bank assets: $5,558.5 mil, Deposits: $4,381.4 mil, headquarters in Norwich, NY, positive income , Commercial Lending Specialization, 133 total offices , Holding Company: Nbt Bancorp Inc.
Woodforest National Bank: Milford Walmart Branch at 220 Route 6 And 209, branch established on 2007/06/30. Info updated 2011/05/10: Bank assets: $3,488.9 mil, Deposits: $3,097.6 mil, headquarters in Houston, TX, positive income , Commercial Lending Specialization, 766 total offices , Holding Company: Woodforest Financial Group Employee Stock Ownership Plan (With 401(K) Provisions)
Wayne Bank: Milford Branch at 111 West Hartford Street, branch established on 1987/05/15. Info updated 2011/06/09: Bank assets: $667.4 mil, Deposits: $527.0 mil, headquarters in Honesdale, PA, positive income , Commercial Lending Specialization, 16 total offices , Holding Company: Norwood Financial Corp.
Citizens Bank of Pennsylvania: Milford Branch at 407 West Harford Street, branch established on 1973/01/03. Info updated 2010/09/24: Bank assets: $32,316.9 mil, Deposits: $25,297.1 mil, headquarters in Philadelphia, PA, positive income , 396 total offices , Holding Company: Uk Financial Investments Limited
For population 15 years and over in Milford:
Never married: 56.9%Now married: 21.9%Separated: 0.6%Widowed: 9.3%Divorced: 11.3% For population 25 years and over in Milford:
High school or higher: 93.3%Bachelor's degree or higher: 39.5%Graduate or professional degree: 17.0%Unemployed: 7.2%Mean travel time to work (commute): 20.1 minutes
Education Gini index (Inequality in education) Here:
10.7Pennsylvania average:
11.5
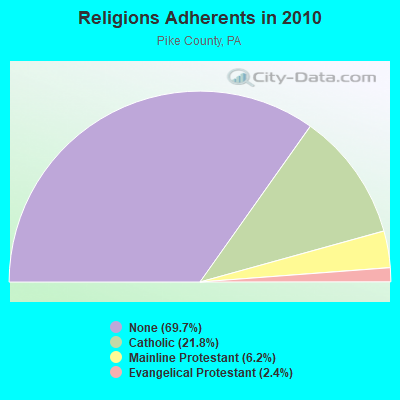
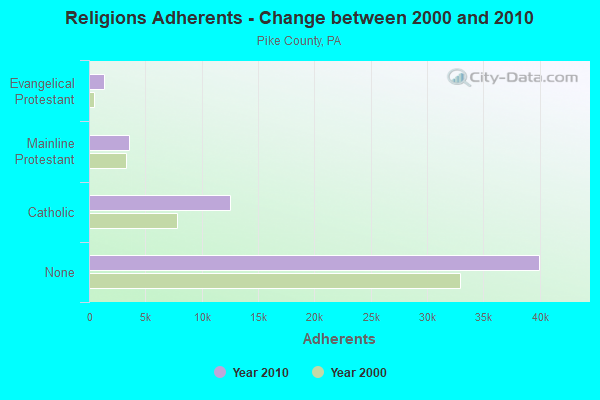
Religion statistics for Milford, PA (based on Pike County data)
Religion Adherents Congregations Catholic 12,500 11 Mainline Protestant 3,533 13 Evangelical Protestant 1,351 12 Other 4 1 None 39,981 -
Source: Clifford Grammich, Kirk Hadaway, Richard Houseal, Dale E.Jones, Alexei Krindatch, Richie Stanley and Richard H.Taylor. 2012. 2010 U.S.Religion Census: Religious Congregations & Membership Study. Association of Statisticians of American Religious Bodies. Jones, Dale E., et al. 2002. Congregations and Membership in the United States 2000. Nashville, TN: Glenmary Research Center. Graphs represent county-level data
Food Environment Statistics: Number of grocery stores : 8Pike County :
1.37 / 10,000 pop.State :
2.04 / 10,000 pop.
Number of convenience stores (no gas) : 2Pike County :
0.34 / 10,000 pop.Pennsylvania :
0.88 / 10,000 pop.
Number of convenience stores (with gas) : 15This county :
2.56 / 10,000 pop.Pennsylvania :
2.52 / 10,000 pop.
Number of full-service restaurants : 39Pike County :
6.66 / 10,000 pop.Pennsylvania :
7.12 / 10,000 pop.
Adult diabetes rate : Here :
8.6%Pennsylvania :
9.1%
Adult obesity rate : Here :
30.3%Pennsylvania :
27.2%
Low-income preschool obesity rate : This county :
10.5%State :
11.5%
Health and Nutrition: Healthy diet rate : Milford:
56.0%Pennsylvania:
50.2%
Average overall health of teeth and gums : This city:
54.3%Pennsylvania:
47.1%
Average BMI : Here:
27.9Pennsylvania:
28.7
People feeling badly about themselves : This city:
17.9%Pennsylvania:
20.8%
People not drinking alcohol at all : This city:
8.8%State:
10.9%
Average hours sleeping at night : This city:
7.0Pennsylvania:
6.8
Overweight people : This city:
34.1%Pennsylvania:
34.3%
General health condition : This city:
60.8%Pennsylvania:
56.2%
Average condition of hearing : This city:
78.6%Pennsylvania:
78.3%
More about Health and Nutrition of Milford, PA Residents
Local government employment and payroll (March 2022)
Function
Full-time employees
Monthly full-time payroll
Average yearly full-time wage
Part-time employees
Monthly part-time payroll
Police Protection - Officers
2 $6,863 $41,178 6 $10,422 Streets and Highways
2 $5,198 $31,188 3 $5,473 Financial Administration
2 $16,618 $99,708 0 $0 Other Government Administration
0 $0 3 $3,090
Totals for Government
6 $28,679 $57,358 12 $18,985
Milford government finances - Expenditure in 2022 (per resident):
Construction - Parks and Recreation: $6,000 ($5.34)
General Public Buildings: $6,000 ($5.34)Current Operations - Police Protection: $351,000 ($312.56)
Regular Highways: $204,000 ($181.66)Central Staff Services: $109,000 ($97.06)General - Other: $99,000 ($88.16)Financial Administration: $71,000 ($63.22)Parks and Recreation: $71,000 ($63.22)Solid Waste Management: $59,000 ($52.54)Health - Other: $42,000 ($37.40)Judicial and Legal Services: $41,000 ($36.51)General Public Buildings: $21,000 ($18.70)Local Fire Protection: $10,000 ($8.90)Sewerage: $1,000 ($0.89)Housing and Community Development: $1,000 ($0.89)General - Interest on Debt: $4,000 ($3.56)
Total Salaries and Wages: $401,000 ($357.08)
Milford government finances - Revenue in 2022 (per resident):
Charges - Other: $73,000 ($65.00)
Parks and Recreation: $19,000 ($16.92)Solid Waste Management: $1,000 ($0.89)Federal Intergovernmental - Other: $51,000 ($45.41)
Miscellaneous - Donations From Private Sources: $17,000 ($15.14)
General Revenue - Other: $12,000 ($10.69)Fines and Forfeits: $9,000 ($8.01)Rents: $3,000 ($2.67)State Intergovernmental - Other: $87,000 ($77.47)
Tax - Property: $1,016,000 ($904.72)
Documentary and Stock Transfer: $100,000 ($89.05)Occupation and Business License - Other: $27,000 ($24.04)Public Utility License: $14,000 ($12.47)Individual Income: $5,000 ($4.45)
Milford government finances - Debt in 2022 (per resident):
Long Term Debt - Outstanding Unspecified Public Purpose: $39,000 ($34.73)
Retired Unspecified Public Purpose: $39,000 ($34.73)Issue, Unspecified Public Purpose: $39,000 ($34.73)Beginning Outstanding - Unspecified Public Purpose: $39,000 ($34.73)
Businesses in Milford, PA
Name Count Name Count
Ace Hardware 1 Rite Aid 2 Dunkin Donuts 2 Staples 1 FedEx 2 Subway 2 Kroger 1 U-Haul 1 MasterBrand Cabinets 4 UPS 4 McDonald's 1 Walmart 1 Nike 1
Strongest AM radio stations in Milford:
WMCA (570 AM; 50 kW; NEW YORK, NY; Owner: SALEM MEDIA OF NEW YORK, LLC)
WABC (770 AM; 50 kW; NEW YORK, NY; Owner: WABC-AM RADIO, INC.)
WOR (710 AM; 50 kW; NEW YORK, NY; Owner: BUCKLEY BROADCASTING CORPORATION)
WSNR (620 AM; 20 kW; JERSEY CITY, NJ)
WINS (1010 AM; 50 kW; NEW YORK, NY; Owner: INFINITY BROADCASTING OPERATIONS, INC.)
WFAN (660 AM; 50 kW; NEW YORK, NY; Owner: INFINITY BROADCASTING OPERATIONS, INC.)
WEPN (1050 AM; 50 kW; NEW YORK, NY; Owner: NEW YORK AM RADIO, LLC)
WWJZ (640 AM; 50 kW; MOUNT HOLLY, NJ; Owner: ABC, INC.)
WBBR (1130 AM; 50 kW; NEW YORK, NY; Owner: BLOOMBERG COMMUNICATIONS INC.)
WADO (1280 AM; 50 kW; NEW YORK, NY; Owner: WADO-AM LICENSE CORP.)
WVNJ (1160 AM; 20 kW; OAKLAND, NJ; Owner: UNIVERSAL B/CASTING OF NEW YORK,INC.)
WCBS (880 AM; 50 kW; NEW YORK, NY; Owner: INFINITY BROADCASTING OPERATIONS, INC.)
WDLC (1490 AM; 1 kW; PORT JERVIS, NY; Owner: PORT JERVIS BROADCASTING CO., INC.)
Strongest FM radio stations in Milford:
WTSX (96.7 FM; PORT JERVIS, NY; Owner: PORT JERVIS BROADCASTING CO., INC.)
WNNJ-FM (103.7 FM; NEWTON, NJ; Owner: CLEAR CHANNEL BROADCASTING LICENSES, INC.)
WRPJ (88.9 FM; PORT JERVIS, NY; Owner: SOUND OF LIFE, INC.)
WXHD (90.1 FM; MOUNT HOPE, NY; Owner: AURICLE COMMUNICATIONS)
WSUS (102.3 FM; FRANKLIN, NJ; Owner: CLEAR CHANNEL BROADCASTING LICENSES, INC.)
WHCY (106.3 FM; BLAIRSTOWN, NJ; Owner: CLEAR CHANNEL BROADCASTING LICENSES, INC.)
WFKP (99.3 FM; ELLENVILLE, NY; Owner: CLEAR CHANNEL BROADCASTING LICENSES, INC.)
WNJP (88.5 FM; SUSSEX, NJ; Owner: NEW JERSEY PUBLIC BROADCASTING AUTH.)
WSUS-FM1 (102.3 FM; MONTAGUE, ETC., NJ; Owner: CLEAR CHANNEL BROADCASTING LICENSES, INC.)
WBYH (89.1 FM; HAWLEY, PA; Owner: 4 RIVERS COMMUNICATIONS B/G COMPANY)
WZAD (97.3 FM; WURTSBORO, NY; Owner: CUMULUS LICENSING CORP.)
WOSR (91.7 FM; MIDDLETOWN, NY; Owner: WAMC)
WLJP (89.3 FM; MONROE, NY; Owner: SOUND OF LIFE, INC.)
WWPJ (89.5 FM; PEN ARGYL, PA; Owner: MERCER COUNTY COMMUNITY COLLEGE)
WPDH (101.5 FM; POUGHKEEPSIE, NY; Owner: CUMULUS LICENSING CORP.)
WRKS (98.7 FM; NEW YORK, NY; Owner: EMMIS RADIO LICENSE CORP OF NEW YORK)
WSBG (93.5 FM; STROUDSBURG, PA; Owner: NASSAU BROADCASTING II, L.L.C.)
WSUL (98.3 FM; MONTICELLO, NY; Owner: REYNOLDS COMMUNICATIONS, INC.)
WPGP (88.3 FM; TAFTON, PA; Owner: SOUND OF LIFE, INC.)
WSPK (104.7 FM; POUGHKEEPSIE, NY; Owner: 6 JOHNSON ROAD LICENSES, INC.)
TV broadcast stations around Milford:
WNYW (Channel 5; NEW YORK, NY; Owner: FOX TELEVISION STATIONS, INC.)
WMBC-TV (Channel 63; NEWTON, NJ; Owner: MOUNTAIN BROADCASTING CORPORATION)
WFME-TV (Channel 66; WEST MILFORD, NJ; Owner: FAMILY STATIONS, INC.)
WPXO-LP (Channel 34; EAST ORANGE, NJ; Owner: PAXSON COMMUNICATIONS LPTV, INC.)
W36AZ (Channel 36; SUSSEX, NJ; Owner: NEW JERSEY PUBLIC B/CING. AUTHORITY)
WWPS-LP (Channel 8; HAWLEY, ETC., PA; Owner: ROBERT G. NEUHAUS)
Medal of Honor Recipients
Medal of Honor Recipient born in Milford: John A. Davidsizer.
Milford fatal accident list:
Mar 24, 2009 05:20 PM, Us-0006, George St, Lat: 41.325311, Lon: -74.799539, Vehicles: 1, Persons: 4, Pedestrians: 2, Fatalities: 1Vehicles: 2, Persons: 2, Fatalities: 1Vehicles: 1, Persons: 1, Fatalities: 1, Drunk persons involved: 1Vehicles: 3, Persons: 8, Fatalities: 2Vehicles: 2, Persons: 4, Fatalities: 2Vehicles: 2, Persons: 2, Fatalities: 1Vehicles: 2, Persons: 2, Fatalities: 1
National Bridge Inventory (NBI) Statistics 5 Number of bridges272ft / 83.1m Total length $13,801,000 Total costs33,044 Total average daily traffic2,236 Total average daily truck traffic40,470 Total future (year 2020) average daily traffic
FCC Registered Cell Phone Towers: 1 (
See the full list of FCC Registered Cell Phone Towers in Milford )
FCC Registered Antenna Towers: 49 (
See the full list of FCC Registered Antenna Towers )
FCC Registered Broadcast Land Mobile Towers: 12 (
See the full list of FCC Registered Broadcast Land Mobile Towers in Milford, PA )
FCC Registered Microwave Towers: 19 (
See the full list of FCC Registered Microwave Towers in this town )
FCC Registered Amateur Radio Licenses: 86 (
See the full list of FCC Registered Amateur Radio Licenses in Milford )
FAA Registered Aircraft: 5
Aircraft: CESSNA A152 (Category: Land, Seats: 2, Weight: Up to 12,499 Pounds), Engine: LYCOMING 0-235 SERIES (115 HP) (Reciprocating)N-Number: 152XT, N152XT, N-152XT, Serial Number: A1520907, Year manufactured: 1979, Airworthiness Date: 10/02/1979, Certificate Issue Date: 04/15/2015Registrant (Individual): Alcides L Diaz, 179 Philwood Ln, Milford, PA 18337Aircraft: BEECH B200 (Category: Land, Engines: 2, Seats: 11, Weight: 12,500 - 19,999 Pounds), Engine: P&W CANADA PT6A-42 (850 HP) (Turbo-prop)N-Number: 223TP, N223TP, N-223TP, Serial Number: BB-1348, Year manufactured: 1983, Airworthiness Date: 03/04/2015, Certificate Issue Date: 09/28/2018Registrant (Corporation): Rosado Aviation Inc, 500 Routes 6 & 209, Milford, PA 18337Aircraft: PIPER PA-28-140 (Category: Land, Seats: 4, Weight: Up to 12,499 Pounds, Speed: 107 mph), Engine: LYCOMING 0-320 SERIES (180 HP) (Reciprocating)N-Number: 5553U, N5553U, N-5553U, Serial Number: 28-26278, Year manufactured: 1969, Airworthiness Date: 08/20/1969, Certificate Issue Date: 08/17/2015Registrant (Individual): William S Schilling, 305 W High St, Milford, PA 18337Aircraft: CESSNA R172K (Category: Land, Seats: 4, Weight: Up to 12,499 Pounds, Speed: 76 mph), Engine: CONT MOTOR IO-360 SER (300 HP) (Reciprocating)N-Number: 758AA, N758AA, N-758AA, Serial Number: R1722931, Year manufactured: 1978, Airworthiness Date: 08/23/1978, Certificate Issue Date: 06/11/2019Registrant (Individual): Joseph M Sager, Po Box 743, Milford, PA 18337Aircraft: CESSNA 150M (Category: Land, Seats: 2, Weight: Up to 12,499 Pounds, Speed: 81 mph), Engine: CONT MOTOR 0-200 SERIES (100 HP) (4 Cycle)N-Number: 9299U, N9299U, N-9299U, Serial Number: 15078249, Year manufactured: 1976, Airworthiness Date: 04/15/1976, Certificate Issue Date: 08/21/2014Registrant (Individual): William S Schilling, 305 W High St, Milford, PA 18337Deregistered: Cancel Date: 04/18/2018
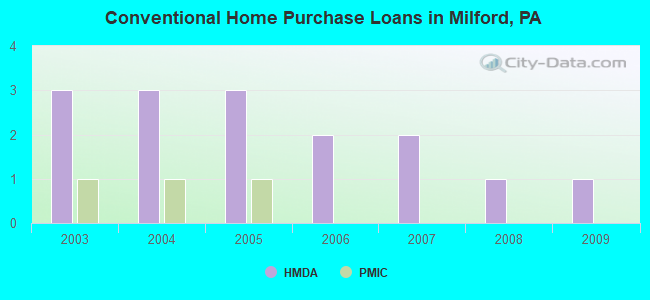
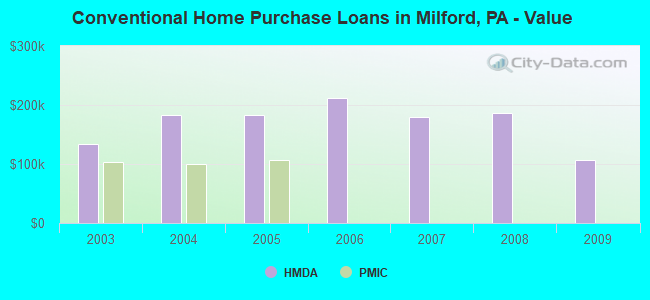
Home Mortgage Disclosure Act Aggregated Statistics For Year 2009(Based on 1 partial tract) A) FHA, FSA/RHS & VA B) Conventional C) Refinancings Number Average Value Number Average Value Number Average Value
LOANS ORIGINATED 1 $104,620 1 $106,840 2 $225,685 APPLICATIONS APPROVED, NOT ACCEPTED 0 $0 0 $0 0 $0 APPLICATIONS DENIED 0 $0 0 $0 2 $175,930 APPLICATIONS WITHDRAWN 0 $0 0 $0 1 $181,120 FILES CLOSED FOR INCOMPLETENESS 0 $0 0 $0 0 $0
Aggregated Statistics For Year 2008(Based on 1 partial tract) B) Conventional C) Refinancings Number Average Value Number Average Value
LOANS ORIGINATED 1 $185,820 2 $177,275 APPLICATIONS APPROVED, NOT ACCEPTED 0 $0 0 $0 APPLICATIONS DENIED 0 $0 2 $179,650 APPLICATIONS WITHDRAWN 0 $0 1 $140,800 FILES CLOSED FOR INCOMPLETENESS 0 $0 0 $0
Aggregated Statistics For Year 2007(Based on 1 partial tract) B) Conventional C) Refinancings D) Home Improvement Loans Number Average Value Number Average Value Number Average Value
LOANS ORIGINATED 2 $179,075 3 $155,687 1 $40,850 APPLICATIONS APPROVED, NOT ACCEPTED 0 $0 1 $118,340 0 $0 APPLICATIONS DENIED 0 $0 3 $193,313 1 $48,930 APPLICATIONS WITHDRAWN 0 $0 1 $200,210 0 $0 FILES CLOSED FOR INCOMPLETENESS 0 $0 0 $0 0 $0
Aggregated Statistics For Year 2006(Based on 1 partial tract) B) Conventional C) Refinancings D) Home Improvement Loans F) Non-occupant Loans on Number Average Value Number Average Value Number Average Value Number Average Value
LOANS ORIGINATED 2 $211,040 3 $180,680 1 $51,090 1 $95,960 APPLICATIONS APPROVED, NOT ACCEPTED 0 $0 1 $127,760 0 $0 0 $0 APPLICATIONS DENIED 1 $118,170 2 $211,660 1 $47,490 0 $0 APPLICATIONS WITHDRAWN 0 $0 2 $159,960 0 $0 0 $0 FILES CLOSED FOR INCOMPLETENESS 0 $0 0 $0 0 $0 0 $0
Aggregated Statistics For Year 2005(Based on 1 partial tract) B) Conventional C) Refinancings D) Home Improvement Loans F) Non-occupant Loans on Number Average Value Number Average Value Number Average Value Number Average Value
LOANS ORIGINATED 3 $183,800 4 $164,600 1 $55,510 1 $117,750 APPLICATIONS APPROVED, NOT ACCEPTED 0 $0 1 $118,810 0 $0 0 $0 APPLICATIONS DENIED 1 $97,780 2 $198,205 1 $36,030 0 $0 APPLICATIONS WITHDRAWN 0 $0 2 $177,615 0 $0 0 $0 FILES CLOSED FOR INCOMPLETENESS 0 $0 0 $0 0 $0 0 $0
Aggregated Statistics For Year 2004(Based on 1 partial tract) B) Conventional C) Refinancings D) Home Improvement Loans F) Non-occupant Loans on Number Average Value Number Average Value Number Average Value Number Average Value
LOANS ORIGINATED 3 $182,880 4 $136,862 0 $0 1 $87,830 APPLICATIONS APPROVED, NOT ACCEPTED 0 $0 1 $129,350 0 $0 0 $0 APPLICATIONS DENIED 0 $0 3 $115,200 1 $27,670 0 $0 APPLICATIONS WITHDRAWN 0 $0 2 $156,550 0 $0 0 $0 FILES CLOSED FOR INCOMPLETENESS 0 $0 1 $77,360 0 $0 0 $0
Aggregated Statistics For Year 2003(Based on 1 partial tract) B) Conventional C) Refinancings F) Non-occupant Loans on Number Average Value Number Average Value Number Average Value
LOANS ORIGINATED 3 $133,227 7 $119,514 1 $134,870 APPLICATIONS APPROVED, NOT ACCEPTED 0 $0 1 $161,300 0 $0 APPLICATIONS DENIED 0 $0 3 $114,487 0 $0 APPLICATIONS WITHDRAWN 0 $0 2 $114,860 0 $0 FILES CLOSED FOR INCOMPLETENESS 0 $0 0 $0 0 $0
Detailed HMDA statistics for the following Tracts:
9506.00
Private Mortgage Insurance Companies Aggregated Statistics For Year 2005(Based on 1 partial tract) A) Conventional Number Average Value
LOANS ORIGINATED 1 $106,250 APPLICATIONS APPROVED, NOT ACCEPTED 0 $0 APPLICATIONS DENIED 0 $0 APPLICATIONS WITHDRAWN 0 $0 FILES CLOSED FOR INCOMPLETENESS 0 $0
Aggregated Statistics For Year 2004(Based on 1 partial tract) A) Conventional Number Average Value
LOANS ORIGINATED 1 $100,240 APPLICATIONS APPROVED, NOT ACCEPTED 0 $0 APPLICATIONS DENIED 0 $0 APPLICATIONS WITHDRAWN 0 $0 FILES CLOSED FOR INCOMPLETENESS 0 $0
Aggregated Statistics For Year 2003(Based on 1 partial tract) A) Conventional Number Average Value
LOANS ORIGINATED 1 $103,790 APPLICATIONS APPROVED, NOT ACCEPTED 0 $0 APPLICATIONS DENIED 0 $0 APPLICATIONS WITHDRAWN 0 $0 FILES CLOSED FOR INCOMPLETENESS 0 $0
Detailed PMIC statistics for the following Tracts:
9506.00
Most common first names in Milford, PA among deceased individuals Name Count Lived (average)
John 98 76.6 years William 71 72.7 years Mary 50 81.7 years Robert 45 73.9 years George 43 75.3 years Charles 42 72.0 years Helen 40 79.3 years James 38 72.1 years Anna 33 83.3 years Joseph 33 70.9 years
Most common last names in Milford, PA among deceased individuals Last name Count Lived (average)
Smith 22 71.0 years Myer 16 87.6 years Miller 15 78.6 years Greening 11 75.4 years Murphy 11 76.4 years Snyder 9 80.2 years Brown 8 77.8 years Williams 7 72.3 years White 7 80.3 years Roberts 7 72.5 years
Milford compared to Pennsylvania state average:
Median house value above state average. Unemployed percentage below state average. Black race population percentage significantly below state average. Median age significantly above state average. Renting percentage above state average. Number of rooms per house below state average. Institutionalized population percentage above state average. Percentage of population with a bachelor's degree or higher above state average.
#75 on the list of "Top 101 cities with the most residents born in Middle Africa (population 500+)"
Top Patent Applicants
Martha Mincer (7)
William L. Gaddy (7)
Matthew Aaron Johnson (5)
Eric Aaron Langberg (5)
Michael E. St. John, Jr. (4)
Troy Allen Mcmillen (3)
Eric Langberg (2)
Craig D'Amico (2)
Janet Amitrano (1)
Eric A. Langberg (1)
Total of 64 patent applications in 2008-2025.


 Recent articles from our blog. Our writers, many of them Ph.D. graduates or candidates, create easy-to-read articles on a wide variety of topics.


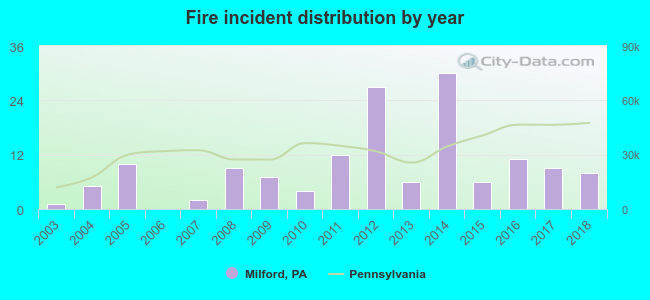 According to the data from the years 2003 - 2018 the average number of fires per year is 9. The highest number of reported fire incidents - 30 took place in 2014, and the least - 0 in 2006. The data has a growing trend.
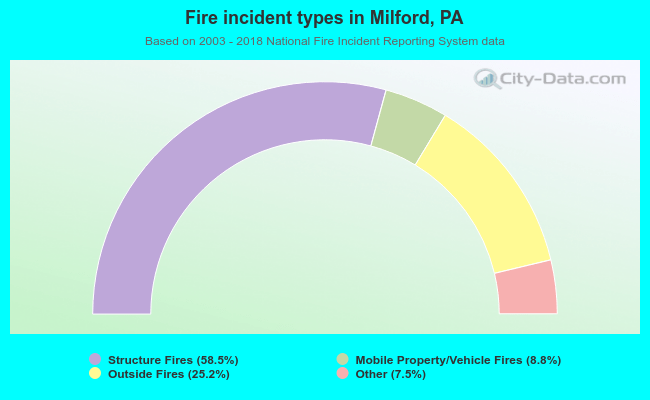 When looking into fire subcategories, the most incidents belonged to: Structure Fires (58.5%), and Outside Fires (25.2%).