Image-based Flow Cytometry Technique to Evaluate Changes in Granulocyte Function In Vitro
In This Article
Summary
This method demonstrates a technique for assessing granulocyte function by simultaneously measuring phagocytosis of bacteria and oxidative burst. Image-based flow cytometry allowed for the identification of three distinct subsets of activated granulocytes that all differed in their relative functional capacity.
Abstract
Granulocytes play a key role in the body’s innate immune response to bacterial and viral infections. While methods exist to measure granulocyte function, in general these are limited in terms of the information they can provide. For example, most existing assays merely provide a percentage of how many granulocytes are activated following a single, fixed length incubation. Complicating matters, most assays focus on only one aspect of function due to limitations in detection technology. This report demonstrates a technique for simultaneous measurement of granulocyte phagocytosis of bacteria and oxidative burst. By measuring both of these functions at the same time, three unique phenotypes of activated granulocytes were identified: 1) Low Activation (minimal phagocytosis, no oxidative burst), 2) Moderate Activation (moderate phagocytosis, some oxidative burst, but no co-localization of the two functional events), and 3) High Activation (high phagocytosis, high oxidative burst, co-localization of phagocytosis and oxidative burst). A fourth population that consisted of inactivated granulocytes was also identified. Using assay incubations of 10, 20, and 40-min the effect of assay incubation duration on the redistribution of activated granulocyte phenotypes was assessed. A fourth incubation was completed on ice as a control. By using serial time incubations, the assay may be able to able to detect how a treatment spatially affects granulocyte function. All samples were measured using an image-based flow cytometer equipped with a quantitative imaging (QI) option, autosampler, and multiple lasers (488, 642, and 785 nm).
Introduction
Granulocytes represent one component of the body’s innate immune system, which provides the first line of defense against invading antigens. Previous methods for assessing granulocyte function focused on phagocytosis capacity or oxidative burst using separate methods, making it difficult to ascertain collectively how granulocytes have changed 1-4. Advances in the field of flow cytometry have resulted in the production of benchtop instruments capable of high-resolution, multi-color imaging of cells in a high throughput manner 5. The ability to combine imaging with traditional flow cytometry represents an advancement that provides the technological platform needed to innovate within existing flow cytometry methods and extract new information about the immune system.
Over the past ten years, our laboratory, among others, has been keenly focused on the effect of various nutritional and exercise treatments patterns on innate immune function 6-9. The method demonstrated in this manuscript has practical implications within the field of clinical immunology. The present method leverages the power of image-based flow cytometry to simultaneously measure phagocytosis of bacterial particles and oxidative burst. Using this approach, one is able to separate activated granulocytes using variables provided by the image-based part of the analysis. These subsets were only identifiable after assessing the cellular images on the individual granulocytes. Further assay incubation time affected the transition between the three activation subsets 10. Thus, it is plausible that use of multiple incubation times may allow a method to test the change in granulocyte function following a specific experimental treatment. The purpose of this manuscript was to demonstrate a method of assessing granulocyte function by using image-based flow cytometry to simultaneously measure phagocytosis with oxidative burst.
Protocol
NOTE: All blood collection procedures described in this method were conducted in accordance with the Declaration of Helsinki and approved by the UNT institutional review board (IRB) for human subjects. All subjects gave written consent for blood collection, which was used in the present method to ensure that they were apparently healthy, of normal body weight, and disease free.
1. Reagent Source & Preparation
- Use CD66b-APC (clone#G10F5; DF=1:50) and CD45-APCeFluor780 (clone#2D1; DF=1:50) for this assay.
NOTE: Prior to the study, CD45 and CD66b antibodies were titered to determine the optimal dilution that clearly resolved granulocytes (CD45+/66b+) from other leukocytes (CD45+/66b-) 11. Upon addition of the diluted antibody for staining the final dilution in the tube was 875. - Purchase and thaw stock S. aureus bioparticles labeled with pHrodo red dye. Suspend at a concentration of 1 mg of bioparticles per ml in sterile PBS. Aliquot dilute bioparticles and store frozen at -20 °C until used in the assay.
- Dissolve dihydroethidium (DHE), which is converted to fluorescent ethidium bromide in the presence of oxygen-free radicals (i.e., the oxidative burst), in DMSO to a final concentration of 10 g/ml.
- Mix N-ethylmaleimide (used to prevent additional phagocytosis following the specified assay incubation duration) with sterile PBS in a 2 step dilution of 200 mg/ml and 17.5 mg/ml respectively. In the assay, use a final concentration of 15 mM. When thawing N-ethylmaleimide, use a 37 °C heat block, as the N-ethylmaleimide does not remain in solution.
- After the final fixation step, use 7AAD to stain nuclear DNA. Prior to addition, dilute stock 7AAD 1:10 with sterile PBS.
2. Blood Sample Collection
- Ask subjects to arrive at the laboratory following an O/N fast (>8hr) and abstention from physical activity (>12 hr).
- After cleaning the skin with an alcohol prep pad, insert a sterile blood collection needle into a peripheral arm vein.
- Collect blood into evacuated tubes that are commercially filled with sodium heparin.
- After collection, apply an adhesive bandage to the subject’s arm.
- Invert blood tubes to mix 10 times and then place on a rocker until analysis.
3. Phagocytosis Assay Technique
- Thaw S.aureus bioparticles (RT), DHE (RT), and N-ethylmaleimide (37 °C).
- Add 20 L of S.aureus bioparticles to 4 individual 1.2 ml tubes while working in the sterile hood.
- Add 40 L of DHE to each tube containing the bioparticles.
- Gently tap the tubes on the bench surface to collect the reagents in the bottom of the tube.
- Add 100 L of mixed whole blood to each tube that has been filled with bioparticles and DHE.
- Wipe the inside edge of the tubes with a cotton tipped applicator to remove any contaminating blood.
- Mix the blood and reagents with an electronic pipet set to mix the blood and reagents for three cycles after blood addition.
- Place assay tubes in an ice bucket and cover to protect from light.
- Incubate assay tubes for 10, 20, and 40 min. Start with the 40-min tube to ensure all assay tubes finish at the same time.
- Thaw N-ethylmaleimide in 37 °C bead bath.
- Pipet 15 L of N-ethylmaleimide (described above in 1.4) into each assay tube, incubate for 30-min.
- Pipet 10 L of CD66b-APC and 10 L of CD45-APCeFluor780 diluted antibodies (described above in 1.1), incubate for 60 min.
- Pipet 750 L of WBC fix / RBC lyse solution into each assay tube, incubate for 60-min.
- Centrifuge (10 min at 400 x g) assay tubes to collect the cell pellet.
- Vacuum aspirate the WBC lyse / RBC fix solution, leaving a residual fluid volume (100 L) above the cell pellet.
- Pipet 10 L of diluted 7AAD solution (described above in 1.5) and 50 L of PBS into each assay tube.
- Add one drop of calibration beads (~25 L) to each assay tube, place caps on assay tubes, wrap tubes in foil, and place in a refrigerator.
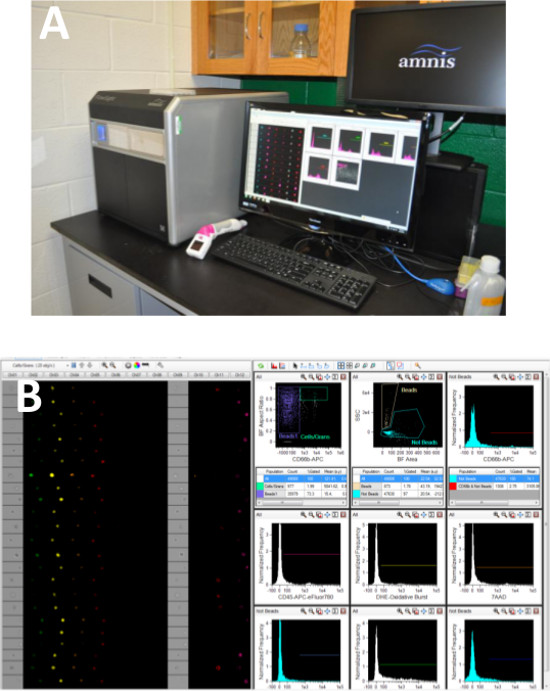
- Load the sample tube into the image-based flow cytometer and collect a minimum of 3,000 granulocyte events using pre-defined parameters: Autosampler, blue (488 nm; 60 mW), red (640 nm; 100 nW), SSC (785 nm; 8.5 mW) lasers (Figure 1).

Figure 1. Acquisition Method & Template. Samples were acquired on an image-based flow cytometer (A). During acquisition, dot plots of Bright Field Aspect Ratio vs. CD66b-APC were generated to separated granulocytes from spiked calibration beads using INSPIRE v. 100.2.292.0 software (B). A minimum of 5,000 granulocytes were acquired for each samples using an Autosampler, blue (488 nm; 60 mW), red (640 nm; 100 nW), SSC (785 nm; 8.5 mW) lasers. Please note that a number of histograms are present during acquisition to monitor laser settings and other aspects of data collect. All of these histograms are optional and only needed if the laboratory standard operating procedures requires them as quality control. Please click here to view a larger version of this figure.
4. Sample Acquisition and Analysis
- Use the automated software compensation wizard of the IDEAS software to apply a compensation matrix to raw image files (RIF) and create compensate imaged files (CIF).
- Load individual CIF files in IDEAS software and generate the following plots to identify the granulocyte subsets:
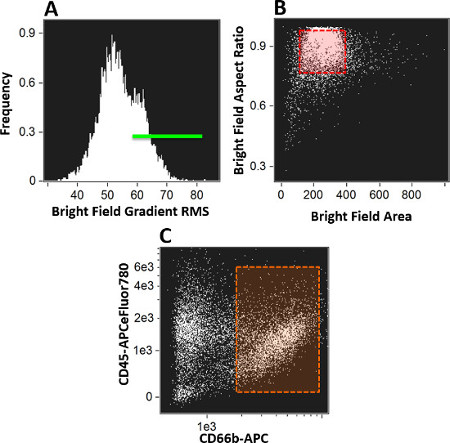
- Establish initial gates to identify the cells that were considered to be in focus using a histogram for bright field gradient RMS (Figure 2A). Make this determination for each patient sample using the unstimulated control as a reference standard.
- Use secondary plots to separate singlet cells from debris and doublets using a dot plot of bright field aspect ratio (ratio of cell height vs. width) vs. bright field area (Figure 2B). Make this determination for each patient sample using the unstimulated control as a reference standard.
- Once a clean population of cells had been identified, establish a dot plot of CD45 vs. CD66b (Figure 2C) to positively identify granulocytes (CD45+/66b+). Create a daughter plot (Figure 3) of bright detail intensity for S. aureus (x-axis) vs. bright detail intensity for oxidative burst (DHE, y-axis) to identify subsets of activated granulocytes. Collect bright field images in Channel 1 and 9, bioparticles in Channel 2, DHE in Channel 4, 7AAD in Channel 5, CD66b in Channel 11, and CD45 in Channel 12.

Figure 2. Analysis Template. This figure the series of plots that were generated to identify cells that were in focus (A), single cells (B), granulocytes (C). Additional plots were used to identify the three subsets of activated granulocytes vs. inactive granulocytes. All analysis of acquired image files was completed using IDEAS v.6 software. Please click here to view a larger version of this figure.
Representative Results
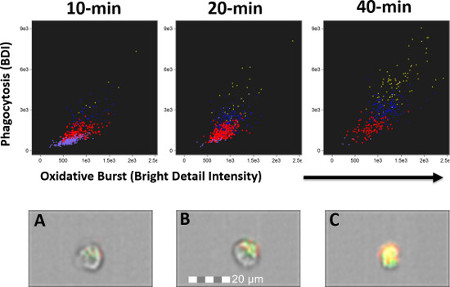
Using image-based flow cytometry allowed us to separate a homogenous population of activated granulocytes into three different activation subsets (Figure 3). In this method, the most effective way to resolve the three activation subsets is by plotting bright detail intensity for phagocytosis (S. aureus) vs. oxidative burst (DHE) (Figure 3; Figure 4). Also, use of the co-localization wizard in IDEAS software will allow for the quantification of the presence of simultaneous phagocytosis and oxidative burst, which is a hallmark sign of highly activated granulocytes.

Figure 3. Identification of Activated Granulocyte Subsets. After the identification of granulocytes using cell-surface markers (CD45+/66b+), a daughter plot was generated with bright detail intensity for phagocytosis vs. bright detail intensity for oxidative burst. Using this approach, percentage of inactive (purple), low-active (red, A), moderate-active (blue, B), and high-active (yellow, C) granulocytes was determined. This gating technique was also used to evaluate the effect of assay incubation time on the relative abundance of the various activated granulocyte subsets. The highest percentage of “high-active” granulocytes was present following the 40 min incubation. All analysis of acquired image files was completed using IDEAS v.6 software. Please click here to view a larger version of this figure.
In addition to demonstrating the presence of three distinct subsets of activated granulocytes, it was demonstrated that the assay incubation time influenced the relative abundance of each activated granulocytes subset. Specifically, the 40 min incubation resulted in the greatest percentage of “high-active” granulocytes. By including at least three assay incubation durations it may be possible to determine how a given clinical treatment alters the temporal activation status of granulocytes. This is the first published method using image-based flow cytometry to identify different activated granulocyte subsets as a function of simultaneous measurements of phagocytosis and oxidative burst.

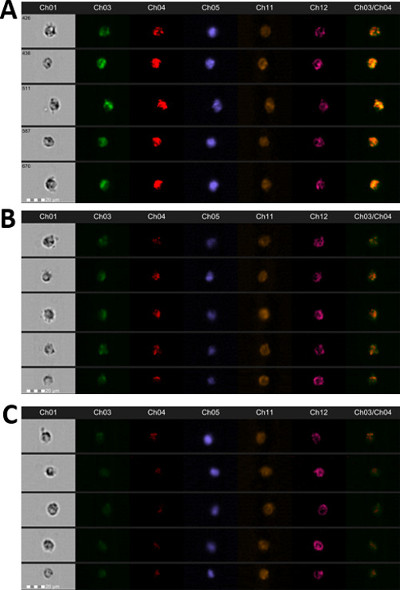
Figure 4. Representative Images of Cellular Markers. An image gallery of cells classified as high-active (A), moderate-active (B), and low-active (C) is presented in this figure. S.aureus bioparticles are in Ch03, oxidative burst is in Ch04, 7AAD for the nucleus is in Ch05, side scatter is in Ch06, CD66b is in Ch11, and CD45 is in Ch12. Also, a co-localized merge image of phagocytosis (Ch03) vs. oxidative burst (Ch04) is displayed. Areas of yellow in the merge image denote that phagocytosis and oxidative burst are occurring in the same anatomical space at the same time. Please click here to view a larger version of this figure.
Discussion
The present method represents a refinement of existing methods for the assessment of granulocyte function using flow cytometry 1,3,4,12-14. The critical steps of this assay tend to be related to proper mixing of the blood sample with the bioparticles and DHE. Incomplete mixing will result in inaccurate results. While complete mixing is critical, the mixing method should be gentle in nature. It is suggested that mixing be accomplished using an electronic pipet with a mixing function rather than a vortex mixer. Another critical step in the assay is to always ensure there is no blood contaminating the upper half of the assay tube. This residual blood can be removed using a sterile cotton-tipped applicator. Complete removal is important because failure to do so may contaminate the final assay preparation with un-lysed red blood cells.
Prior to using this method appropriate compensation controls should be added to control for spectral overlap amongst the reagents used to identify the various aspects of granulocyte function. For this method, compensation controls involve collect blood samples that have been suggested the 40 min assay incubation and then labeling with a single marker (i.e., E. coli, DHE, etc.). After labeling, single positive events are collected and a compensation matrix is generated using an automated wizard in the IDEAS analysis software. It is critical that if this assay is used, appropriate compensation controls are completed to ensure proper assay performance.
Analysis is accomplished using the feature finder and co-localization wizards to identify that bright detail intensity is the best variable to separate the populations and also identify how much overlap exists between oxidative burst and phagocytosis signals. Specifically, the use of image-based cytometry provided the ability to segregate activated granulocytes into three subsets. This subset breakdown was determined using bright detail intensity of phagocytosis vs. oxidative burst. In addition to examining these singular cell functions, cells that exhibited both events at the same time in the same anatomical location (co-localization) were identified. Granulocytes that fell into the “high-active” subset were the only phenotype that demonstrated consistent co-localization between phagocytosis and oxidative burst. This identification of activated granulocyte subsets is the biggest area where troubleshooting is needed. It is very important for a new user to take time to understand the sample process workflow in IDEAS and to understand the mechanics of gating the cell populations using the imaging component. Other modifications that a user may seek to make include the selection of alternate or additional assay incubation times. The current method suggests the use of durations of 10-40 min; however, depending on the experimental model where this method is to be used, it may be necessary to select longer assay durations. Such a modification would need to be evaluated on an individual basis.
Further it was determined that the duration of the assay incubation has a significant effect on the appearance of the three activated subsets. The approach described in this report represents an extension of what information could be previously obtained regarding granulocyte function 3,4,13,15. Other laboratories have demonstrated the importance of assessing changes in granulocyte function as part of a comprehensive assessment of immunity and disease 15-17. Despite the potential of this assay it is not without limitations. One of the major limitations is cost and time demand associated with high sample throughput processing. When a study design requires a large number of samples in a given day, these can be difficult to process. Processing is streamlined by the use of electronic pipets and dispensers, but these tend to be expensive and are not necessarily available in every laboratory.
Our area of research focuses on a study of how exercise and dietary habits influence immune system health and function 6,8-10,18-20. Such objectives have significant practical implications for a variety of areas of human health. Beyond the study of exercise and nutritional effects the phagocytosis method demonstrated in this manuscript could be useful in other areas of clinical immunology where the monitoring of phagocytosis function is critical to treatment outcomes. The present assay is the first of many that immunological assays with the potential to be re-invented by taking advantages of the unique imaging information that can be can from an image-based flow cytometer.
Disclosures
The authors have nothing to disclose.
Acknowledgements
The present study was funded in part by a Research Initiation Grant (RIG) from the University of North Texas to Dr. McFarlin. The authors did not receive direct funding for the completion of this study and report no conflict of interest.
Materials
| Name | Company | Catalog Number | Comments |
| Name of Material/ Equipment | Company | Catalog Number | Comments/Description |
| Vacutainers | BD Life Sciences | used for blood collection | |
| WBC Fixative / RBC Lysis solution | eBioscience | 00-5333-57 | |
| CD66b-APC | eBioscience | clone G10F5 | |
| CD45-APCeFluor780 | eBioscience | clone 2D1 | |
| s.aureus bioparticles | Life Technologies | A10010 | |
| dihydroethidium | Sigma-Aldrich | D7008 | |
| N-ethylmalemide | Sigma-Aldrich | 4259 | |
| 7AAD | EMD Millipore | ||
| Hematology Analyzer | Mindray | BC-3200 | |
| 96-channel pipet | Integra Biosciences | ViaFlo | |
| Bead Bath Incubator | LabArmour | BeadBath | |
| Imaging Flow Cytometer | EMD Millipore | Amnis FlowSight | |
| INSPIRE Software | EMD Millipore | Amnis INSPIRE | |
| IDEAS Software | EMD Millipore | Amnis IDEAS | |
| X-Pierce Piercable Plate Sealer | Excel Scientific, Inc. | X-Pierce | |
| Dell Precision Workstation | Dell Computers | Various | Used for IDEAS analysis |
References
- Kong, M., et al. The effect of alpha-fetoprotein on the activation and phagocytosis of granulocytes and monocytes. Hepatogastroenterology. 59, 2385-2388 (2012).
- Prakash, P. S., Caldwell, C. C., Lentsch, A. B., Pritts, T. A., Robinson, B. R. Human microparticles generated during sepsis in patients with critical illness are neutrophil-derived and modulate the immune response. J. Trauma Acute Care Surg. 73, 401-406 (2012).
- Salih, H. R., Husfeld, L., Adam, D. Simultaneous cytofluorometric measurement of phagocytosis, burst production and killing of human phagocytes using Candida albicans and Staphylococcus aureus as target organisms. Clin. Microbiol. Infect. 6, 251-258 (2000).
- Tsuji, S., Iharada, A., Taniuchi, S., Hasui, M., Kaneko, K. Increased production of nitric oxide by phagocytic stimulated neutrophils in patients with chronic granulomatous disease. J. Pediatr. Hematol. Oncol. 34, 500-502 (2012).
- Ortyn, W. E., et al. Sensitivity measurement and compensation in spectral imaging. Cytometry A. 69, 852-862 (2006).
- McFarlin, B. K., et al. A one-year school-based diet/exercise intervention improves non-traditional disease biomarkers in Mexican-American children. Matern. Child Nutr. 9, 524-532 (2013).
- McFarlin, B. K., Johnson, C. A., Moreno, J. P., Foreyt, J. P. Mexican-American Children have differential elevation of Metabolic Biomarkers that is proportional to Obesity Status. J. Pediatr. Gastroenterol. Nutr. , (2013).
- Strohacker, K., et al. Moderate-intensity, premeal cycling blunts postprandial increases in monocyte cell surface CD18 and CD11a and endothelial microparticles following a high-fat meal in young adults. Appl. Physiol. Nutr. Metab. 37, 530-539 (2012).
- Carpenter, K. C., Breslin, W. L., Davidson, T., Adams, A., McFarlin, B. K. Baker's yeast beta-glucan supplementation increases monocytes and cytokines post-exercise: implications for infection risk. Br. J. Nutr. , 1-9 (2012).
- McFarlin, B. K., Williams, R. R., Venable, A. S., Dwyer, K. C., Haviland, D. L. Image-based cytometry reveals three distinct subsets of activated granulocytes based on phagocytosis and oxidative burst. Cytometry A. 83, 745-751 (1002).
- McFarlin, B. K., Williams, R. R., Venable, A. S., Dwyer, K. C., Haviland, D. L. Image-based cytometry reveals three distinct subsets of activated granulocytes based on phagocytosis and oxidative burst. Cytometry A. 83, 745-751 (2013).
- Ichii, H., et al. Iron sucrose impairs phagocytic function and promotes apoptosis in polymorphonuclear leukocytes. Am J Nephrol. 36, 50-57 (2012).
- Ploppa, A., George, T. C., Unertl, K. E., Nohe, B., Durieux, M. E. ImageStream cytometry extends the analysis of phagocytosis and oxidative. Scand. J. Clin. Lab. Invest. 71, 362-369 (2011).
- Van Amersfoort, E. S., Van Strijp, J. A. Evaluation of a flow cytometric fluorescence quenching assay of phagocytosis of sensitized sheep erythrocytes by polymorphonuclear leukocytes. Cytometry. 17, 294-301 (1994).
- Gullstrand, B., et al. Combination of autoantibodies against different histone proteins influences complement-dependent phagocytosis of necrotic cell material by polymorphonuclear leukocytes in systemic lupus erythematosus. J. Rheumatol. 39, 1619-1627 (2012).
- Fierro, M. T., et al. Functional and phenotypical impairment of polymorphonuclear cells in atopic dermatitis: an additional cause for the known susceptibility to infections. Dermatology. 224, 323-330 (2012).
- Gruger, T., et al. Negative impact of linezolid on human neutrophil functions in vitro. Chemotherapy. 58, 206-211 (2012).
- McFarlin, B. K., Venable, A. S. Measurement of Low Concentration Human Serum Cytokines using a Millipore High-Sensitivity Milliplex Assay. J. Vis. Exp. , (2014).
- McFarlin, B. K., Carpenter, K. C., Davidson, T., McFarlin, M. A. Baker's Yeast Beta Glucan Supplementation Increases Salivary IgA and Decreases Cold/Flu Symptomatic Days After Intense Exercise. J. Diet. Suppl. 10, 171-183 (2013).
- McFarlin, B. K., Carpenter, K. C., Strohacker, K., Breslin, W. L. Comparison of blood monocytes and adipose tissue macrophages in a mouse model diet-induced weight gain. Comp. Med. 62, 462-465 (2012).
This article has been published
Video Coming Soon
ABOUT JoVE
Copyright © 2025 MyJoVE Corporation. All rights reserved