public-preview

Subscribe to all “public-preview” posts via RSS or follow GitHub Changelog on Twitter to stay updated on everything we ship.

~ cd github-changelog
~/github-changelog|main git log main
showing all changes successfully

GitHub Models has entered public preview! GitHub Models provides every GitHub developer with access to top AI models via a playground, API, and more.

GitHub Models product screenshot showing the model playground

Since the announcement of GitHub Models almost three months ago, we’ve shipped a number of enhancements and new models.

New features include:

  • Side-by-side comparisons – Compare the output of two models as they respond to the same prompt in real time.
  • Model presets – Save prompts, parameters, and messages to use later or share with a friend.
  • Multimodal support – Provide images in the playground to models that support multimodal capabilities.
  • Streamlined deployment process – Quickly move your application from development to production with an Azure production key.

New surfaces to use models include:

  • Models CLI extension – Use any model from the command line by extending the GitHub CLI with `gh extension install https://github.com/github/gh-models`.
  • Models Copilot extensionInstall the GitHub Models Copilot Extension and call GitHub Models with @models in GitHub Copilot Chat.
  • Azure AI Toolkit for VS Code – Access GitHub Models in VS Code with the pre-release of Azure AI Toolkit, available on the VS Code Marketplace.

New model ships include:

To learn more about GitHub Models, check out the docs.

Join our Community

Join our dedicated Community Discussions to discuss this update, swap tips, and share feedback.

See more

A new version of the commit details page is now available in public beta!

This new page, which is enabled by default, lets you quickly understand and navigate the changes in a commit with improvements to filtering, commenting, and keyboard navigation.

Screen shot of the new commit details page that shows the metadata about the commit, a file tree showing the 3 files changed by the commit, diff snippets for each of the changed files, and a floating comment

What’s new 🎉

Here are a few of the noteworthy changes:

  • Floating comments: Code comments float over the diff when selected. To select, click on the commenter’s avatar to the right of the line.
  • Comment counts: To help you identify files with comments, the number of comments for a file now appears in the file tree.
  • Keyboard navigation within diffs: You can now navigate around changed lines in the diff using the up and down keys on your keyboard. A new context menu also makes it easier to comment, copy, and select.
  • Quick view switching: Switching between unified and split views no longer reloads the page.
  • Filter by file extension: Easily filter changed files by file extension in the diff to see the content most relevant to you.
  • Filtered out diffs hidden: When filtering the file tree, diffs are filtered as well, allowing you to reduce distraction and see the files you care about most.

Next steps 📣

To give feedback, ask questions, or report a bug join us in the feedback discussion.

To opt out of the preview, go the Feature Preview dialog on your profile, select New Commit Details Page, and click Disable.

To learn more about viewing commits, see About commits.

See more

The pull request commits page has been refreshed to improve performance, improve consistency with other pages, and to make the experience more accessible!

Screenshot of the updated PR commits page showing a list of commits for a PR

To minimize disruptions, the capabilities of the classic commits page have been maintained, with a few exceptions: you can now use arrow keys to navigate the list of commits (instead of j and k) and focus indicators have been improved for better visual distinction.

Opt out

To switch back to the classic commits page, disable the “New Pull Request Commits Experience” feature preview (learn more).

Feedback

To provide feedback, ask questions, learn about known issues, visit the GitHub Community feedback discussion!

See more

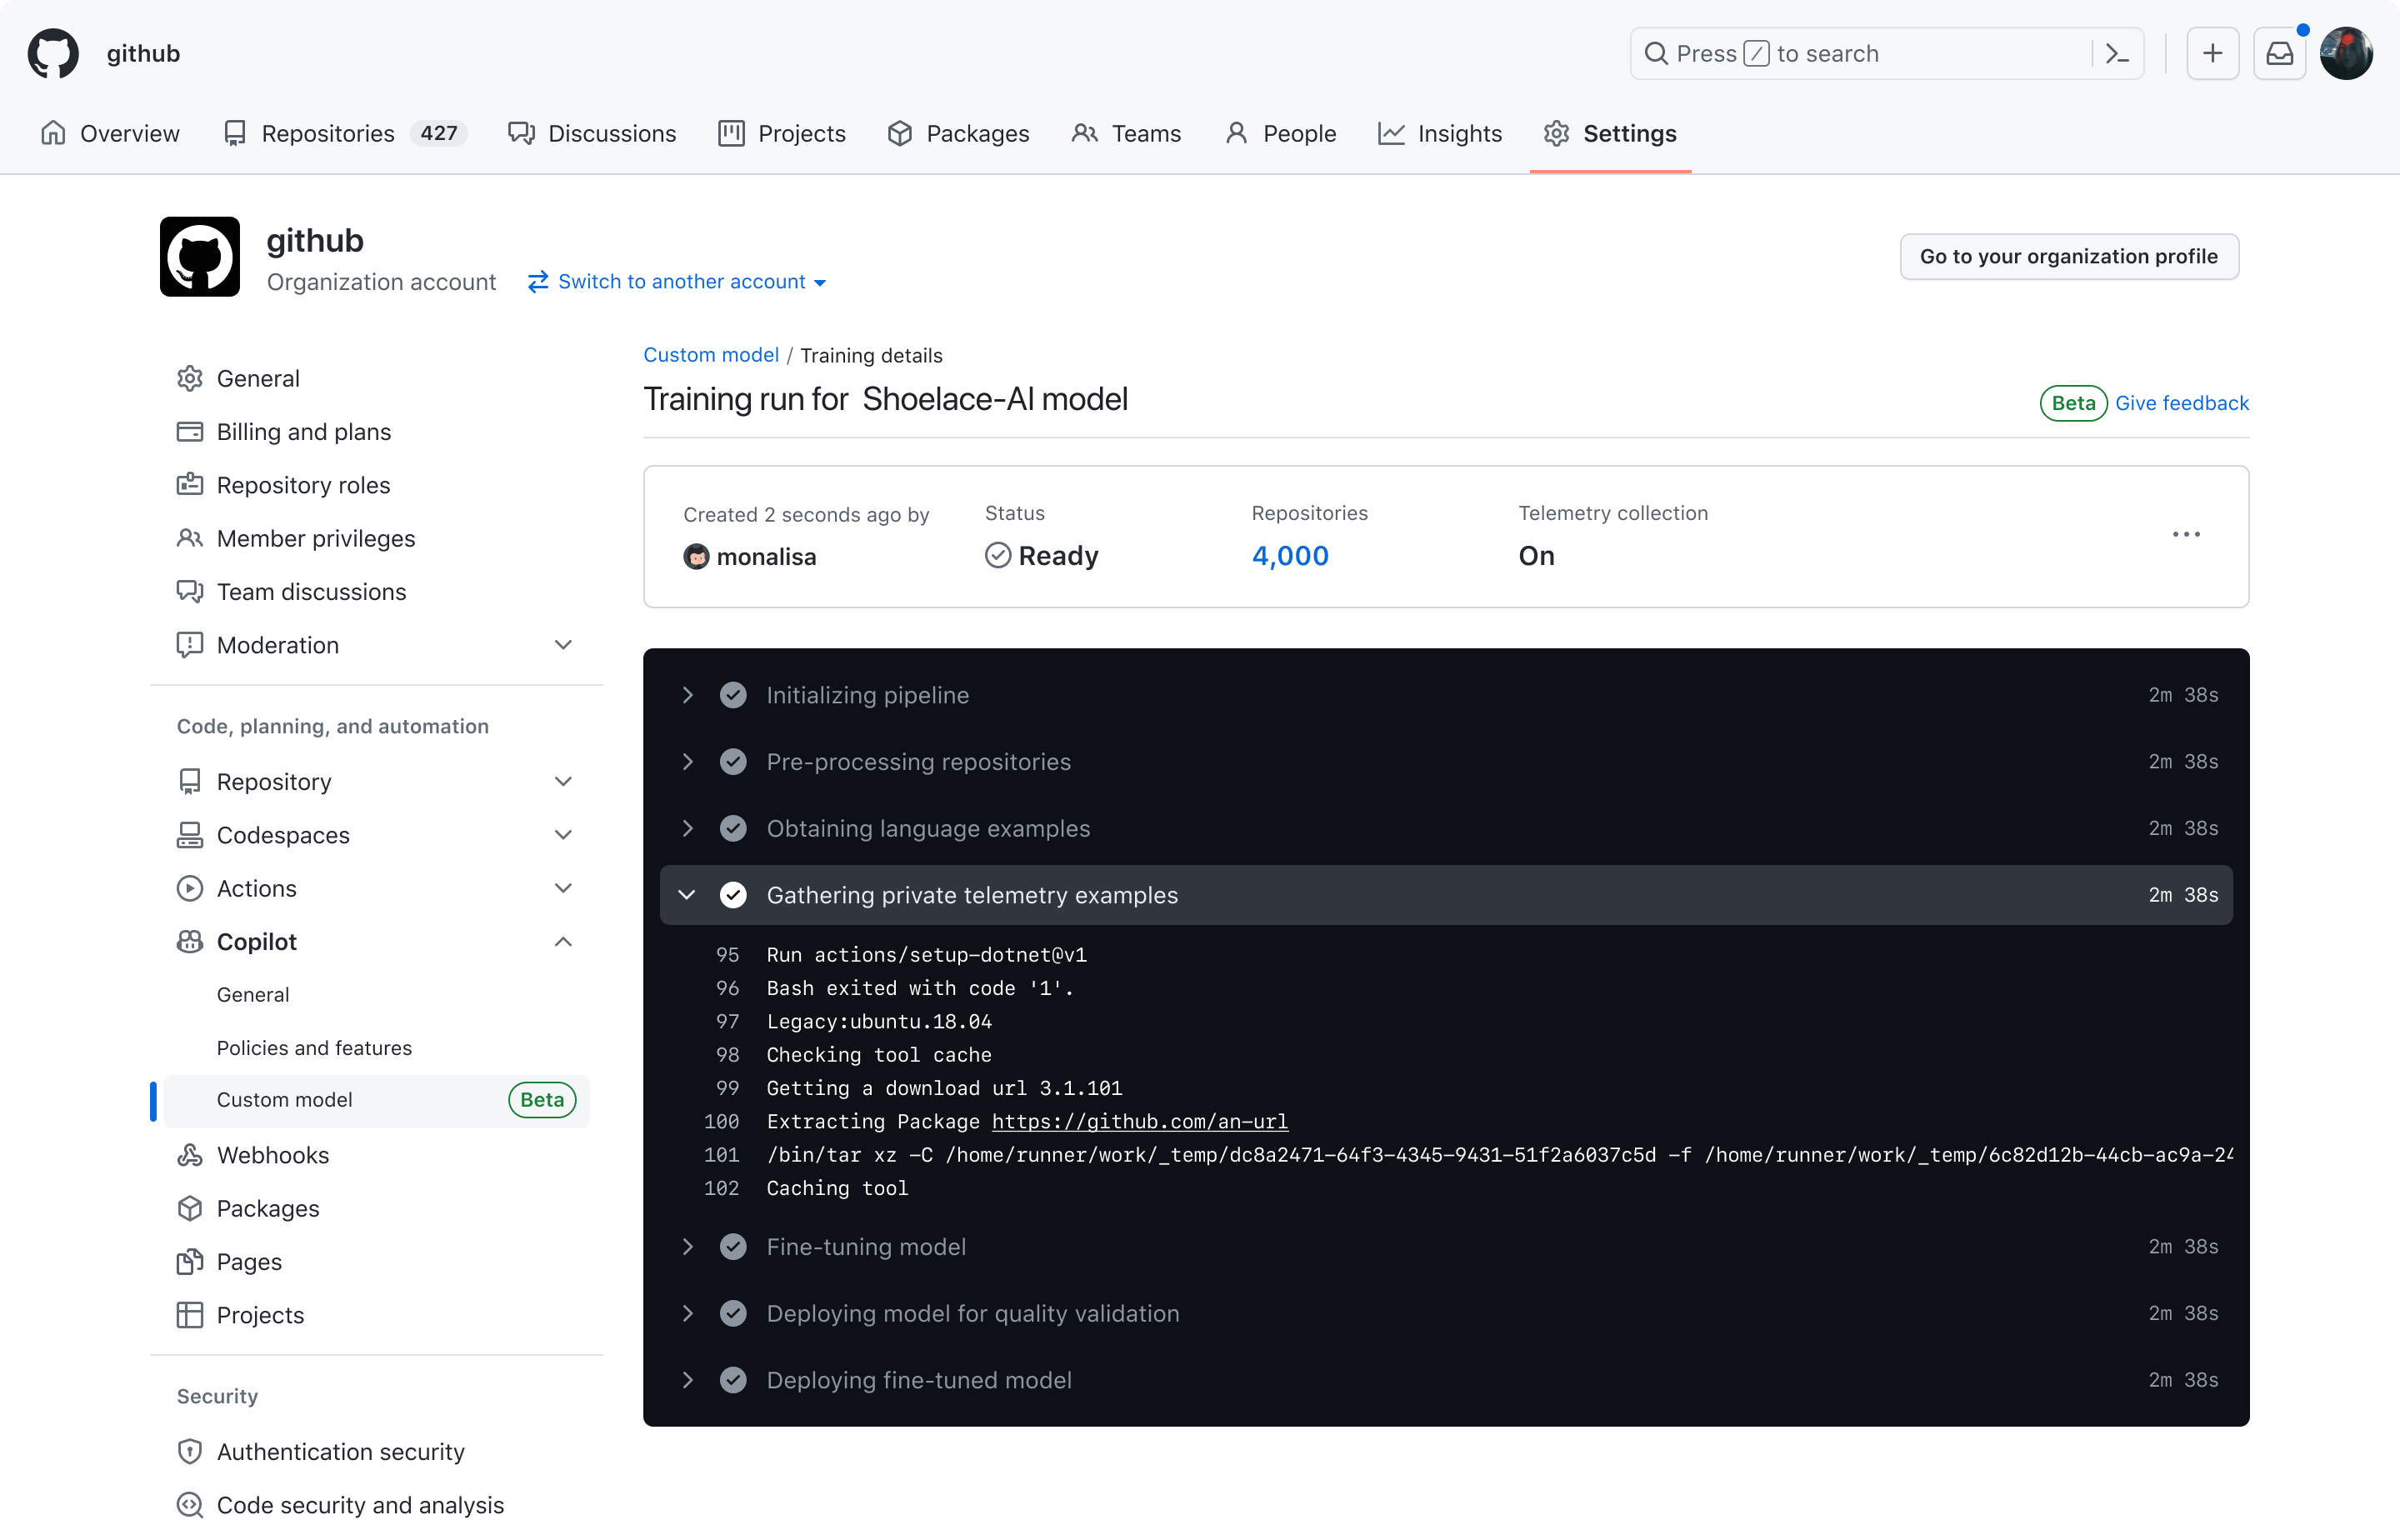
Custom models for GitHub Copilot are now available in Limited Public Beta for Copilot Enterprise. This new capability lets you fine-tune Copilot to better understand and align with your organization’s unique coding practices, improving the relevance and accuracy of code suggestions across your projects.

What are custom models?

Custom models are large language models (LLMs) that have been fine-tuned using your organization’s codebases. By training a model on your proprietary libraries, specialized languages, and internal coding patterns, Copilot delivers code suggestions that are more context-aware and tailored to your organization’s needs.

During this beta, you can create a custom model using your GitHub repositories. Optionally, you may also enable the collection of code snippets and telemetry from developers’ Copilot prompts and responses to further fine-tune the model. This process closely aligns Copilot’s suggestions with your coding practices, making them more relevant and accurate. As a result, your development teams will spend less time on code reviews, debugging, and manual code adjustments, ultimately boosting team productivity and ensuring more consistent code quality.

Custom-Model-Training-Config

Importantly, your data remains entirely yours. It is never used to train another customer’s model, and your custom model is kept private, ensuring full control, security, and privacy.

When to Use Custom Models

Custom models enable you to make Copilot’s suggestions more relevant to your specific needs, which can lead to higher acceptance rates of the code suggested by Copilot among your developers. Consider using custom models in the following scenarios:

  • Enhance Library and API Usage: When your organization relies heavily on custom libraries or APIs that aren’t well-represented in public datasets, a custom model can prioritize these in its suggestions, making it easier for your developers to follow internal standards.

  • Improve Support for Specialized Languages: If your team works with less common or proprietary languages, custom models can make Copilot much more effective. Fine-tuning helps Copilot understand these languages better, reducing friction and improving productivity.

  • Adapt to Evolving Codebases: As your codebase changes, you have full control over when and how often to retrain your custom model. By regularly retraining, you can ensure that Copilot keeps up with the latest coding patterns, so it continues to provide relevant and accurate suggestions.

How to Get Started

  1. Sign Up for the Beta:
    Sign up here to participate in the Limited Public Beta and make sure your organization is on the Copilot Enterprise plan.

  2. Prepare Your Repositories:
    Choose the repositories that best reflect your organization’s coding standards. Include those with proprietary libraries, specialized languages, or key internal frameworks to get the most out of fine-tuning. If your enterprise has multiple GitHub organizations, note that only one organization and its repositories can be used for training during this beta.

  3. Enable Telemetry Collection:
    To further customize your model, consider enabling the collection of code snippets and telemetry related to developers’ prompts and Copilot’s suggestions. This data will be securely collected and used for additional fine-tuning, improving the accuracy and relevance of Copilot’s output for your team. Your data will only be used to enhance your custom model and will not be shared with others. For more details about our data-handling practices, please visit the Trust & Security Center or review GitHub’s data protection agreement.

  4. Training and Usage:
    After setup, your custom model will be trained using the selected repositories. Once it’s ready, your developers’ IDEs will automatically start using the custom model, which will inform all in-line code completions.

  5. Monitoring & Quality Assessment:
    Regularly retrain your custom model to keep it aligned with new code and evolving practices. Use the Copilot Usage Metrics API to track metrics like suggestion acceptance rates and see how much it’s improving.

Additional Resources

See more

Gain valuable insights and effectively monitor your enterprise’s security landscape and progress with two new enterprise-level pages: the security overview dashboard and secret scanning metrics.

New overview dashboard on the security tab at the organization level

Key features

  • Customizable filters: Select specific time periods and focus areas such as security tool, team, or custom repository property.
  • Comprehensive data: Trending and snapshot data provide a robust security landscape overview.
  • Detailed metrics: Includes metrics such as the average age of security alerts, mean time to remediate, and push protection statistics.

To access these new enterprise-level views, navigate to your enterprise account. In the enterprise account sidebar, click Code Security. The new pages are accessible to organization owners and organization security managers, with data scoped to the repositories and alerts you have access to.

These two pages are now available as a public beta on GitHub Enterprise Cloud and will be available in GitHub Enterprise Server 3.14.

Learn more about security overview, managing code security for your enterprise, and send us your feedback

Questions or suggestions? Join the conversation in the community discussion.

See more

Customers desire clear, relevant, and actionable insights about how Actions workflows are being used in their organization. Today, we are thrilled to announce that Actions Usage Metrics is available in public beta for GitHub Enterprise Cloud plans.

Actions Usage Metrics screenshot

Time is the most important metric for DevOps and DevEx teams. The question they want answered is, “where are all my minutes going?” Actions Usage Metrics addresses this question and others by focusing on minutes used per workflow, job, repository, runtime OS, and runner type. This data helps organizations locate areas of improvement in their software delivery lifecycle, saving time and money.

Customers can filter data by any combination of workflows, jobs, repositories, runtime OS, and runner type to view total minutes, number of jobs, workflow executions, and more. All usage metrics, filtered or not, can be downloaded as a .csv file to use with your tool of choice.

By default, organization owners can access Actions Usage Metrics. However, access permissions can be granted to other members or teams using Actions fine-grained permissions. This ensures the right level of access to Actions Usage Metrics data, enabling informed decisions and improvements.

To learn more about Actions Usage Metrics, check out our docs or head to our community discussion.

See more

Configuring merge queue in your repo rulesets is now available in public beta!

Screenshot showing the configuration of merge queue inside a ruleset

Merge queue & rule insights

Until now, rule insights would only list one pull request as merged even when multiple pull requests were merged by the queue at the same time. Also in this beta, each pull request in a merge queue will have an individual record in rule insights, linked to the actor that added the pull request to the merge queue.

Example screenshot showing rules insights and all PRs from a queue

Within the additional data of a rule insight dialog you can now see all the pull requests that merged in the same group along with the checks needed for the queue.

Example screenshot of details of a queue in rule insights

Limitations

  • The merge queue rule cannot be configured via an API. This feature will be available in the near future.
  • Merge Queue for branch protections and repository rules do not support wildcard patterns
  • Not supported in organization rulesets.
  • Multiple merge queues configured against a single branch will prevent merging.

Join the discussion within GitHub Community.

See more

Reduce pull request noise and fix multiple security alerts at once with Dependabot grouped security updates.

Starting today, you can enable grouped security updates for Dependabot at the repository or organization-level. When you click “Enable” for this feature, Dependabot will collect all available security updates in a repository and attempt to open one pull request with all of them, per ecosystem, across directories. There is no further configuration available at this time.

Known limitations

  • Dependabot will NOT group across ecosystem (e.g. it will not group pip updates and npm updates together)
  • Dependabot WILL group across directories (e.g. if you have multiple package.json’s in different directories in the same repository)
  • If you have version updates enabled as well, Dependabot will NOT group security updates with version updates
  • If you use grouping for version updates, your groups configuration in dependabot.yml will NOT apply to security updates

To enable this feature, go to your repository or organization settings page, then go to the Code security and analysis tab, and click “Enable” for grouped security updates (this also requires each affected repository to enable Dependency graph, Dependabot alerts, and Dependabot security updates). When you enable this feature, Dependabot will immediately attempt to create grouped security pull requests for any available security updates in your repository.

We’d love to hear your feedback as you try this feature! Join the discussion within GitHub Community.

See more

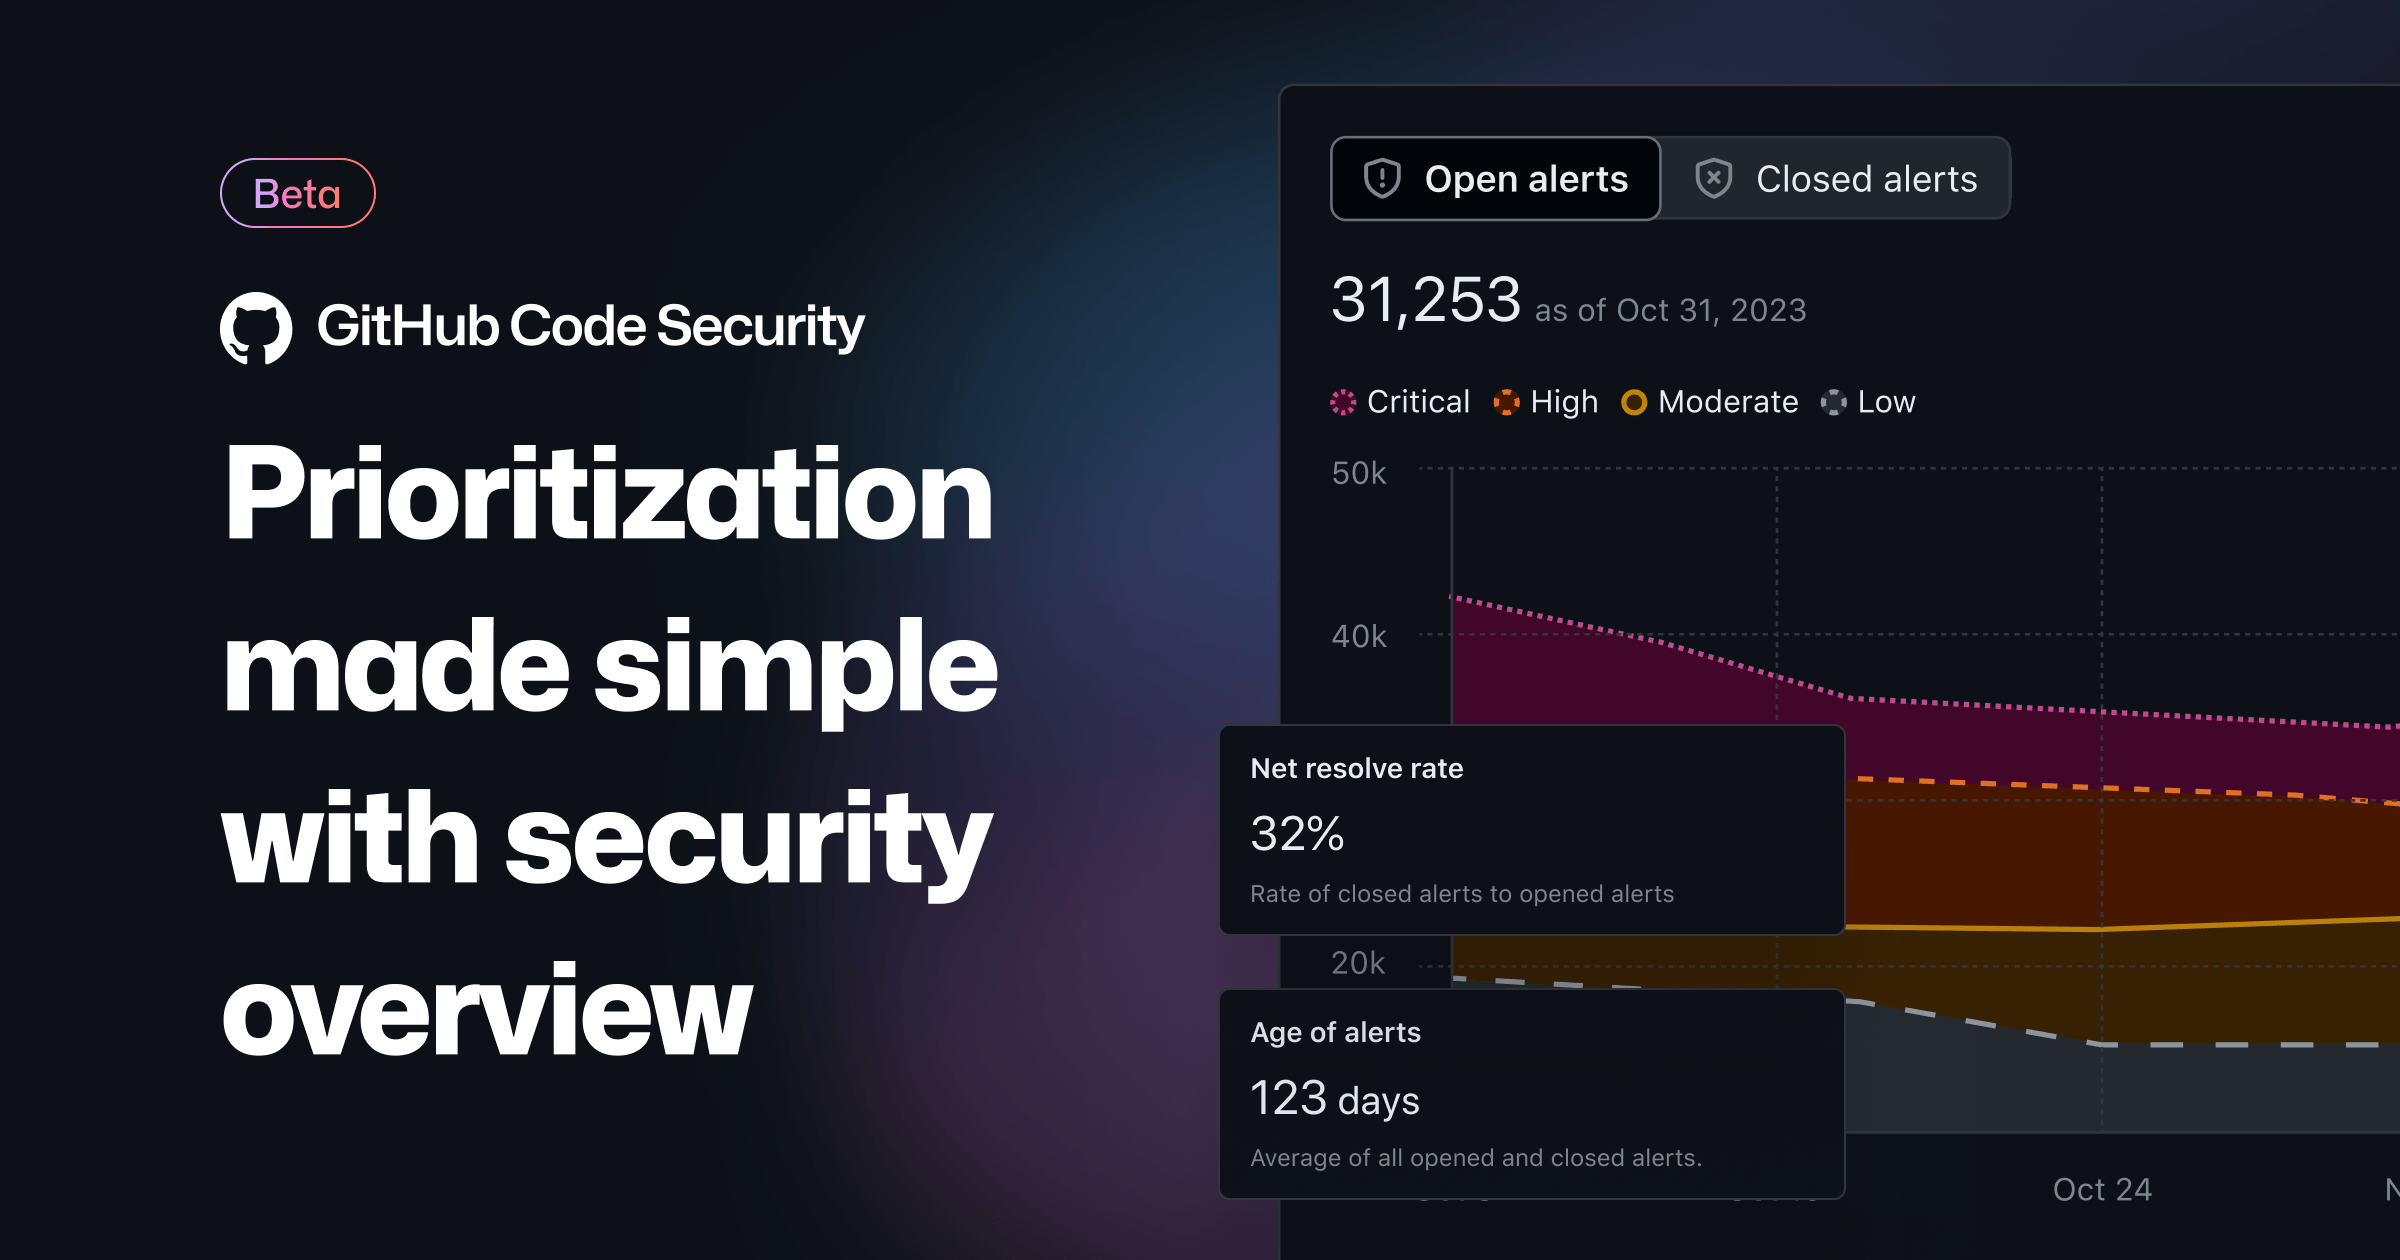
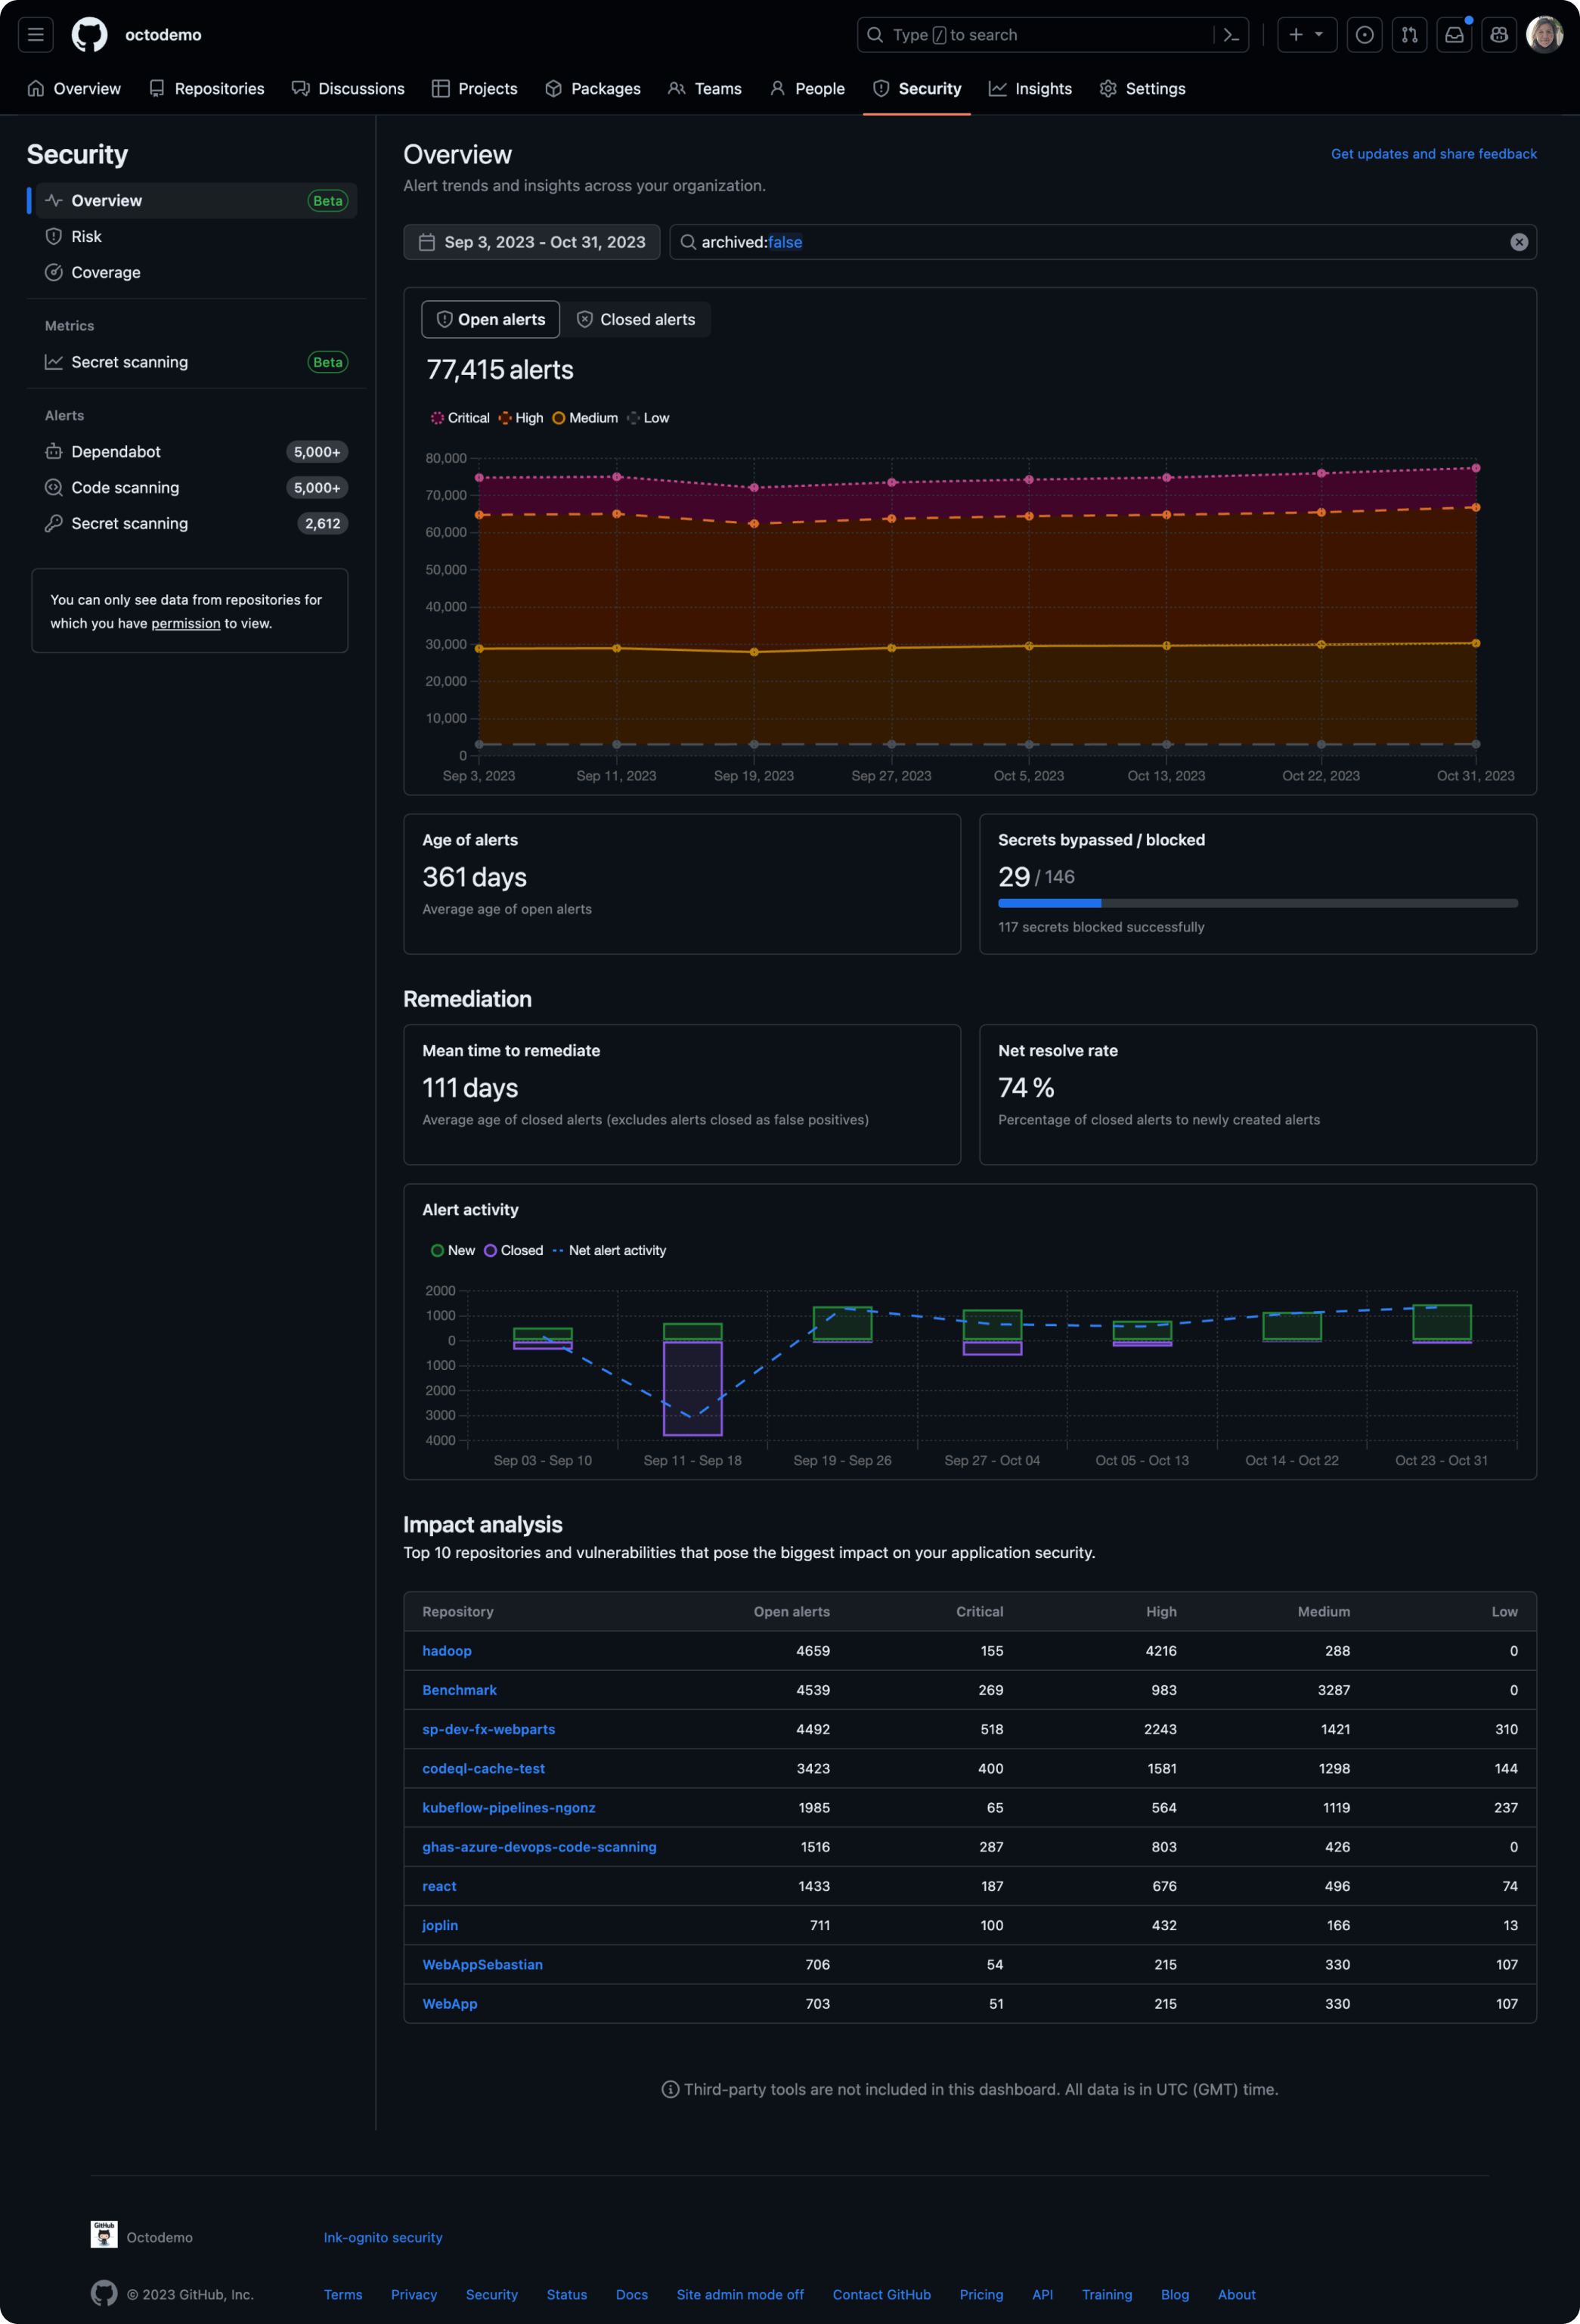
Banner announcing the new overview dashboard states prioritization made simple with security insights

A new asset in security management is now available for GitHub enterprise users. Reinforcing the “shift left” philosophy, this feature is designed to integrate security into the heart of the development lifecycle, empowering your organization to proactively identify and address vulnerabilities.

Key advantages

Historical context

By comparing historical and current data, you can visibly track improvements in your security landscape and demonstrate the value of security investments.

Reporting period drop-down menu for the new overview dashboard

Customized focus

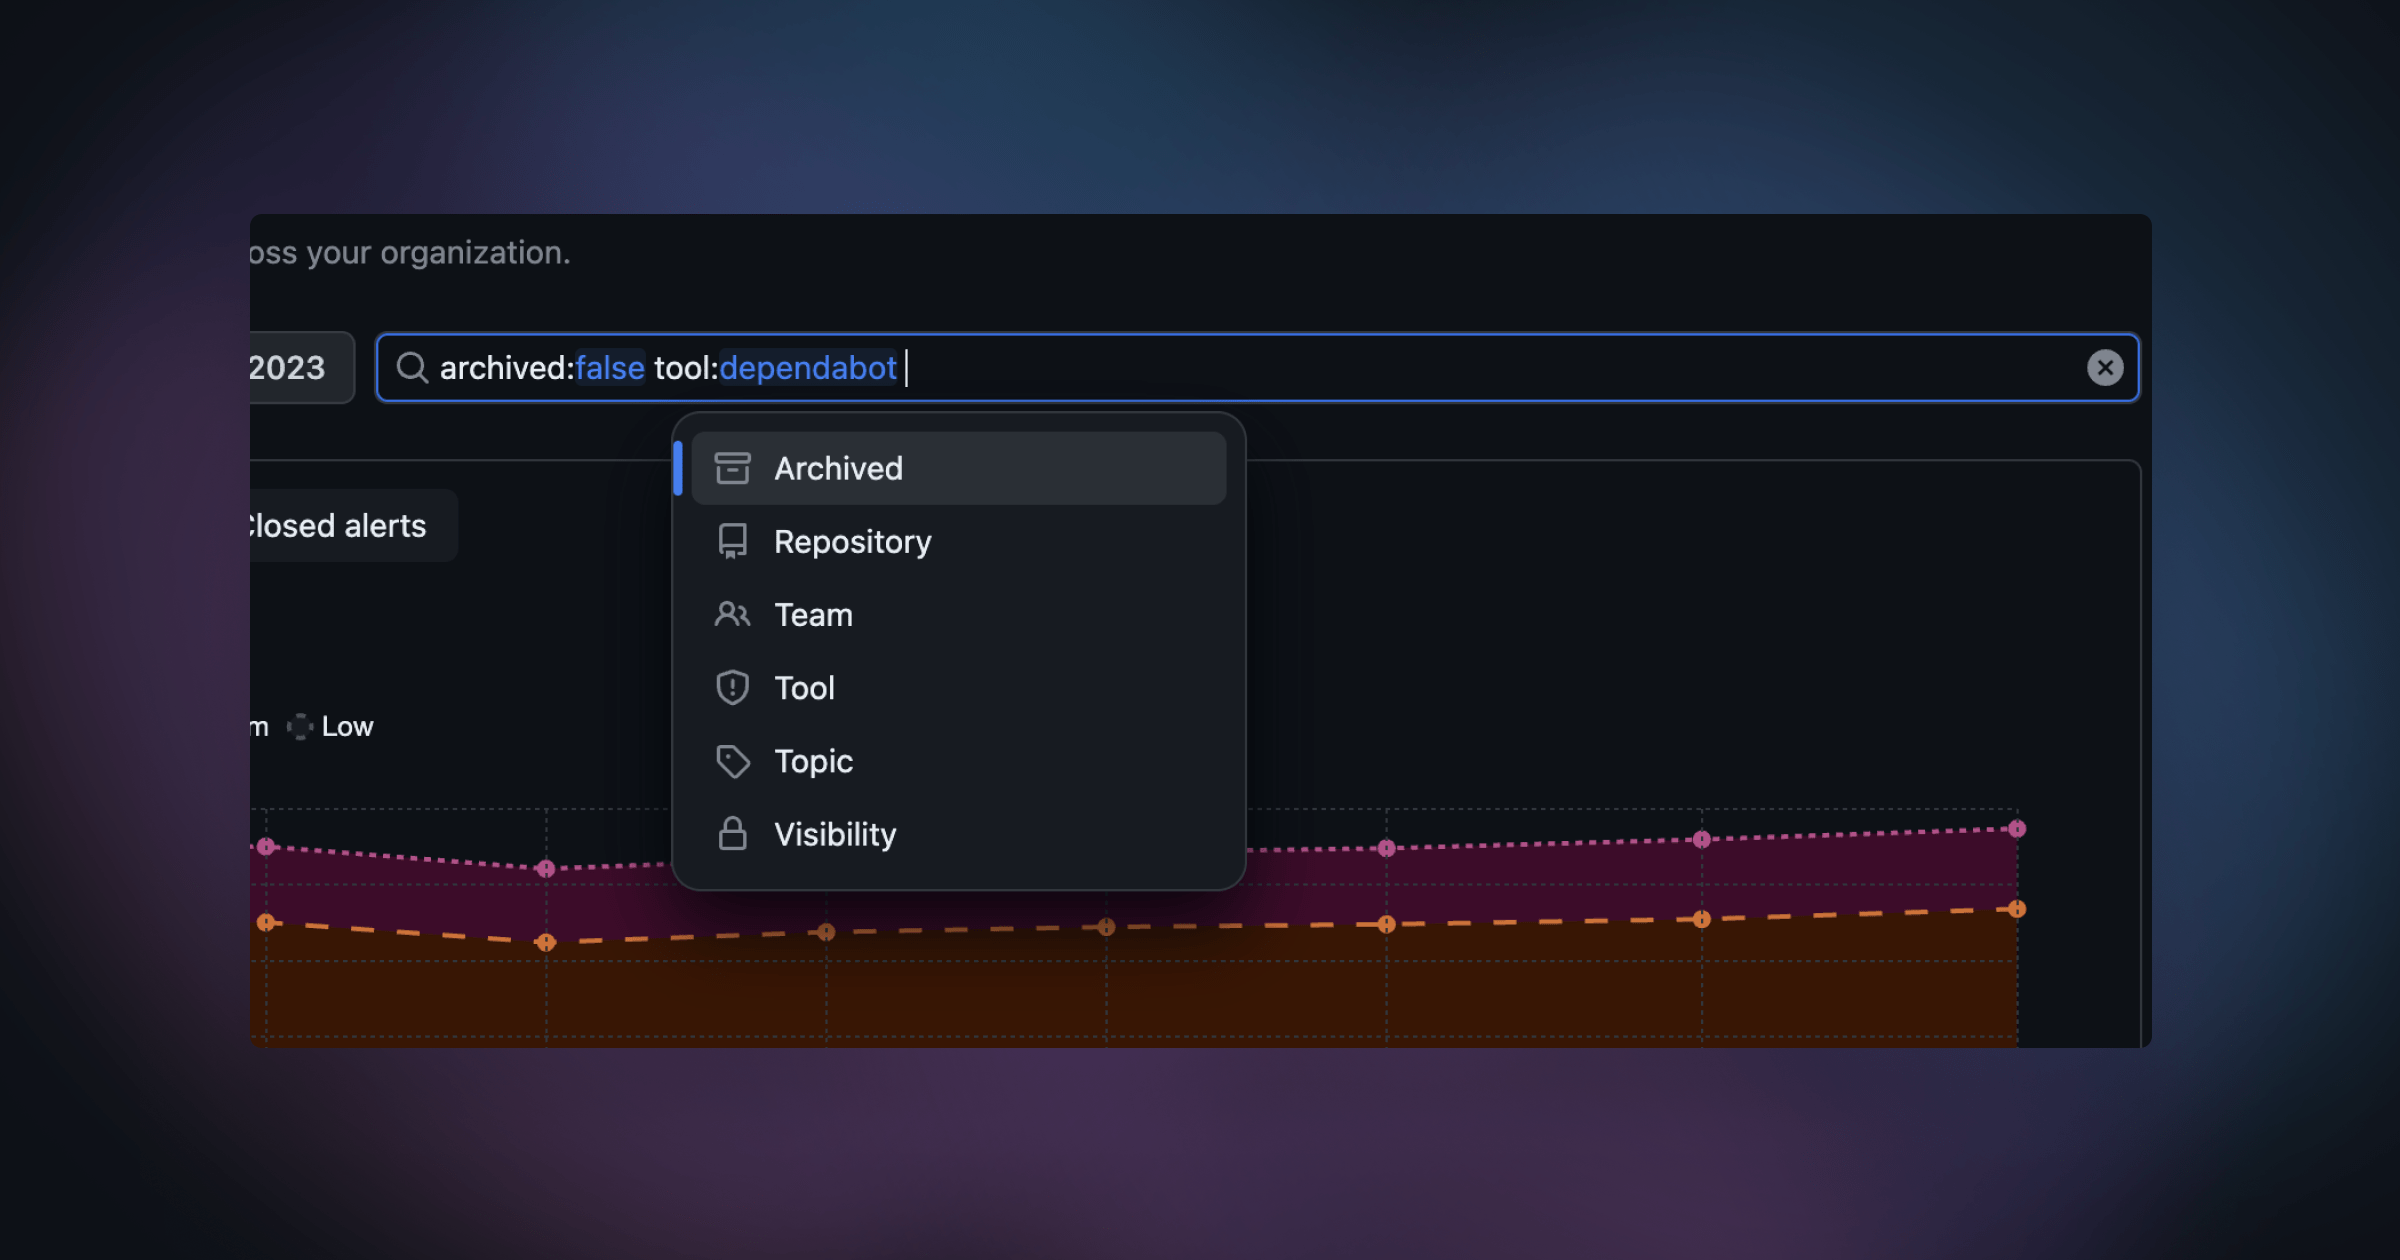
Sharpen your focus with filters that dissect your security data by teams, repositories, or any categorization that aligns with your goals. Whether it’s tracking team performance or monitoring metrics across a core group of repositories with the repository topic filter, there’s a plethora of options available to meet your needs.

Drop-down of filters for the new overview dashboard

Prioritization made simple

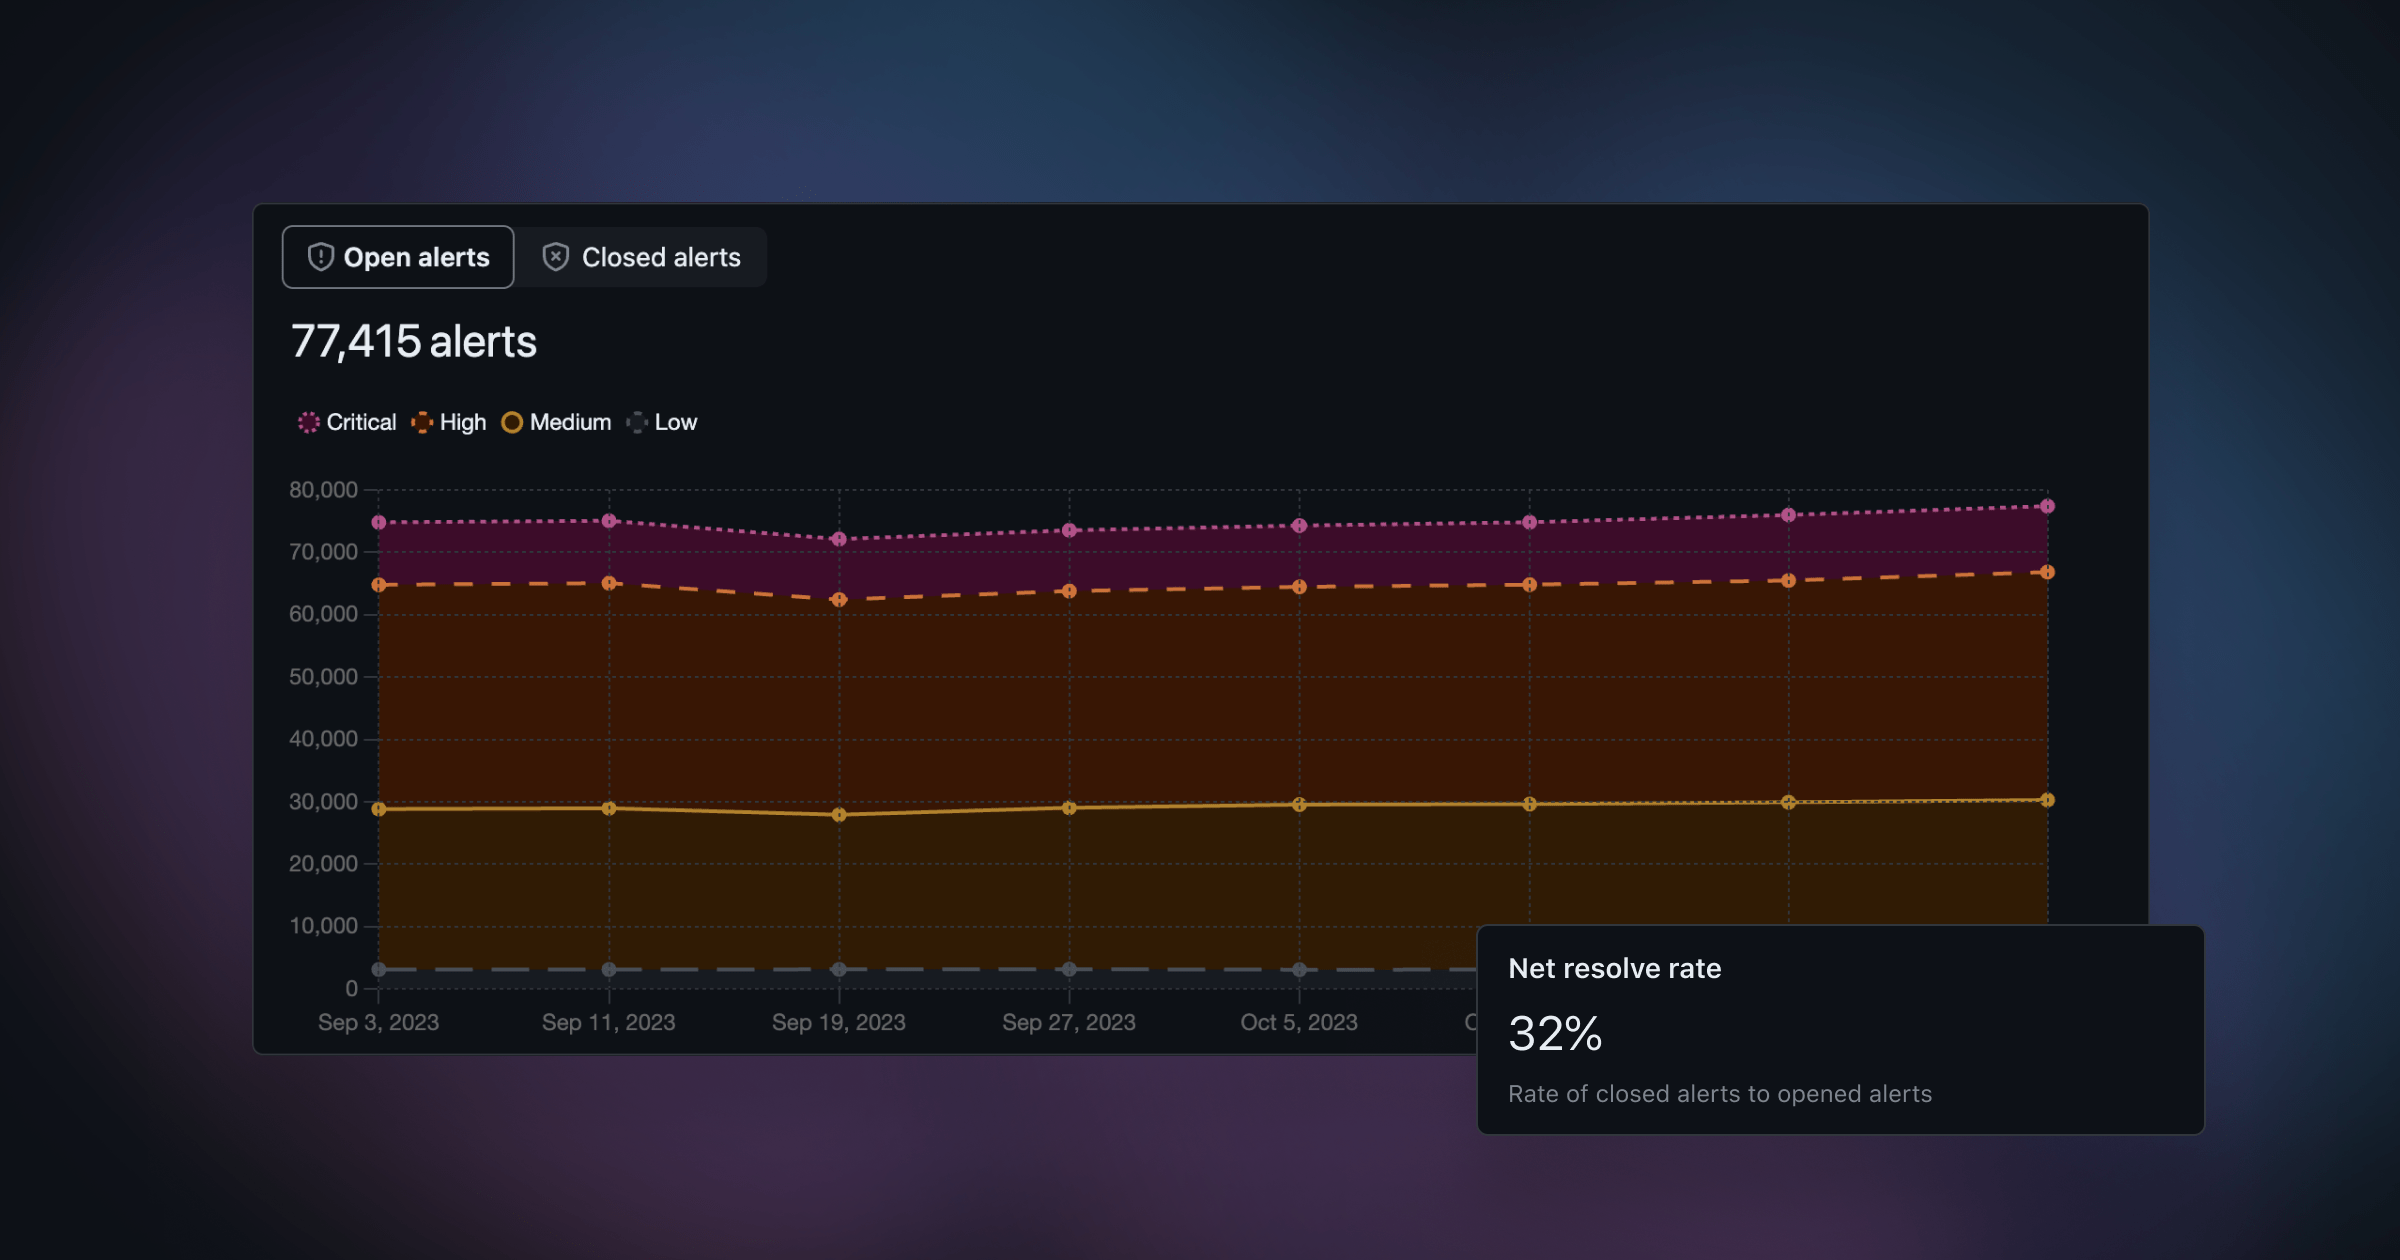
With clear insights into severity and net resolve rate—security’s version of developer velocity—the dashboard shows you if your resources are aligned with the most severe threats and if remediation speed is in harmony with security demands.

Security alerts trends graph grouped by severity and the net resolve rate tile from the new overview dashboard

Strategic alignment

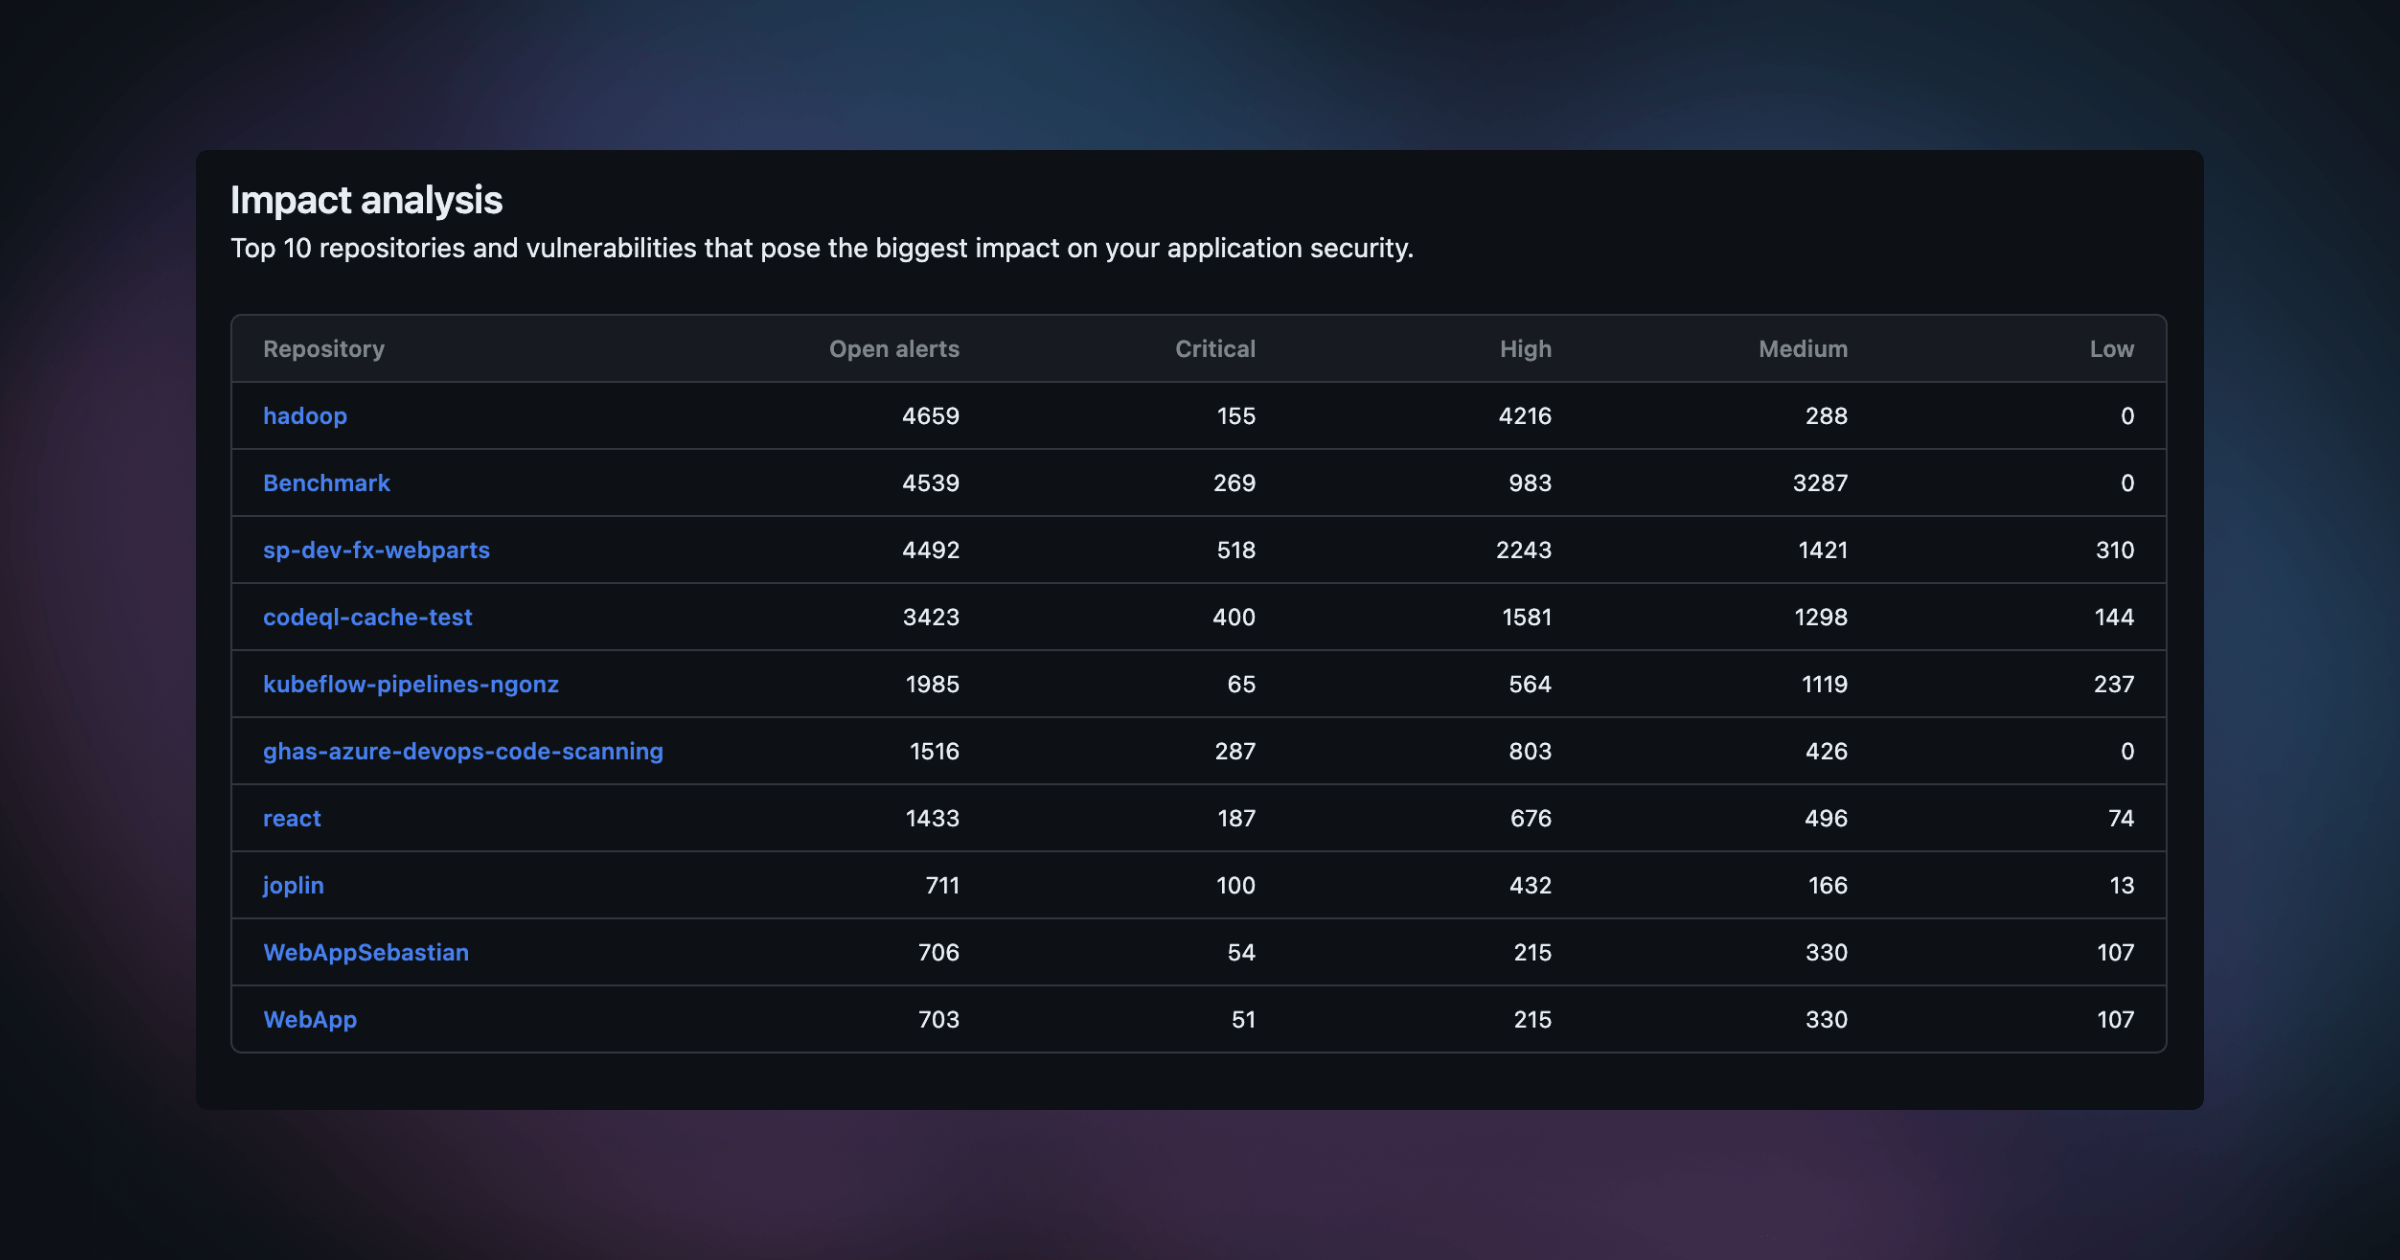
Gain a strategic perspective with the Repositories “Top 10” list, which shows you repositories with the largest number of open alert counts, to understand where to direct your attention first.

Repositories top 10 list from the new overview dashboard

Shift left

The dashboard, which is accessible by everyone in the organization, helps you drive best security practices by understanding potential issues as early as possible, reducing risk and workload down the line.

New overview dashboard

This overview dashboard is now available as a beta on GitHub Enterprise Cloud and will be available in GitHub Enterprise Server 3.13.

Learn more about the new overview dashboard and send us your feedback

See more

We are excited to announce the beta release of Copilot in GitHub Support, a faster way to find answers to your GitHub related questions! In August, we launched the Alpha to a limited number of randomly selected GitHub Enterprise Cloud customers. We have made lots of improvements to the experience since and are excited to welcome more customers into the new experience. Copilot in GitHub Support is now trained on the latest GitHub Enterprise Server documentation in addition to GitHub Enterprise Cloud documentation it was previously trained on.

Initially, we’re offering the Copilot experience to a limited number of randomly selected GitHub Enterprise customers. We hope to continue rolling out the experience to a wider audience over the coming months.

During the beta, GitHub will be reviewing answers provided and collecting feedback from participating customers to improve the accuracy.

Copilot in GitHub Support is part of our ongoing effort to make GitHub the best place for all developers to collaborate, innovate, and ship great software. We believe that Copilot in GitHub Support will enhance your experience and productivity.

We look forward to hearing from you and learning from your feedback.

See more

Support for migrating Jenkins Scripted Pipelines to GitHub Actions is now available as a private beta! If you use Scripted Pipelines in your Jenkins instances, you can now automate the migration of your pipelines to GitHub Actions using GitHub Actions Importer.

To get started, please reach out to your GitHub account manager or contact our sales team! For questions and feedback about the private beta, please visit the GitHub Actions Importer community.

See more

Building upon the success of our organization-level security coverage and risk views, today we’re introducing enterprise-level views to offer enhanced visibility into your enterprise’s security coverage and risk analysis. The refreshed design provides you with an improved user experience with insights and dynamic filtering to maximize your productivity.

Coverage view

The coverage view allows you to gain visibility into the enablement status of security features across all repositories within your enterprise. Within the coverage view, you can:

  • Monitor the counts and percentages of repositories with GitHub security features enabled or disabled, which update when you apply filters.
  • Track enablement for additional security features, including secret scanning push protection, Dependabot security updates, and code scanning pull request alerts.

Enterprise-level security coverage

Risk view

Complementing the coverage view, the new risk view provides a comprehensive overview of all alerts across your enterprise. In the risk view, you can:

  • View the counts and percentages of repositories with security vulnerabilities, which also update when you apply filters.
  • Access open alerts categorized by severity for both Dependabot and code scanning.

Enterprise-level security risk

Both views are now available as a public beta. In the next few weeks, we will deprecate the enterprise-level overview page in favor of these two new views.

Learn more about the new risk and coverage views and send us your feedback

Learn more about GitHub Advanced Security

See more

GitHub Enterprise Cloud customers with enterprise managed users (EMU) can now integrate with Ping Federate as a formally supported SSO and SCIM identity provider in public beta. To get started, download the Ping Federate "GitHub EMU Connector 1.0" from the add-ons tab on the download page, under the "SaaS Connectors" heading. Add the connector to your Ping Federate installation and consult the Ping Federate documentation in addition to GitHub's SAML SSO and SCIM documentation for configuration.

PIC-Square-Logo-Primary

The "GitHub EMU Connector" is maintained and supported by our partner, Ping Identity. Ping additionally maintains their own release notes for this connector.

See more

Bamboo Server and Data Center migrations to GitHub Actions are now in public beta! You can now plan, test, and automate the migration of your Bamboo pipelines to GitHub Actions easily and for free using GitHub Actions Importer.

For details on how to get started, check out our documentation. For questions and feedback about the public beta, please visit the GitHub Actions Importer community.

See more

Starting today, Dependabot will be able to auto-dismiss npm alerts that have limited impact (e.g. long-running tests) or are unlikely to be exploitable. With this ship, Dependabot will cut false positives and reduce alert fatigue substantially.

On-by-default for public repositories, and opt-in for private repositories, this feature will result in 15% of low impact npm alerts being auto-dismissed moving forward – so you can focus on the alerts that matter, without worrying about the ones that don’t.

What’s changing?

When the feature is enabled, Dependabot will auto-dismiss certain types of vulnerabilities that are found in npm dependencies used in development (npm devDependency alerts with scope:development). This feature will help you proactively filter out false positives on development-scoped (non-production or runtime) alerts without compromising on high risk devDependency alerts.

Dependabot alerts auto-dismissal list view

Frequently asked questions

Why is GitHub making this change?

At GitHub, we’ve been thinking deeply about how to responsibly address long-running issues around alert fatigue and false positives. Rather than over-indexing on one criterion like reachability or dependency scope, we believe that a responsibly-designed solution should be able to detect and reason on a rich set of complex, contextual alert metadata.

That’s why, moving forward, we’re releasing a series of ships powered by an underlying, all-new, flexible and powerful alert rules engine. Today’s ship, our first application, leverages GitHub-curated vulnerability patterns to help proactively filter out false positive alerts.

Why auto-dismissal, rather than purely suppressing these alerts?

Auto-dismissing ensures any ignored alerts are 1) able to be reintroduced if alert metadata changes, 2) caught by existing reporting systems and workflows, and 3) extensible as a whole to future rules-based actions, where Dependabot can decision on subsets of alerts and do things like reopen for patch, open a Dependabot pull request, or even auto-merge if very risky.

How does GitHub identify and detect low impact alerts?

Auto-dismissed alerts match GitHub-curated vulnerability patterns. These patterns take into account contextual information about how you’re using the dependency and the level of risk they may pose to your repository. To learn more, see our documentation on covered classes of vulnerabilities.

How will this activity be reported?

Auto-dismissal activity is supported across webhooks, REST, GraphQL, and the audit log for Dependabot alerts. In addition, you can review your closed alert list with the resolution:auto-dismissed filter.

How will this experience look and feel?

Alerts identified as false positives will be automatically dismissed without a notification or new pull request, and appear as special timeline event. As these alerts are closed, you’ll still be able to review any auto-dismissed alerts with the resolution:auto-dismissed filter.

How do I reopen an automatically dismissed alert?

Like any manually dismissed alert, you can reopen an auto-dismissed alert from the alert list view or details page. This specific alert won’t be auto-dismissed again.

What happens if alert metadata changes or advisory information is withdrawn?

Dependabot recognizes and immediately responds to any changes to metadata which void auto-dismissal logic. For example, if you change the dependency scope and the alert no longer meets the criteria to be auto-dismissed, the alert will automatically reopen.

How can I enable or disable the feature?

This feature is on-by-default for public repositories and opt-in for private repositories. Repository admins can opt in or out from your Dependabot alerts settings in the Code Security page.

Is this feature available for enterprise?

Yes! In addition to all free repositories, this feature will ship immediately to GHEC and to GHES in version 3.10.

What’s next?

Next, we’ll expose our underlying engine – which enables Dependabot to perform actions based on a rich set of contextual alert metadata – so you can write your own custom rules to better manage your alerts, too.

How do I learn more?

How do I provide feedback?

Let us know what you think by providing feedback — we’re listening!

See more