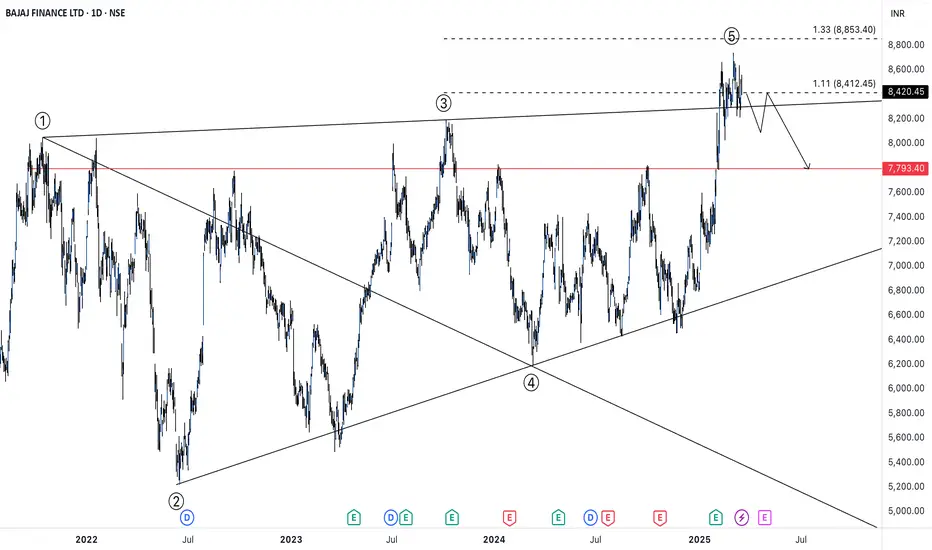
BAJAJ FINANCEIn this entire rally of NIFTY towards the downside since few months, BAJFIN has acted in a defensive way for the time being. But currently a Bearish Wolfe Wave pattern is emerging in the stock indicating that the stock can show a potential downside.
The target remains to be at 7793 once it trades below 8820. There are few reasons to justify the potenial downside.
1. Bearish Wolfe Wave Pattern
2. Exxagerated RSI Divergence pattern
3. Emerging Head and Shoulder pattern
Even though NIFTY is a very low and people hoping for a bottom out soon, the chances of the stock coming down may be fairly less. But who knows even if NIFTY falls by 200 points may be BAJFIN may turn out to be the biggest contributor for the day.
Its advisable to not go long on this stock and short only after confirmation(once it breaks below 8820) for the target of 7793. SL remains to be at 8650 on closing basis.
Chart and Anlysis
Adarsh Kumar Dey
Community ideas
BALKRISIND 1HRSWING TRADE
- EARN WITH ME DAILY 10K-20K -
BALKRISIND Looking good for Downside..
When it break level 2476 and sustain.. it will go Downside...
SELL @ 2476
Target
1st 2430
2nd 2381
FNO
BALKRISIND MAR FUT – LOT 7 (Qty-2100)
BALKRISIND MAR 2580 PE – LOT 7 (Qty-2100)
Enjoy trading traders.. Keep add this STOCK in your watch list..
Big Investor are welcome..
Like this Post??? Hit like button..!!!
Follow me for FREE Educational Post and Alert..

GIFT NIFTY ELLIOTT WAVE COUNT starting from the low of 4TH MARCH 2025 in 1 hour TF, GIFT NIFTY shows clear 5 WAVE IMPULSE and time wise double correction in form of WXY.after completion of correction new impulse is also clearly visible which is 1ST WAVE OF 3RD WAVE. 3RD WAVE can go up to 23500-23800 as per fib extension but for that 22800 is major resistance,and after that 230000 is psychological level of resistance. GAP in.tradingview.com UP OPENING AND SUSTAIN ABOVE THAT LEVEL WILL OPEN MORE UPSIDE LEVELS. CHART PATTERN SHOWS INVERSE HEAD & SHOULDER OR FLAG&POLE PATTERN.

Nicholas Darvas: The Dancer Who Became a Trading Legend!Hello Traders! Imagine going from being a professional dancer to one of the most successful traders of all time! That’s the story of Nicholas Darvas , a self-taught trader who turned $25,000 into $2.25 million in just a few years using his famous Darvas Box Trading Strategy . His journey proves that you don’t need to be a Wall Street expert to make it big in trading! Let’s dive into his trading principles and strategy.
1. Who Was Nicholas Darvas?
Darvas was a professional dancer who stumbled into the stock market while touring the world.
He developed a technical approach to trading , known as the Darvas Box Theory , which helped him ride strong trends and avoid noise.
Without any insider knowledge, he used chart patterns, price momentum, and volume breakouts to make millions in the market.
2. Darvas’ Key Trading Principles
Follow the Trend: Darvas only bought stocks in strong uptrends. He believed in riding momentum rather than predicting reversals.
Ignore Market Noise: He didn’t listen to news, tips, or opinions —only price action and volume mattered to him.
Let Winners Run, Cut Losers Quickly: He never sold his winning stocks early and immediately exited losing trades without hesitation.
Use Stop-Losses & Protect Capital: Darvas always set stop-losses below key levels to avoid deep losses.
Only Trade High-Volume Stocks: He focused on stocks that showed strong volume spikes, as these indicated institutional interest.
3. The Darvas Box Trading Strategy
Identify a Stock in a Strong Uptrend: Darvas looked for stocks that were consistently making new highs with rising volume.
Draw a "Box": He identified support and resistance levels , creating a box around price action.
Buy on Breakout: He entered only when price broke above the box’s resistance level, signaling a continuation of the uptrend.
Set a Stop-Loss: His stop-loss was placed just below the support level of the box.
Sell When the Trend Weakens: If price broke below the lower boundary of the box, he exited immediately.
4. What Traders Can Learn from Darvas
Price Action is King: You don’t need complex indicators— price and volume are enough.
Stick to Strong Stocks: Focus on high-momentum stocks rather than chasing random trades.
Discipline Beats Emotion: Trade with a clear system , don’t rely on market opinions.
Have a Risk Management Plan: Always use stop-losses and protect your capital.
Trend Trading Works: The best profits come from riding big trends—not predicting tops and bottoms.
Conclusion
Nicholas Darvas’ journey from a dancer to a millionaire trader proves that anyone can succeed in the stock market with the right strategy, discipline, and risk management. His box trading strategy is still used by traders today, helping them ride trends and maximize profits while minimizing risk.
Have you tried the Darvas Box strategy? Let’s discuss in the comments!

Stock Analysis: Ashok Leyland LtdIntroduction:
Ashok Leyland is the flagship Company of the Hinduja group, having a long-standing presence in the domestic medium and heavy commercial vehicle (M&HCV) segment.
Fundamentals:
Market Cap: ₹ 57,741 Cr.;
Stock P/E: 20.7 (Ind. P/E: 18.84); 👎
ROCE: 15.0% 👎; ROE: 28.4% 👍;
PEG Ratio: 0.22 👍
3 Years Sales Growth: 33% 👍
3 Years Compounded Profit Growth: 206 % 👍
3 Years Stock Price CAGR: 21% 👍
Technicals:
Ashok Leyland has been in a downtrend since attaining 262 levels in Aug 2024.
The stock price has fallen below all the significant support levels like 20, 50, and 100 EMAs.
Resistance levels: 237, 262
Support levels: 193, 178
Cons:
Promoters have pledged 30.1% of their holding
FII/FPI decreased their shareholding last quarter
Companies with High Debt

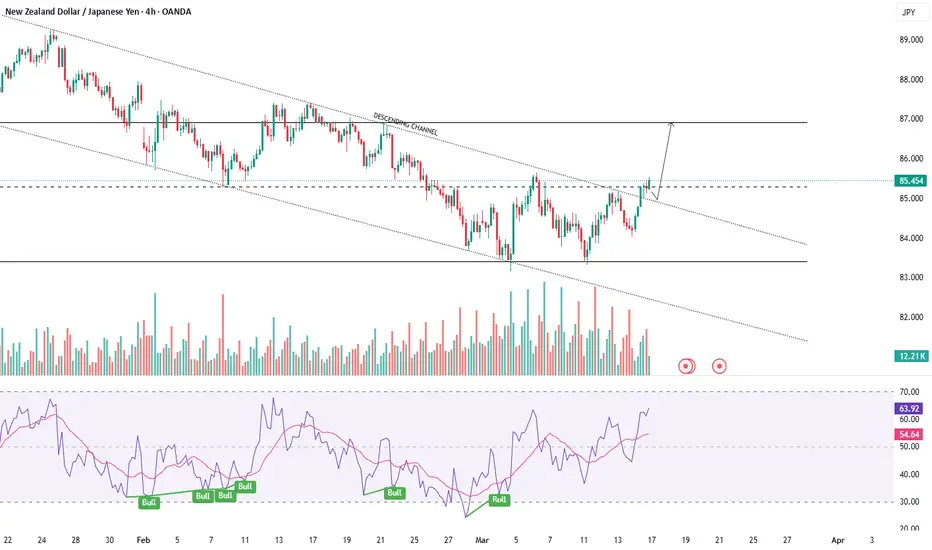
NZDJPY - ATTEMPTING TO REVERSE TRENDSymbol - NZDJPY
CMP - 85.40
NZDJPY currency pair is attempting to reverse its downtrend by breaking through the channel resistance. With the recent strengthening of the U.S. dollar, the pair has strong potential to advance.
From a technical perspective, buyers are gaining momentum and providing market support, as evidenced by the rising local lows, which are progressively leading towards the breakout of the channel resistance. The key level to watch in this scenario is the resistance at 85.24, which is broken & serves as a crucial threshold, separating the market into two distinct zones.
Should the bulls manage to secure a close above 85.24, a short-term rally towards 86.13, and potentially 86.90, may unfold.
Key support levels: 84.50, 84.00
Key resistance levels: 85.24, 86.13, 86.90
Initial testing of the resistance at 85.24 could result in a brief pullback due to liquidity above this level. This pullback may be directed towards the previously broken channel resistance. However, the primary focus remains on a sustained price consolidation above 85.24, as this would confirm that the bulls are maintaining control of the market and are poised for further upward movement.
Dow Jones Industrial AverageThe Dow Jones Industrial Average (DJI) remains below the key Fibonacci resistance at 43,152, signaling continued weakness.
A dip toward the 41,042–40,802 support zone appears likely in the coming days.

BUY TODAY SELL TOMORROW for 5%DON’T HAVE TIME TO MANAGE YOUR TRADES?
- Take BTST trades at 3:25 pm every day
- Try to exit by taking 4-7% profit of each trade
- SL can also be maintained as closing below the low of the breakout candle
Now, why do I prefer BTST over swing trades? The primary reason is that I have observed that 90% of the stocks give most of the movement in just 1-2 days and the rest of the time they either consolidate or fall
Trendline Breakout in NACLIND
BUY TODAY SELL TOMORROW for 5%

GOLD : From Consolidation to Continuation - 3000 In SightGold has made a decisive breakout from its recent consolidation range 2900-30 (major support is now at the green rectangle) which is now establishing itself as major support around $2,920. This area aligns with the previous week's high, creating a strong technical foundation.
Key observations:
Breakout Confirmation: Gold has not only broken above the consolidation range but also cleared the Previous Monthly High (PMH) at approximately 2,960. This level should now act as support on any pullbacks.
Strong Bullish Momentum: The recent price action shows a powerful impulse move with minimal retracement, indicating strong buying pressure and institutional interest.
Order Block Formation: The daily candles preceding the breakout have created a bullish order block that should provide support if tested.
Market Structure Shift: The higher highs and higher lows confirm a bullish market structure, with the previous resistance levels now expected to act as support.
Target Projection: Based on the breakout momentum and channel projection (shown by blue arrows), the 3,000 psychological level appears to be the immediate target, with potential for extension toward 3,050-3100 if momentum continues.

Fair Value Gaps (FVG): The Secret to Smart Money Trading!
Hello Traders! Have you ever noticed sudden price movements leaving behind gaps in the chart ? These are known as Fair Value Gaps (FVGs) —a concept used by smart money traders to identify price imbalances, liquidity zones, and high-probability trade setups. Today, let’s break down how to trade price imbalances & FVGs like a pro!
1. What is a Fair Value Gap (FVG)?
Fair Value Gaps (FVGs) occur when the market moves aggressively in one direction, leaving a three-candle price gap with no opposing orders filled.
FVGs represent areas where institutional traders may re-enter the market to balance liquidity.
These gaps often act as magnetic zones, meaning price tends to fill the gap before continuing the trend.
2. How to Identify an FVG on the Chart?
Look for a strong impulse move (big bullish or bearish candle).
The gap is formed when the low of the first candle and high of the third candle do not overlap.
Mark the area between the first and third candle, as this is the Fair Value Gap zone.
Price is likely to retrace back into the gap before resuming its trend.
3. How to Trade Price Imbalances & FVGs?
Entry Strategy: Wait for price to retrace into the FVG zone. Enter a trade when price shows bullish or bearish confirmation.
Confirmation with Indicators: Combine FVGs with order blocks, liquidity zones, or moving averages for extra confluence.
Stop-Loss Placement: Set your stop-loss below the gap (for buys) or above the gap (for sells).
Profit Targets: Aim for the next liquidity zone, resistance, or trend continuation level.
Watch for Fakeouts: Sometimes, price partially fills the gap before reversing, so wait for strong confirmation before entering.
4. Examples of FVGs in Different Market Conditions
Bullish FVG: If price breaks out aggressively and leaves a gap, it often retraces to fill the FVG before continuing upward.
Bearish FVG: A strong downside move creates a gap, and price retraces to fill the imbalance before resuming its downtrend.
FVGs in Forex & Crypto: These gaps occur across all markets—stocks, forex, and crypto—and can be used for high-probability setups.
5. Risk Management & Key Considerations
Don’t trade every FVG blindly! Wait for confirmation before entering a position.
Use FVGs in confluence with market structure, such as higher highs/lows or order blocks.
Avoid trading FVGs in choppy markets, as liquidity imbalances are less reliable in sideways price action.
Always manage risk! Even high-probability setups can fail, so use proper stop-loss placement and risk-reward ratios.
Conclusion
Fair Value Gaps (FVGs) offer high-probability trading opportunities by helping traders identify liquidity imbalances and institutional moves. By understanding and applying FVG strategies, you can improve your trade entries, risk management, and overall profitability!
Have you used Fair Value Gaps in your trading? Let’s discuss in the comments!

ready to fire missile BDLTechnical Analysis Report
Stock Overview
Stock Name: Bharat Dynamics Ltd.
Exchange: NSE (National Stock Exchange of India)
Current Price: ₹1,108.25
Chart Timeframe: Weekly (1W)
Company Business Profile: Bharat Dynamics Ltd. is a public sector enterprise under the Ministry of Defence, specializing in the production of ammunition and missile systems. It plays a pivotal role in India's defense sector, contributing to national security and defense exports.
Candlestick Pattern Analysis
The chart highlights a bullish engulfing pattern at a key support level, suggesting a potential reversal to an uptrend.
A bearish engulfing pattern is visible near a resistance level, indicating a possible trend reversal to the downside.
Key Levels
Support Levels (Yellow Zone): ₹737.75, ₹850.70, ₹963.70
Swing Zone (Green Zone): ₹1,103.50, ₹1,224.21
Target Levels (T): ₹1,403.70, ₹1,721.00, ₹1,946.95, ₹2,234.70, ₹3,065.70
Technical Indicators
RSI (Relative Strength Index): Currently at 47.30, indicating a neutral position. RSI values between 30 and 70 suggest the stock is neither overbought nor oversold.
Volume: The volume chart shows significant spikes during the uptrend, reflecting strong buying interest.
MA (Moving Average): The 50-week Simple Moving Average (SMA) is at ₹1,224.21. The price is currently below this SMA, indicating a potential bearish trend.
Volume Trends
Volume Spikes: Notable during the uptrend phase, confirming strong buying momentum.
Volume Declines: Observed during the correction phase, indicating reduced trading activity.
Dividend Information
Ex-Date: February 14, 2025
Dividend Amount: ₹4.00 per share
Payment Date: March 8, 2025
Sector and Market Context
Bharat Dynamics Ltd. operates in the defense sector, which is influenced by government policies, defense budgets, and geopolitical factors. The stock has shown strong bullish momentum recently, aligning with the sector's growth trajectory and increased defense spending globally.
Risk Considerations
Government Policies: Changes in defense budgets or policies could impact the company's revenue.
Geopolitical Risks: Tensions or conflicts may affect operations or investor sentiment.
Market Conditions: Economic downturns or shifts in sectoral focus could influence stock performance.
Analysis Summary
Bharat Dynamics Ltd. exhibits a strong technical setup with clear support and resistance levels. The RSI indicates a neutral stance, while volume trends highlight significant buying interest during the uptrend. The stock's performance is closely tied to the defense sector's dynamics and broader market trends. Investors should consider potential risks, including policy changes and geopolitical factors, before making decisions.

BTC AT CRITICAL LEVEL – BREAKOUT OR PULLBACK?🚀 BTC/USD – KEY BREAKOUT LEVELS AHEAD!
📌 Market Overview
Bitcoin (BTC/USD) is currently trading around $84,593, rebounding strongly from support. The price is approaching a major resistance zone at $87,049 - $89,748, where a crucial reaction is expected.
Overall sentiment remains influenced by market psychology, institutional activity, and macroeconomic factors. BTC is still trading within a descending wedge pattern, signaling that the corrective phase is not over unless a breakout occurs.
📈 Technical Analysis – Key Levels to Watch
🔹 Major Resistance Levels:
🔺 $87,049 - $89,748: A strong supply zone; a breakout here could trigger a bullish move toward $92,000+.
🔺 $90,005 - $92,000: The next target if BTC successfully clears resistance.
🔻 Major Support Levels:
🔹 $82,000 - $80,000: A short-term support zone where buyers might step in.
🔹 $78,935 - $78,000: A critical support area—losing this level could lead to a sharp sell-off.
📌 Key Observations:
If BTC fails to break $87,000, a retracement toward $80,000 - $78,000 is likely.
A confirmed breakout above $87,000 - $89,000 could signal further upside momentum toward $92,000 or higher.
🌍 Fundamental Analysis – What’s Driving BTC?
🔥 1. Institutional Demand & Market Sentiment
Market sentiment remains positive, but BTC needs stronger institutional buying to sustain further gains.
On-chain data indicates whales are accumulating BTC at lower price ranges, but resistance remains strong at $87,000.
Bitcoin ETFs are seeing steady inflows, providing fundamental support for long-term bullish momentum.
📊 2. Macroeconomic Factors & USD Impact
The DXY (US Dollar Index) is weakening, which is generally bullish for BTC.
The Federal Reserve’s monetary policy remains a key factor—interest rates are expected to stay high until mid-2025, which could slow BTC’s momentum.
Recent CPI and PPI data indicate persistent inflation concerns in the US, boosting demand for BTC as a hedge.
💰 3. Whale Activity & Institutional Moves
On-chain data reveals significant BTC withdrawals from exchanges, signaling long-term accumulation.
If large buyers continue accumulating, BTC could push above $90,000.
However, if whales take profits near resistance, BTC may retrace toward $80,000 - $78,000 before another move higher.
⚡ Trading Scenarios
✅ Scenario 1: Bullish Breakout Above $87,000
If BTC closes above $87,000 with strong volume, expect a rally toward $90,000 - $92,000.
A further push could target $95,000 if bullish momentum sustains.
❌ Scenario 2: Rejection at $87,000 - $89,000
If BTC faces resistance, expect a pullback toward $82,000 - $80,000.
A deeper correction could test $78,000, where strong support lies.
📢 Conclusion – Watch for a Critical Breakout!
📌 BTC is testing a major resistance zone ($87,000 - $89,000)—a breakout could fuel further upside.
📌 Market sentiment remains positive, but a rejection could trigger a pullback toward $80,000 - $78,000.
📌 Monitor Fed policies, institutional activity, and on-chain trends for better trade positioning.
📌 Traders should wait for confirmation before committing to a breakout or short position.
💬 Do you think BTC will break above $87,000, or is a deeper pullback coming? Share your views below! 🚀🔥

Bearish Trend FormingUSD/JPY has just broken below the 34-EMA and is testing the support zone around 147.70. The pair is showing signs of forming a small head and shoulders pattern, with a neckline at 147.70 - 147.50. If this level is broken, USD/JPY is likely to continue falling to 147.00, or even deeper to 146.50.
Fundamentals are also supporting the bearish trend. US bond yields have weakened after the market expected the Fed to cut interest rates this year. Meanwhile, the BoJ could raise interest rates in April, which would strengthen the JPY.
If USD/JPY fails to rebound above 148.00, the sellers will continue to control the market. The short-term trend is tilted to the downside, with the nearest target at 147.00.

Gold Holds Near Record Highs Amid Market UncertaintyHello everyone, how was your trading last week? Let’s dive into today’s gold price analysis together.
Gold is closing out the trading week, maintaining its momentum near recent record highs. The precious metal is currently priced at $2,985, with its highest recorded trade reaching $3,005.
Gold’s rally remains strong, fueled by concerns over President Donald Trump’s tariff policies and the recent stock market sell-off. The ongoing global trade war has shaken financial markets, increasing recession fears and contributing to gold’s record-breaking surge.
Looking ahead, a combination of strong central bank buying, robust investment demand, and expectations of Federal Reserve monetary easing is likely to keep gold’s bullish momentum intact throughout the year.

Holi Special: The Colors of Trading – Lessons from the Markets!
Hello Traders! Wishing you all a very Happy Holi! 🎉 Just like Holi brings a burst of colors , the stock market is also full of different shades of opportunities, risks, and rewards! Every trade we take paints a story—sometimes green (profits), sometimes red (losses), but always a lesson!
Lessons Traders Can Learn from Holi!
Green & Red – The Colors of Trading!
• Just like Holi is incomplete without colors, trading is incomplete without ups and downs.
• Green candles bring profits, but even red candles bring valuable lessons.
Patience Creates the Best Picture!
• In Holi, you don’t throw all colors at once—you take your time to enjoy the festival.
• Similarly, in trading, patience and discipline lead to the best results.
Don't Chase the Color – Plan Your Moves!
• Just as you plan your Holi celebrations, plan your trades.
• Avoid impulsive entries, wait for the right setup, and trade with a strategy!
Protect Yourself – Just Like You Do in Holi!
• In Holi, we apply oil to protect our skin. In trading, we use stop-losses to protect our capital!
• Risk management is key to long-term success!
Enjoy the Process – Every Trade Adds to Experience!
• Some colors take time to settle, just like profits in long-term trades.
• Every trade—win or lose—adds to your experience.
Conclusion
Just like Holi fills life with colors, the market fills our journey with experiences, emotions, and opportunities! Keep your risk in control, enjoy the process, and let your trades create a masterpiece!
What’s your favorite Holi & Trading lesson? Let’s celebrate in the comments! 🎉

INTERGLOBE AVIATION – Elliot & Harmonic Pattern TargetsElliot Wave reading-
Indigo, has been range bound for last 6 months from a level of 5038, where wave-3 was completed, and then corrective wave -4 completed at 3960 levels.
Wave-1 completed at 2745.10
Wave-2 Completed at 2333.35
Motive wave-5 is in formation, Probable Targets of wave-5 as per Elliot wave are:
• 0.618 extension of wave -1 @ 4626 (which has already breached)
• Wave-5 may travel same distance as wave-1 @ 5038
Harmonic Pattern Reading:
Butterfly wave pattern (XABCD)was in formation, The 0.786 (actual 0.764) retracement of the XA leg is the most important ratio and gives the confirmation of Pattern. Which gives us point B at 4739 level.
The Multiple Potential Possible PRZ ( Point D) are
• 1.618 Retracement of BC at 5232.5
• 2.618 Retracement of BC at 6026.33
Strategy for Agressive Traders
Option-1: Entry @ Confirm Breakout: Closing above 4800;
Stop Loss: Closing below 4730
Target -1: 5035 (As per Elliot); Book 25% profit
Target-2: 5235.5 (as per harmonic pattern) book profit
Aggressive traders can carry forward 25% of position, with trailing stop loss (low of previous day) for a target of 6026.33
Option- 2:
• Entry at 4371-4400
• Stop Loss: 4167
• Target-1: 4739
• Target-2: 5035
✅For More Trading Ideas, LIKE SHARE & FOLLOW My Idea Stream✅

New ATH 3000$, witnessing a new era🔔🔔🔔 Gold news:
➡️ Meanwhile, optimistic remarks from the US-Canada trade negotiations, combined with reports that enough Democratic votes are secured to prevent a US government shutdown, have lifted investor confidence. This is reflected in the generally positive sentiment across equity markets.
Additionally, continued US Dollar (USD) buying for the third consecutive day has limited traders from making new bullish bets on Gold. However, the overall fundamental outlook still favors an upward trajectory for XAU/USD.
Personal analysis:
➡️ FOMO created a new ATH today is very large, the buying volume is overwhelming, waiting for ATH 3000 today
Plan:
🔆Price Zone Setup:
👉Sell Gold 3007 – 3010
❌SL: 3015 |
✅TP: 3000 - 2995 - 2980
FM wishes you a successful trading day 💰💰💰

xagusd double bottom with divergenceXAGUSD create double bottom with morning diji star with rsi divergence if it goes and susstain above nechline then superb bull run can seen.
buy xagusd above 29.88 add more 29 closing sl below 28.75 tg 31.9-33.78

GOLD XAUUSD ANALYSIS FROM MARCH 2025 TO MARCH 2026this is TA of gold xauusd code from march 2025 to march 2026. This is just my analysis, dont know the chart will follow the plan or not. Using with your risk. DYOR

EUR/USD - Uptrend Remains, But Needs Careful AdjustmentLooking at the 4H chart, I see EUR/USD moving within a fairly clear uptrend channel. The price is currently testing the lower support line of the channel, around 1.0840.
Two possible scenarios:
Rebound from support: If the price bounces from here, EUR/USD could return to the middle of the channel (around 1.0900), even challenging the upper resistance of the channel (1.0950 - 1.1000).
Breaking the uptrend channel: If the price breaks down from this support line, EUR/USD could fall to EMA 34 (1.0800) or further to EMA 89 (1.0750).
EMA 34 and 89 are still sloping up, indicating that the uptrend is still in place, but the momentum is slowing down. If I buy, I will wait for confirmation of a bounce at support instead of entering immediately. If the price breaks the channel, I will consider selling down to deeper support levels.
The immediate target is still 1.0900, but need to watch the price reaction in this area!

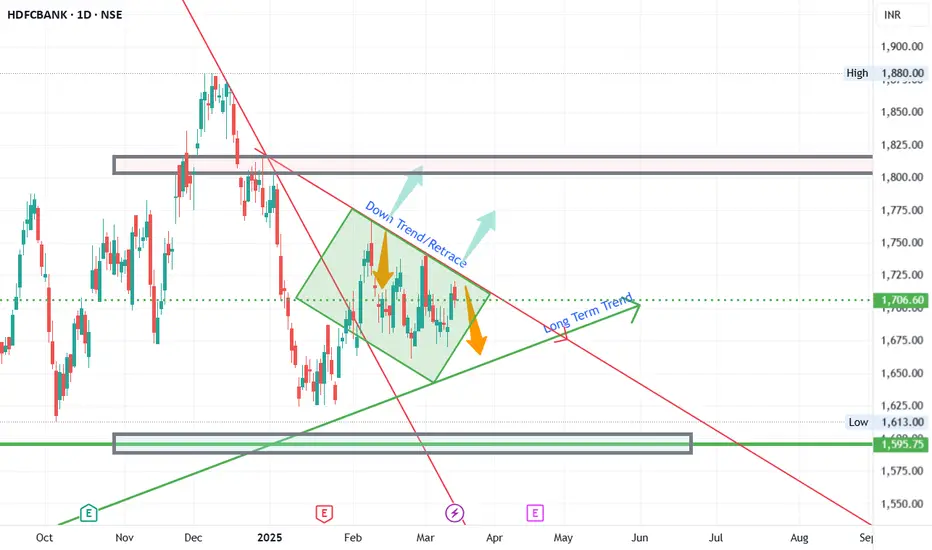
HDFC Bank - Long Term AnalysisFundamentals/Basis:
HDFC Bank is an important scrip that need to be monitored on long term basis, if we invest or not.
This is due to the fact, as a leader in the banking industry and a heavy weight company in the Nifty and bank nifty constituencies, HDFC bank provides clues to the overall market direction (most of the times)
This analysis is for Long term and if time permits, will keep updating throughout the year.
Technicals :
HDFC bank fell from its highs since end of 24 until jan. And had a retracement until approximately 1770 and formed a retracement trend direction.
Current range : 1600 to 1800 with 1700s as pivots.(Not formula but based on charts)
Trade Ideas :
If the price moves above the retracement line and sustains, go for long in the stock. Once it breaks lookout for confirmation at this trendline and also at the Long term trendlines for any retests.
Alternatively, if the price falls below the Long term trend direction, wait for confirmation on the bullishness.
Disclaimer : All the views and analysis provided are my personal analysis. Not a SEBI registered analyst. Plan and trade as per your analysis
If you Like the Analysis and agree with , Hit the Boost button and share your views agreements/constructive feedback in the comments.
Would you like me provide any of your favorite stocks analysis, let me know in the comment.
Xauusd is bulish next target 3026,be ready for upward
Stoploss everytime in system not in mind….look as a probable …take trade on probability not certanity…xauusd htf bias are upward…

USDJPY - POTENTIAL REVERSAL FROM KEY SUPPORT LEVELSSymbol - USDJPY
CMP - 147.82
Following a significant decline in USDJPY, The price is approaching a strong support zone which is held since July 2024. The fundamental environment has been volatile recently, with a predominant influence from Trump's tariffs & US economic factors. Given the recent price action near support zone 148.00 - 147.00, there is a possibility that the pair could rebound from this level. The market’s current hesitation near this support zone suggests that the bulls may be preparing to defend this area.
The aggressive sell-off in US dollar, while exerting downward pressure, is also at oversold levels & creating a scenario where a potential reversal could take place, supported by the decline of Japanese Yen. Should the price manage to hold above the 147.20 support, it could signal the reversal.
From a technical perspective, there are two potential triggers on the chart: one signaling a buy and the other signaling a sell. However, given the prevailing global and local forex trends, the preference is to take a long position.
Resistance levels: 148.85, 150.00
Support levels: 147.25, 146.90
At present, the market is in a downtrend, with potential for a counter-trend correction. The direction of the price will depend on the US dollar's performance and upcoming economic news. If the outcome is favorable, the price could potentially reach to 150.00 & 152.15 levels.
