SATIA trade ideas
BULLISH VIEW ON SATIAHuge momentum is expected in SATIA. Keep it on your watchlist.
Be sure to buy it at an average price. If you buy, please follow risk management & maintain appropriate position sizing.
Disclaimer: This post is for educational purposes and not a recommendation. The analysis posted here is just our view.
SATIA INDUSTRIES, Fast growing but still Undervalued Paper stockSATIA Industries is looking good on weekly chart...
CMP 145..
Chart attached shows good position building..
Its a weekly chart and candle is not closed, So I am kind of preempting further move.
SL below 131 DCB for short term trade, and 114 for positional/medium term trade.
Fundamentals are very good for this company and hugely undervalued.
CWIP+Just completed expansion will contribute to more than 20% in next year's revenue...
PE is just 6 and intrinsic value of more than 360 as per screener.in
P.S. :- I am not SEBI registered analyst,
This post is for educational purpose only.
DYOR or consult your financial advisor before taking any action on this post.
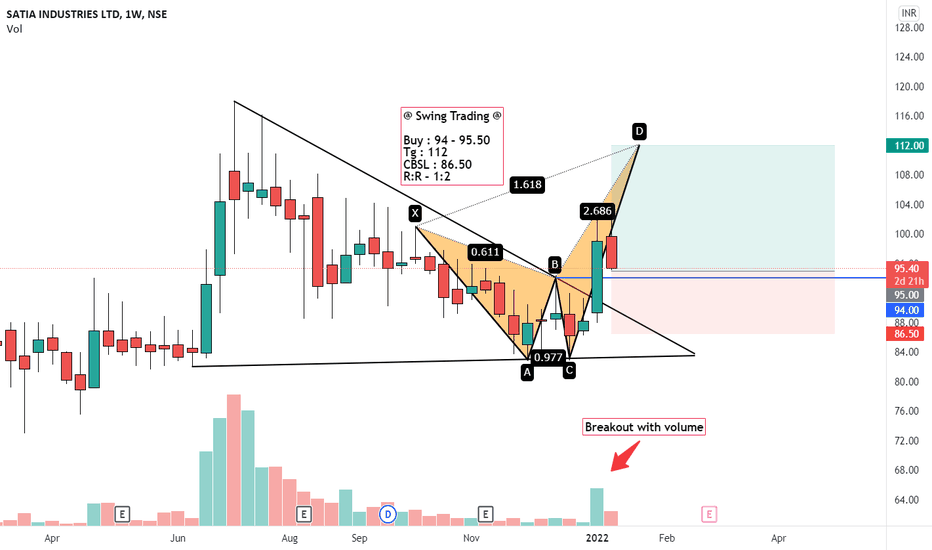
SATIA looks attractive, Bullish Harmonic Pattern ActiveWeekend Pick 1: SATIA
Fundamentals : Strong, Consistent growth on Sales, Profits and EPS. Increasing Reserves vs reducing debt. FII holding increased significantly..
Technicals : Bullish Harmonic pattern active + strong reversal indication with high volume..
R 1: 160
R 2: 180
R 3: 200
S : 110
Satia industries- on the verge of breakout... Satia industries- on the verge of breakout... Of symetrical trai angle on D-W-M chart with good volume.. Rsi, dmi & adx are positive...
Fii had increased their stake by 3% in sep 23 qtr.... Roc, roce, peg ratio is in favourable. Dividend paying co. It's a paper manufacturing company in Punjab & good clientele base. Last 3 years fundamentals are strong likes sales, gross profit, net profit etc...
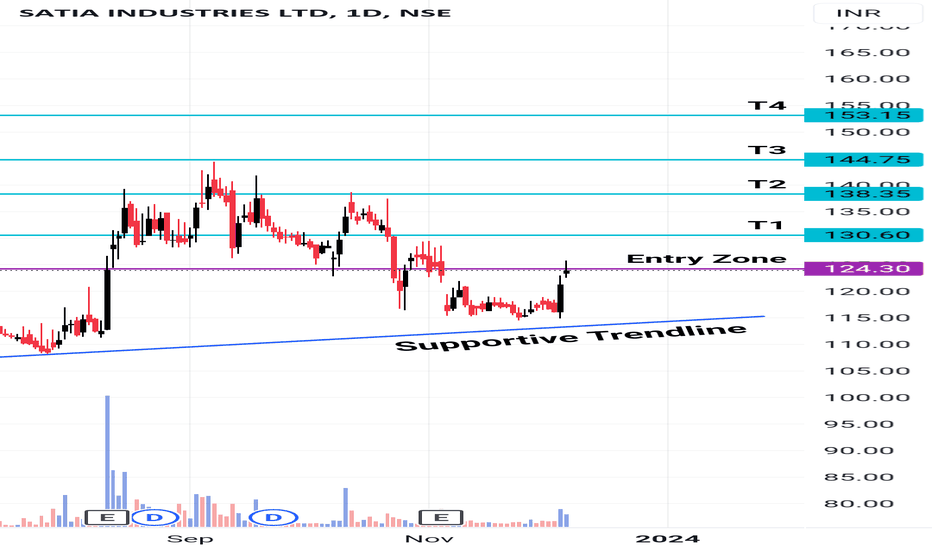
Buy above 140 ( breakout level)
Sl 114
Tgt 160-175-200-215 ( holding 3-12 months as per your tgt)
SATIA INDUSTRIESBuy : 94 – 95.50
Tg : 112
CBSL : 86.50
R:R – 1:2
This is not an investment advice and also please note this is only for education purpose.
So before investing any single rupee, please do your own research according to your risk taking capacity and after that do invest and book profits on right time.
SATIA --- moving towards 175 in coming monthsNSE:SATIA
can move towards 175 in coming months
gave breakout on weekly timeframe around 124 with above average volume
cmp is 137
This analysis is being done for educational and knowledge-sharing purposes.
This article does not offer any kind of buy or sell advice.
All stocks are positional and are held for a short to medium period of time.
Everyone is expected to conduct their own research and analysis to determine whether my point of view aligns with yours.
Swing Trade Buy Satia Industries LtdAs per Swing Trading Strategy and technical Analysis Satia Industries Ltd Looks Bullish.
It will try to take support Near 106-105 Level. this is good stock to accumulate at this level.
as well as stock had created Flag Pattern it means it will hold this level and it wlll consolidate between 103-105 Level.
Buy near 105-106, Stop Loss 90, target 125,135
Time Frame 90-100 Days
Only For Educational information
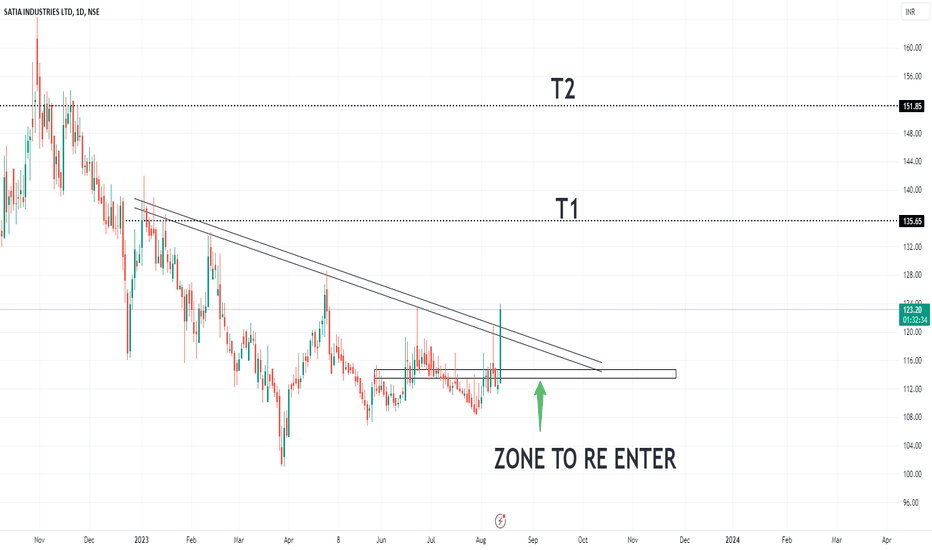
SatiaEntry-115
SL-105
TGT-140
*Entry Tips*
*Aggressive traders can consider buying above the high of the breakout candle.
*Safe traders wait for a retest of the breakout level and then enter a buy position.
*Aggressive traders will have big Stop-loss with small Target.
*Safe traders will have Small Stop-loss with Big Target.
*Don’t Rush to enter the Trade.
*Disclaimer*
This analysis is for educational purposes only, and I am not a SEBI registered analyst. Please conduct your own research and consult with a certified financial professional before making any investment decisions.
*Support Required*
If you found this analysis helpful, kindly like and share your thoughts in the comments. Your feedback and observations are invaluable to me.
Thank you for your continuous support, likes, follows, and comments. Your encouragement keeps me motivated to consistently provide valuable insights.
Trend Analysis, Chart Patterns,Candlestick Analysis,Price Action,
Technical Indicators,Support and Resistance, Supply and Demand,Trendline,200EMA,Swing Trade,Positional Trade,
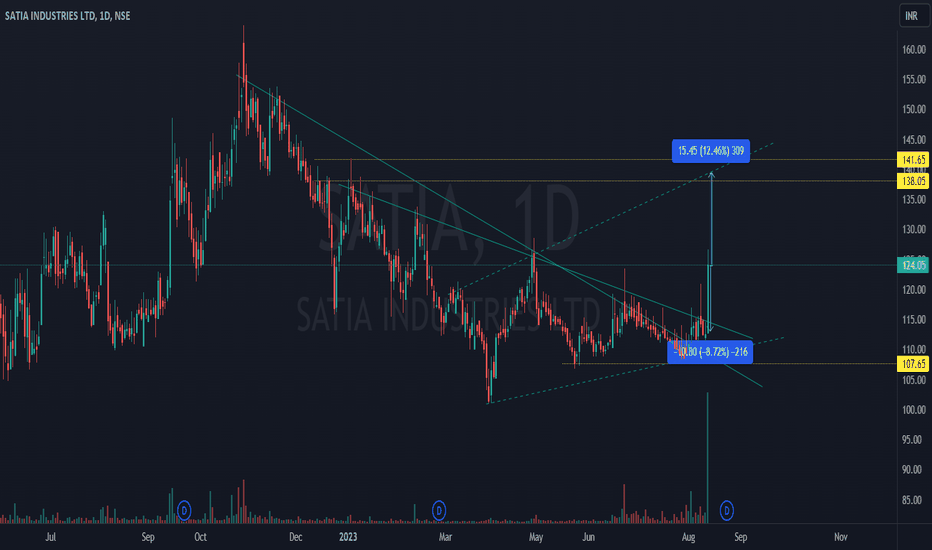
Satia Industries: Falling trendline breakoutSatia Industries is attempting breakout of falling trendline. Recently company has announced all time high revenue & PAT which is almost double from last financial year. Promoter has also buying the shares from open market. Keep on radar. A big re rating is possible if performance continue for next 4 quarters.


