
| Proceedings of a Workshop—in Brief |
Use of Meta-Analyses in Nutrition Research and Policy: Best Practices of Conducting Meta-Analysis
Proceedings of a Workshop—in Brief
In September and October 2023, the National Academies of Sciences, Engineering, and Medicine (the National Academies) Food and Nutrition Board held a three-part virtual workshop series to discuss best practices for conducting meta-analyses (MAs) in nutrition research and utilizing MAs to inform policy. The three-part series, entitled Use of Meta-Analyses in Nutrition Research and Policy: A Workshop Series, explored the evidence on methods for conducting, interpreting, and integrating the results of MA for use in nutrition research, developing nutrition policy, and informing nutrition regulatory decision-making. The workshop series was sponsored by the U.S. Food and Drug Administration (FDA) and featured invited presentations and discussions with researchers, government officials, and other global leaders in nutrition research and policy.
The first workshop in the series, held on September 19, 2023, focused on best practices for planning systematic reviews (SRs) and MAs for nutrition research. This initial workshop included opening remarks from two speakers from FDA about the critical importance of MAs to policy making at FDA and the agency’s need for a set of best practices to inform the use of MAs in nutrition policy development. Presenters and discussants addressed the foundational aspects of planning and delivering high-quality nutrition SRs1 and MAs. The second workshop in the series was held on September 25, 2023, to discuss the best practices for conducting SRs and MAs in the context of nutrition. Presenters discussed data errors, publication bias, and heterogeneity. The third and final workshop in the series which featured presentations on best practices in interpretation and application of SRs and MAs to evaluate the totality of evidence was held on October 3, 2023. This workshop addressed the impact of bias and data errors on interpreting results and the process for evaluating the strength of the evidence. As stated, the objective of the workshop series was to explore issues and best practices around MA; however, because MAs and SRs are closely related processes, many presentations included broader discussions around issues related to both MAs and SRs.
This Proceedings of a Workshop—in Brief2 will present highlights from the second workshop. This workshop was moderated by planning committee member Janet Tooze of Wake Forest University and included presentations by Emma Boyland of the University of Liverpool, Andrew
__________________
1 For discussion on the relationship between systematic reviews and meta-analyses, please see the Proceedings—in Brief for the first workshop in this series at https://nap.edu/27466.
2 Individual Proceedings of a Workshop—in Brief were prepared for each workshop in the series and are available online at https://nap.edu/27467 and https://nap.edu/27466. The full workshop proceedings is available at https://nap.edu/27481.
Jones of Liverpool John Moores University, and George Wells with the University of Ottawa. Their presentations focused on best practices for conducting MAs in nutrition research. A panel discussion with the three presenters and additional discussants Elie Akl of the American University of Beirut, Joseph Beyene of McMaster University, and M. Hassan Murad of the Mayo Clinic followed the presentations. The workshop concluded with closing remarks from planning committee member Russell J. de Souza of McMaster University.
The objectives of this second workshop were to
- Explore best practices for screening data for potential data errors;
- Discuss a system for evaluation of risk of bias in study design;
- Discuss a system for evaluation of study results, including precision and consistency of estimates and the potential for publication bias; and
- Explain how to interpret the results of MAs, what to do if assumptions are violated, and whether it is expected to have higher statistical heterogeneity for nutrition studies.
Throughout the presentations and discussion, workshop speakers addressed the following questions that were posed in advance by the workshop sponsor:
- Extraction errors from the primary studies that are included in MAs are common. What are best practices for avoiding/identifying these types of errors?
- What are the best practices for addressing publication bias?
This Proceedings of a Workshop—in Brief highlights the presentations and discussions that occurred at the second workshop in the series and is not intended to provide a comprehensive summary of the information shared during the workshop.3 Statements, recommendations, and opinions expressed are those of individual presenters and participants, and are not necessarily endorsed or verified by the National Academies of Sciences, Engineering, and Medicine, and they should not be construed as reflecting any group consensus.
EXPLORING BEST PRACTICES OF META-ANALYSIS IN NUTRITION RESEARCH
Boyland’s, Jones’s, and Wells’s presentations on best practices of MA in nutrition research covered four topic areas:
- screening data for potential data errors (Boyland);
- evaluation of risk of bias of study design (Boyland);
- evaluation of study results, including precision and consistency of estimates and the potential for publication bias (Jones); and
- interpreting the results of MA, including statistical heterogeneity (Wells).
Screening Data for Extraction Errors
Boyland began by focusing on best practices regarding screening data for potential extraction errors. She noted that extraction errors from the primary studies included within an MA are common and that she will discuss how to avoid or identify these types of errors. She stated that her presentation drew content from reviews that she co-created with other experts and the Cochrane Handbook,4 and she disclosed that she receives no industry funding and had approached the presentation through the lens of an academic researcher, leaning on her experience as a lead reviewer for the World Health Organization (WHO).
Boyland urged the importance of preventing errors during data extraction and highlighted the importance of training team members on all aspects of the process, including data extraction. She also recommended carefully examining retraction statements to ensure that none of the data being extracted for inclusion has been retracted. She suggested that data extraction occur independently and in duplicate, noting that this duplication is particularly important for any data elements that require subjective judgments and for data that are integral to the outcomes of the MA being performed.
Boyland suggested cross-checking all presentations of the data, including tables, text, and figures, for accuracy
__________________
3 The workshop agenda, presentations, and other materials are available at https://www.nationalacademies.org/event/40374_09-2023_use-of-meta-analyses-in-nutrition-research-and-policy-best-practices-of-conducting-meta-analysis (accessed December 11, 2023).
4 For the Cochrane Handbook, see https://training.cochrane.org/handbooks (accessed January 16, 2024).
and homogeneity. She also noted the benefits of a standardized data-extraction template table (Figure 1), which can improve data organization and prevent errors in both extraction and presentation of data.
Boyland emphasized the importance of screening for duplicate data, or “linked data or studies” which occurs when multiple papers are based on the same data set, in order to avoid including duplicate data within an MA. Some factors to screen for that she highlighted include identical locations, sample sizes, study dates, or study durations. If it is not clear whether two studies shared the same data, Boyland suggested reaching out to the study authors to verify. She referenced her own experience with this situation, discussing a time in which her team was performing an MA and encountered two articles that did not mention being connected, but had similar characteristics. Boyland’s team contacted the study authors, who confirmed that the data were linked. At this point, the team relied on pre-specified decision rules to determine which study to include in the MA, to avoid including duplicate data.
In cases where two or more papers with linked data are discovered, only one paper may be included in the MA. Boyland suggested having a formal and systematic decision-making process for addressing linked data in the MA protocol. She emphasized that it is critical for the review authors to choose which paper to include and to provide justification for this decision.
Boyland also described how to address data extraction for papers that report two different studies within the same article. She explained that it is not necessary to exclude these types of papers from the MA, but it should be noted that the two data sets came from the same article.
Boyland explained that errors can also arise when multiple outcomes are reported within the same study. In these situations, she suggested referring to the preestablished protocol in the decision-making process and deciding which of the data is most relevant to the MA. Boyland illustrated this point with an example from the food marketing literature, noting that many outcomes could potentially be relevant to the effects of exposure to food marketing on participant food intake. The team was able to identify the most relevant outcomes to the purpose of their review, based on preestablished criteria, which enabled them to make consistent, uniform decisions throughout the review process.
Evaluation of Risk of Bias in Study Design
In the second portion of her presentation, Boyland discussed the evaluation of risk of bias in study design. This type of bias, she explained, refers to “systematic errors” or deviation from the truth in results. This type of error is distinct from random errors, or imprecision, and may be introduced into the data at many points throughout the research process by the authors of the primary study, through research design constraints, or by review authors. She detailed some of the ways systematic errors may occur. Boyland noted that it is important to consciously minimize bias wherever possible.
Boyland described specific tools that can be used to analyze the risk of bias in a study when selecting studies for a review. She explained that the tools should be selected based on their suitability for the specific study design being assessed. For example, the Cochrane Risk of Bias 2 tool is a highly effective tool for analyzing
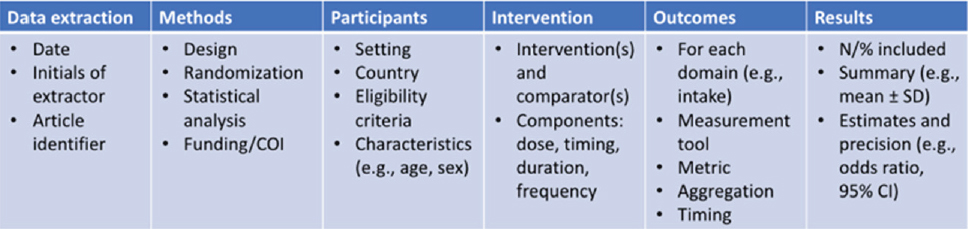
SOURCE: Presented by Emma Boyland on September 25, 2023, at the workshop on Use of Meta-Analyses in Nutrition Research and Policy: Best Practices of Conducting Meta-Analysis.
randomized controlled trials (RCTs) for risk of bias.5 It highlights ways that bias can arise across a variety of domains, including during the randomization process, when deviating from the intended intervention, when outcome data is missing, through outcome measurement, and through data selection and reporting. Boyland said that studies can be rated low risk, some concern, or high risk, and the tool generates a table depicting the ratings for each domain, as well as an overall rating for each article included. Boyland made specific note that a low-risk rating in one domain does not mean that an entire study is at a low risk for bias, and that concern in any domain suggests concern with the entire article.
Boyland described some unique considerations related to assessing risk of bias in nutrition research. She noted that many of the tools used for analyzing risk of bias are only applicable to RCTs, but many nutrition studies are observational studies, so choosing the appropriate tool is key, for example the Risk of Bias in Nonrandomized Studies of Interventions (ROBIN-I) tool for nonrandomized studies. For some study types, it may be necessary to develop new tools; however, the creation of new tools can lead to errors, if not fully validated. She suggested that nutrition research can have a higher overall risk of bias profile than other types of research, due to lack of disclosures, or bias not being adequately reported in the initial article. She stated that there may be limitations in nutrition studies due to study design. For example, experimental dietary studies often involve small populations measured over short periods of time. She also highlighted the common issue of research constraints, pointing out that it is nearly impossible to have a “blinded” experimental group in a dietary intervention trial.
Addressing Publication Bias
Jones’s presentation focused on best practices for avoiding and addressing publication bias in SRs and MAs. He noted that his disclosures were similar to those of Boyland. He defined publication bias as the “failure to publish the results of a study on the basis of the direction or strength of the study findings,” a problem not limited to the field of nutrition (DeVito and Goldacre, 2019). Jones noted that publication bias is more likely to occur when studies have non-significant results, as journals are more likely to publish studies that report significant results, or when studies’ negative results are suppressed by the study sponsor. A study from Polanin and colleagues (2016) showed that published studies yield larger effect sizes than unpublished studies.
Jones said it was important to identify unpublished studies, and he described several resources for doing this, including preprint servers, such as NutriXiv for nutrition research. He noted some issues that may arise when using unpublished research, including that unpublished studies are often not peer reviewed, are more likely to include grammatical and numerical errors, and are less likely to report conflicts of interest or funding sources, which are critical for evaluating overall bias. Despite these challenges, Jones explained that the Preferred Reporting Items for Systematic Reviews and Meta-Analyses (PRISMA) still recommends the use of preprints in MAs to avoid publication bias.
Jones described several statistical methods to assess publication bias. For a visual way to examine publication bias in selected studies, Jones suggested and explained the use of funnel plots. The funnel plot shows each study’s effect size, or intervention effect, plotted against a measure of the study’s precision, such as sample size or standard error. Symmetry in the funnel plot suggests a lower risk of publication bias. However, Jones noted, funnel plots are subjective measures and can be difficult to visually interpret when the sample size is small. Jones explained that the improper or misleading use of funnel plots can be harmful and should be used in conjunction with another statistical method.
Jones spoke about methods of assessing funnel plot asymmetry using statistical analyses. Egger’s test aims to identify if there may be “small study bias” and regresses the scaled effect size against the precision of the included studies. If there is asymmetry this indicates that the smaller studies are systematically different from the larger studies.
__________________
5 For more on the Cochrane risk of bias tool, see https://methods.cochrane.org/bias/resources/rob-2-revised-cochrane-risk-bias-tool-randomized-trials (accessed January 16, 2024).
Another set of tests, the precision effect test or the precision effect estimate with standard error test, fits a linear regression line and then extrapolates to estimate the effect size of a hypothetical study with a standard error of zero. Jones cautioned that this method can be particularly ineffective under conditions of high heterogeneity and when analyzing smaller studies with a large effect size.
Another approach for analyzing a funnel plot that Jones described is the trim and fill method. In this process, studies with the most extreme effect sizes are “trimmed” from the plot to help researchers understand how many hypothetical studies are missing from the analysis to achieve symmetry on the plot. However, he noted some drawbacks to this approach, including that removing outliers will have a large impact and that the approach does not work in MAs with high heterogeneity.
Jones also discussed a newer and less frequently used method called the p-curve analysis. He described the p-curve analysis as an MA of the p-values in the included studies, a method for considering the evidential value of the studies being analyzed. Jones said that it is a useful way of measuring publication bias, or selective reporting. He explained that a p-value of less than 0.05 is both a threshold for statistical significance and a threshold at which studies are more likely to be published. When using p-curve analysis, selective reporting can be suspected if p-values cluster around 0.04 or 0.05, suggesting that researchers may have engaged in selective reporting of evidence to support their preformed conclusions.
Another method of analysis that Jones touched on is the graphical display of study heterogeneity (GOSH), a tool to identify the impact of influential studies within an MA. It takes the effect size from each study included in the MA and calculates an estimated overall effect for every potential combination of effect size, up to a specified number of potential combinations. For an MA of k ≥ 2 studies, where k is the number of studies included in the MA, there are 2k − 1 potential subsets of studies. The purpose of this method of analysis is to gain an understanding of the normal distribution of possible effects from the studies included in the MA. Jones acknowledged that this method may not detect publication bias but is a way to highlight bias in the studies.
Jones cautioned against using the “fail-safe N” (FSN) to avoid publication bias, a method that Cochrane also recommends against. As Jones explained, FSN determines the number of studies with a non-significant effect that would need to be added to a sample of studies for the meta-analytic effect to be non-significant. This method is discouraged in nutrition research MAs because it does not actually determine whether there is bias, and the existence of greater bias can lead to the creation of a larger FSN value.
In closing, Jones reiterated the importance of checking for unpublished research on the topic being reviewed and using multiple statistical tests to assess publication bias, given that each has benefits and weaknesses. Examination of the inclusion of influential studies can improve understanding of how they may impact measures of heterogeneity and skew the meta-analytic effect.
Interpreting the Results of Meta-Analyses
Wells presented on the topics of interpreting the results of MAs and how to conceptualize and address heterogeneity. He disclosed that he has no industry funding, is affiliated with Cochrane, and his presentation was informed by his experience with Cochrane and GRADE (Grading of Recommendations Assessment, Development and Evaluation Network). The presentation focused on the final three steps in performing an MA:
- combining the results of selected studies to obtain a summary effect;
- exploring the differences between the studies, or heterogeneity; and
- interpreting the results.
Wells described several statistical methods that are used in these processes. Forest plots are a graphical display of the estimated results from multiple scientific studies addressing the same question, along with the overall results. Wells discussed how to use a forest plot to analyze the effect estimates, or in the specific example he reviewed, the “mean difference” data. As Wells described, Figure 2 displays a forest plot for an SR on the use of low-sodium

SOURCE: Presented by George Wells on September 25, 2023, at the workshop on Use of Meta-Analyses in Nutrition Research and Policy: Best Practices of Conducting Meta-Analysis; Brand et al., 2022.
salt substitutes, compared with regular salt or no active intervention in adults, and change in blood pressure. Wells described how to interpret the mean difference information. Wells also described how the studies were weighted to assess their impact within the MA.
Wells noted two statistical models of analysis that are used in MAs, the fixed effects model and the random effects model. The fixed effects model, Wells said, may be unrealistic to use in nutrition MAs because it ignores heterogeneity. The random effects model allows for incorporation of between studies heterogeneity, but still requires an understanding of the estimate of the distribution of studies. This estimated distribution may not be accurate if there are few studies or events. Wells described the mean difference, an effect measure for comparing the effect means of the intervention groups to those of the control groups. He spoke about how confidence intervals relate to the mean difference, pooling estimates, and standard errors. He said that the more precise the numerical estimates are, the narrower the confidence interval will be. Wells said that the pooled effect estimate is represented both graphically and numerically on the forest plot. Graphically, it is represented on the forest plot by a diamond-shaped mark, which highlights its position relative to the mean difference. The numeric value of the pooled estimate effect shows its meta-analytic value, while the confidence interval, and where it falls relative to the individual studies, shows its statistical significance.
Wells discussed how to identify heterogeneity on a forest plot. He said that it can be identified visually, using a chi-square (or Q-) test, or by using an I-squared statistical test. Confidence intervals that show very little overlap on the forest plot provide an early indicator of a heterogeneity problem. When using the Q-test to assess heterogeneity, a small p-value means that the presence of homogeneity has been rejected, and the studies are too different to combine. However, the Q-test as a statistical method will be unreliable with a small body of studies and can also be unreliable with too large of a body of studies due to its high sensitivity. Another statistical method for assessing the presence of heterogeneity that Wells detailed is the I-squared test, which attempts to not just identify but also quantify heterogeneity. Values range from zero to 100 percent, with higher values indicating higher heterogeneity. While the I-squared test provides more detailed information about the presence of heterogeneity, there is no universally accepted cut-off point for interpretation.
Addressing Heterogeneity
Wells said that once heterogeneity is identified, it should be explained, and if it cannot be explained, the data
should be interpreted to accommodate the heterogeneity. Wells defined the types of heterogeneity that may be present in an SR or MA. Clinical heterogeneity refers to differences in studies among participant and intervention characteristics. Participant variations may include differences in their condition, demographics, or location. Intervention variations may include differences in implementation, the experience of practitioners involved, and the type of control used. Outcomes variations may include measurement methods, event definition, cut points, and duration of follow-up. Methodological heterogeneity, as Wells described, can arise when studies vary in their design and conduct or when there are publication limitations or constraints. Statistical heterogeneity occurs when the results observed across studies are more different than would be expected by chance.
Wells described ways to examine heterogeneity. Subgroup analysis and meta-regression can be used to assess the factors that appear to modify the effect. Wells explained that specific factors should be considered during subgroup analyses, such as whether the heterogeneity found within subgroups differs from the overall heterogeneity. He also suggested conducting statistical tests for subgroup differences to ensure that true differences exist between subgroups. Wells noted that confidence in the results of the MA should increase if the effect that is seen is also thought to be clinically plausible and supported by evidence outside of the review.
Heterogeneity, he said, can also be considered using sensitivity analysis. This method provides information on the robustness of the results. This analysis is done by repeating the MA using alternative options to assess the consistency or robustness of the results.
Wells detailed a color-coding system for evaluating risk of bias within individual studies. Using Figure 2 as an example, he noted that green dots signify low risk of bias, yellow signifies uncertain risk, and red means that a study is considered at high risk of bias.
Wells provided a detailed example of analyzing risk of bias and heterogeneity in an MA featuring studies with binary or discrete outcomes, such as studies of cardiovascular events. Relative risk, he explained, is a more straightforward calculation when analyzing discrete outcomes, compared with studies that examine multicomponent interventions and complex outcomes.
Wells said that there is greater potential for confounding in nutrition studies compared with placebo-controlled drug trials. Referring to the PICO framework, Wells said that in nutrition studies, the P, population, and the O, outcome, are commonly easy to define, but the I, intervention, and the C, control, can be complicated and challenging to define in a singular manner, thus making them difficult to combine and analyze in a high-quality MA.
Wells explained how the GRADE approach could be used to assess the certainty of the evidence in which the intervention and control are complicated and not uniform across studies. He described potential reasons for downgrading the certainty of the evidence, including studies that are poorly conducted or inconsistent, study results that do not apply to the question being asked in the MA, small sample sizes, large confidence intervals, and publication bias. Using the MA on the use of low-sodium salt substitutes for reducing cardiovascular events as an example, Wells noted that the GRADE method illuminated issues with the quality of evidence, especially for the groups of interest to the MA. Use of this tool helped the researchers to better understand the limitations of the certainty of the evidence. In closing, Wells suggested the use of A Measurement Tool to Assess Systematic Reviews (AMSTAR),6 which he described as a critical appraisal tool for SRs and MAs that include both randomized and nonrandomized studies of health care interventions.
PANEL DISCUSSION
The workshop featured a panel discussion moderated by Tooze with Boyland, Jones, and Wells, as well as additional discussants Beyene, Akl, and Murad. The discussion centered around the presentation topics and addressed questions that were asked by audience members.
__________________
6 For more on AMSTAR, see https://amstar.ca (accessed January 16, 2024).
Avoiding Data Errors
On the topic of ways to prevent data errors during the phases of data extraction and analysis, Akl asked Boyland how to address complex effect modifiers. Boyland urged caution during the data-extraction process and suggested directly contacting study authors to better understand whether the study included control groups that were not mentioned in the final publication. Wells added that complex interventions may require multiple methods, and that in complex cases where heterogeneity cannot be avoided, acceptance of the heterogeneity can lead to a better understanding of the effect modifier.
In response to an audience question about whether to use study data repositories or rely solely on the reports when extracting data from large epidemiological studies, Boyland noted the benefits of maximizing both volume and quality of data. Jones also expressed concerns with data repositories and noted that referencing the author’s report may be beneficial. Jones suggested that researchers should aim to better manage and present raw data.
Multiple audience members asked how to address the existence of multiple reports published from the same study data. Boyland replied that if the same dataset has been analyzed in multiple ways, teams should consider which outcome to use in the MA. Those conducting the MA should be able to rely on their agreed upon methods, PICO, and hierarchy of decision making in these cases, asking what data is most relevant to the research question, and what are the most valid tools that have been used to generate the data. Akl agreed, suggesting that researchers consider what data have been produced using the highest-quality and most appropriate methodologies and which data are the best fit for the population of interest. He added that using multiple publications based on the same dataset could have an undue influence on policy development, as each paper may be interpreted by policy makers as independent evidence. It is important when doing MAs for the purpose of impacting policy, Akl said, to be sure that duplicate data are not used in a way that can bias results.
An audience member asked about the inclusion of subgroups in an MA and whether it might result in the data from a single study being counted multiple times. Jones asserted that including the same study, carried out in multiple groups, would violate independence principles and require a more technical, multilevel MA, a point on which Tooze concurred. In these situations, Wells suggested the use of an Instrument for Assessing the Credibility of Effect Modification Analyses (ICEMAN), which can be used to assess factors beyond statistical significance and provide analysis within or between studies. Beyene commented that meta-regression provides an advantage over subgroup analysis when exploring potential heterogeneity, especially when the factors being analyzed are continuous. The downside to such an analysis, he said, is the focus on aggregate data. He noted similar challenges in dose-response studies, stating that it is difficult to know if the relationship is linear. Beyene acknowledged that there are many potential challenges with data analysis, and researchers should use their best judgment regarding the method of analysis that is best for their study.
Preventing and Evaluating Bias
The second discussion focused on preventing and evaluating bias in SRs and MAs. Murad commented that publication bias occurs frequently, and its existence is difficult to determine, particularly when analyzing small, nonrandomized studies that have not been registered. He stated that conducting multiple analyses to identify the results of greatest significance, which can be done most easily with small, unregistered nonrandomized studies, poses a large threat to research that may not be easily overcome. Murad also responded to a question from an audience member about the best risk of bias tools for use in nutrition research, considering the lack of RCTs used in the field. He described some tools that are used for nonrandomized comparative studies, including the Newcastle-Ottawa Scale tool,7 Cochrane Risk of Bias in Nonrandomized Studies of Exposures (ROBINS-E), and ROBINS-I tools. Murad added that resources and trainings can help guide researchers to the right tools for their particular study.
__________________
7 For more on the Newcastle-Ottawa Scale, see https://www.ohri.ca/programs/clinical_epidemiology/oxford.asp (accessed January 16, 2024).
Tooze asked a follow-up question about the use of I-squared analysis as a measure of heterogeneity in nutrition studies, inquiring whether a high I-squared number is always expected. Murad replied that it would be expected to be high in an observational study, which makes the tool less useful in these cases, a comment with which Akl and Wells concurred.
Interpreting Data through Statistical Analysis
The third discussion centered on best practices for interpreting data though statistical analysis. The discussion touched on the pros and cons of conducting an MA and best practices for data analysis within MAs.
Beyene asked about reasons for conducting an MA. Wells replied that an MA can both increase the power to answer a research question by combining studies and explore differences between studies. In this way, an MA is a tool for both synthesizing and analyzing evidence. However, challenges with MAs that Wells noted include inconsistencies in data, excessive heterogeneity, and the shortcoming of certain statistical tools.
Wells spoke further about addressing heterogeneity, saying that the forest plot can be a helpful visual in identifying likely heterogeneity. He said that addressing heterogeneity through statistical tools can be challenging, due to the lack of strength of many of the tools or their lack of accuracy. For example, the Q-test had been used for this purpose, but it does not test the correct hypothesis because the null hypothesis is not set up to be rejected. Furthermore, he noted that the Q-test does not have enough power to be a useful analysis with a small sample of studies. In these cases, he suggested that the I-squared test may be more useful, but both he and Tooze noted limitations with that method as well.
Furthering the discussion about heterogeneity and subgroup analyses, Tooze asked the panelists for input on the categories, such as intervention or participant characteristics, that should be considered to reduce heterogeneity when developing the protocol. Wells replied that groups should begin with PICO, closely examining the differences between populations, with particular attention to the differences that exist across important characteristics. As nutrition interventions are often complex, Wells noted that it may be helpful to group interventions into categories in order to analyze them.
Wells also noted that it can be difficult to understand the exposure in nutrition research and whether the specific intervention is causing the effect, a comment on which Murad concurred. Murad stated that, in nutrition research, it is important to know exactly how much of a nutrient is leading to the change or the outcome, and he suggested using the GRADE guidance in rating certainty of evidence when interpreting dose-response studies (Murad et al., 2023). He noted that dose-response MAs are especially useful and relevant in nutrition research.
Addressing a question from an audience member about what constitutes a wide confidence interval in the context of GRADE, Murad and Akl suggested first defining the effect size that is considered important based on clinical relevance, stakeholder feedback, and statistical significance. Wells agreed, adding that one should determine the minimally important difference, the effect estimate, and then the confidence interval.
Tooze relayed a question from an audience member, asking how many confounders can be included in a meta-regression, and if the answer depends on the number of studies included. Wells said that it does depend on the sample size, or the number of studies included. He highlighted the ecological fallacy, in which an effect may appear to exist from one study to the next, but within a single study, the effect disappears. This risk is one reason that Wells suggested the use of subgroup analyses. Most MAs are done with a smaller number of studies, and meta-regressions become an imprecise tool for analyzing a combined effect when using a small number of studies.
CLOSING REMARKS
The workshop ended with closing remarks from de Souza. On behalf of the planning committee, he thanked FDA for sponsoring the workshop and for providing the guiding questions that framed the presentations. He also thanked the National Academies staff for planning and organizing the workshop and the panelists and
discussants, who both provided detailed presentations and contributed meaningfully to the discussion portion of the workshop. Finally, de Souza thanked the audience members for attending and for contributing questions to the panel discussion.
This workshop was the second of three in the series Use of Meta-Analyses in Nutrition Research and Policy. The third workshop, which followed, focused on the interpretation and application of MAs in nutrition research and policy.
REFERENCES
Brand, A., M. E. Visser, A. Schoonees, and C. E. Naude. 2022. Replacing salt with low-sodium salt substitutes (LSSS) for cardiovascular health in adults, children and pregnant women. Cochrane Database of Systematic Reviews 8(8):CD015207. https://doi.org/10.1002/14651858.CD015207.
DeVito, N. J., and B. Goldacre. 2019. Catalogue of bias: Publication bias. BMJ Evidence Based Medicine 24(2):53-54.
Murad, M. H., J. Verbeek, L. Schwingshackl, T. Filippini, M. Vinceti, E. A. Akl, R. L. Morgan, R. A. Mustafa, D. Zeraatkar, E. Senerth, R. Street, L. Lin, Y. Falck-Ytter, G. Guyatt, and H. J. Schünemann. 2023. GRADE guidance 38: Updated guidance for rating up certainty of evidence due to a dose-response gradient. Journal of Clinical Epidemiology 164:45–53. https://www.jclinepi.com/article/S0895-4356(23)00252-4/ (accessed December 27, 2023).
Polanin, J. R., E. E. Tanner-Smith, and E. A. Hennessy. 2016. Estimating the difference between published and unpublished effect sizes: A meta-review. Review of Educational Research 86(1):207–236. https://journals.sagepub.com/doi/abs/10.3102/0034654315582067 (accessed December 27, 2023).
DISCLAIMER This Proceedings of a Workshop—in Brief has been prepared by Melissa Maitin-Shepard and Marian Flaxman as a factual summary of what occurred at the meeting. The statements made are those of the rapporteurs or individual workshop participants and do not necessarily represent the views of all workshop participants; the planning committee; or the National Academies of Sciences, Engineering, and Medicine.
*The National Academies of Sciences, Engineering, and Medicine’s planning committees are solely responsible for organizing the workshop, identifying topics, and choosing speakers. The responsibility for the published Proceedings of a Workshop—in Brief rests with the institution. The planning committee comprises Katherine Tucker (Chair), University of Massachusetts–Lowell; Mei Chung, Tufts University; Russell J. de Souza, McMaster University; Amanda MacFarlane, Texas A&M University; Chizuru Nishida, World Health Organization (retired); and Janet Tooze, Wake Forest University.
REVIEWERS To ensure that it meets institutional standards for quality and objectivity, this Proceedings of a Workshop—in Brief was reviewed by Mei Chung, Tufts University and Maureen Spill, Texas A&M Agriculture, Food & Nutrition Evidence Center. Leslie Sim, National Academies of Sciences, Engineering, and Medicine, served as the review coordinator.
SPONSOR This workshop was supported by the United States Food and Drug Administration (contract no. 75F40122D00002/75F402122F19002).
STAFF Takyera Robinson, Alice Vorosmarti, and Samuel Crawford, Food and Nutrition Board, Health and Medicine Division, National Academies of Sciences, Engineering, and Medicine.
For additional information regarding the workshop, visit https://www.nationalacademies.org/event/40374_09-2023_use-of-meta-analyses-in-nutrition-research-and-policy-best-practices-of-conducting-meta-analysis.
SUGGESTED CITATION National Academies of Sciences, Engineering, and Medicine. 2024. Use of meta-analyses in nutrition research and policy: Best practices of conducting meta-analysis: Proceedings of a workshop—in brief. Washington, DC: The National Academies Press. https://doi.org/10.17226/27467.
|
Health and Medicine Division Copyright 2024 by the National Academy of Sciences. All rights reserved. |
 |


