Abstract
There is presently a conflict between fossil- and molecular-based evolutionary time scales. Molecular approaches for dating the branches of the tree of life frequently lead to substantially deeper times of divergence than those inferred by paleontologists. The discrepancy between molecular and fossil estimates persists despite the booming growth of sequence data sets, which increasingly feeds the interpretation that molecular estimates are older than stratigraphic dates because of deficiencies in the fossil record. Here we show that molecular time estimates suffer from a methodological handicap, namely that they are asymmetrically bounded random variables, constrained by a nonelastic boundary at the lower end, but not at the higher end of the distribution. This introduces a bias toward an overestimation of time since divergence, which becomes greater as the length of the molecular sequence and the rate of evolution decrease.
The hypothesis of the molecular clock holds that the number of amino acid (or nucleotide) replacements in any given protein (or DNA) sequence changes linearly with time (1, 2). If constant, rates of molecular evolution can be extrapolated for dating past evolutionary events. Rates used for extrapolation have to be first calibrated by reference to absolute dates drawn from the fossil record. A notable feature of the hypothesis of the molecular clock is multiplicity: every one of the thousands of proteins or genes of an organism is an independent clock, each ticking at a different rate, but all measuring the same events (3–5). Molecular clock projections have ostensibly pushed back fossil-based dates in many studies (6). Prominent examples are the time of origin of the metazoan phyla, which has been placed as twice as old as determined by paleontologists (but see ref. 7), dating to more than 1,000 Myr ago (8–10); or the split of the three multicellular kingdoms, timed at about 1,600 Myr ago (9–11), some 400 Myr earlier than predicted from the fossil record.
Two not mutually exclusive explanations have been adduced to account for molecular earlier than fossil dates: (i) incompleteness of the fossil record, such that paleontological data can provide only minimal divergence dates (6, 12, 13); and (ii) too few genes and proteins considered, which turns molecular dating methods inaccurate (6, 9). It has been proposed that discrepancies between fossil and molecular dates will fade away as new fossil findings continue to accumulate; but also, and more steeply, as the size of molecular data sets become increasingly larger, because averages across numerous estimates of the same date will converge toward more consistent estimates (6, 9, 10, 14). Yet although data sets have become much larger and methods of analysis considerably more sophisticated, the discrepancy between fossil and molecular dates has not disappeared (reviewed in ref. 6). We now show that common molecular estimates are upwardly biased because of a fundamental flaw in the molecular approach to dating.
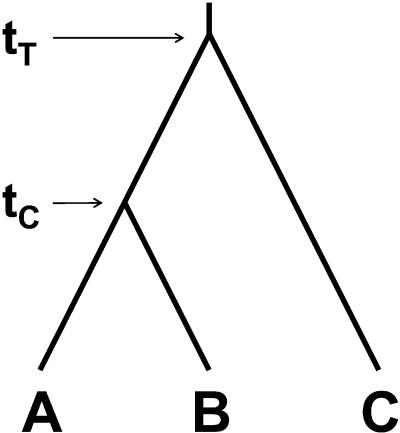
Suppose three orthologous protein sequences related as in Fig. 1, which have passed some molecular clock criterion (usually a “relative rate” test), and that we seek to determine the date when lineages C and AB split (denoted as tT, or target time in Fig. 1). Let us assume that the average number of amino acid replacements per site between A and B is KAB = 1, and that C differs from either A or B by KAC = KBC = 10. Also, it is known from the fossil record that A and B split from a common ancestor 100 Myr ago (denoted as tC, or calibration time). Hence, the absolute rate of molecular evolution between A and B would be rAB = KAB/2tC = 5 × 10⁻⁹ replacements per site per year. If we assume that rAB (hereafter denoted as rR, or reference rate) is equal to the rate between C and AB (hereafter denoted as rU, or unknown rate), then the unknown date would be placed at tT = [(KAC + KBC)/4]/rR = 1,000 Myr ago. After conducting analogous calculations separately for each of n independent, putatively rate-constant protein regions, conventional molecular dating approaches would set the time of the split between lineages C and AB as the arithmetic mean across the ensuing n tT values (e.g., refs. 7–11 and 14).
Figure 1.
Tree topology for lineages A, B, and C. tC and tT represent, respectively, calibration and target times.
Note, however, that (i) even if rate constancy holds, rR and rU represent different realizations of a stochastic process, subject to sampling variation such that they are not expected to be identical; indeed, the dispersion of the rate of molecular evolution has proved to be much larger than expected if the probability of change were constant (3, 4, 15, 16); and (ii) because of its definition as a quotient of (often nonindependent, gamma-distributed) rates, time-since-divergence is an asymmetrically bounded random variate: constrained to be non-negative (i.e., the lower boundary is nonelastic) but unbounded above zero (i.e., elastic boundary). Equivalent random deviations around target times scale divisively forward (i.e., to the present), but multiplicatively backward (i.e., to the past) on their target times. As a result of this reciprocal scaling of under- and overestimates, the frequency distribution of time-since-divergence estimates is squashed up near the origin with a long tail to the right, yielding arithmetic averages that are upwardly biased with respect to the true times. Suppose that in Fig. 1 100 and 1,000 Myr are, respectively, the true divergence times between A and B, and between either of them and C. Now consider two protein sequences with observed rR two times rU for one protein, and rR half rU for the other protein. The first protein would date the split between C and AB 500 Myr later than it happened (i.e., 500 Myr ago), whereas the second one would set the split 1,000 Myr earlier (i.e., 2,000 Myr ago). The arithmetic average across the two proteins is 1,250 Myr, which still overestimates the true time by 250 Myr. These numbers become increasingly disparate as the ratio rR/rU deviates from 1.
To evaluate the extent of the overestimation that results from equating target times to arithmetic means across multiple-gene data, we simulated the evolution of an ancestral amino acid sequence along the topology of Fig. 1 under different sets of conditions. For each condition set, the rate of replacement was fixed throughout the tree (i.e., rR = rU). Amino acid changes were generated conforming to the model of ref. 17, using the discrete gamma distribution with shape parameter α (the JTT+dG model; ref. 18) to accommodate among-site rate variation. Three different, biologically meaningful replacement rates were considered to represent slow (one replacement per site per 1010 years), intermediate (five replacements per site per 1010 years), and fast (ten replacements per site per 1010 years) evolving genes. Each replacement rate was combined with a specific value of α (0.5, 1.0, and 2.0, respectively), to take into account that slowly evolving proteins tend to have a high level of rate variation among sites, and vice versa (19). In all cases, tC was set to 300 Myr, and for each rate class we considered three total tree lengths by setting alternatively tT at 600 Myr, 1,100 Myr, and 3,000 Myr. We considered four sequence lengths (75, 150, 300, and 500 aa) that span most frequent alignment lengths (e.g., refs. 7–11 and 14). For each set of conditions we conducted 1,000 simulations. Each simulation produced three amino acid sequences related as in Fig. 1. With each sequence set we built a pair-wise distance matrix by using the same model (i.e., JTT+dG) and parameter values as in the original simulation. Then we extrapolated the inferred values of rR to estimate corresponding tT values. Simulations were performed with the evolver program from the paml package (20).
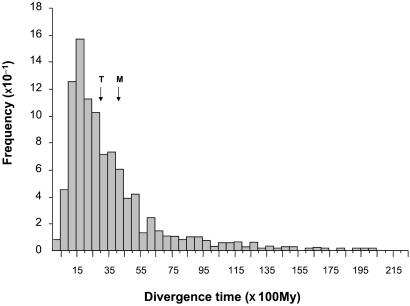
The simulation results are shown in Table 1. As expected, owing to the distributional asymmetry of divergence times, even under a uniform rate model of evolution, arithmetic averages across molecular clock projections consistently overestimate the true date of divergence (i.e., Table 1 ratios enclosed in parentheses are all greater than one). The overestimation problem becomes aggravated as the rate of replacement decreases and/or the sequences become shorter. Both circumstances are expected to result in enhanced sampling variation of estimates, thus yielding increasingly right-skewed distributions. Fig. 2 illustrates the frequency distribution of 1,000 time estimates for the case of a short (75 residues long) slowly evolving (five replacements per site per 1010 years) protein used to date an episode 3,000 Myr old (first column in third row of Table 1). The distribution is highly skewed to the right, giving an arithmetic average that places the event 4,084 Myr ago—i.e., more than 1,000 Myr earlier than actually happened. Table 1 also shows that overestimates grow as target times become increasingly remote. Apparently, this pattern results because, when the rate of replacement is low enough such that the sequences being handled become too short for accurately reflecting the expected number of variable sites, evolutionary rates become consistently underestimated. Underestimation is most acute for the reference rate, because it involves the shortest time span (i.e., there has been less time to accumulate replacements), and diminishes as the rate to be ascertained involves an increasingly remote divergence. Because of these systematic differences in sampling error between the calibration and extrapolation rates, the least related sequences will often appear to have diverged more, leading to inflated divergence times. Note that this methodological bias becomes enhanced as a consequence of the multiplicative scale of overestimates.
Table 1.
Mean divergence time estimates between lineages C and AB in Fig. 1, assuming that A and B split 300 Myr ago
| r* | α | tT† | Branch lengths‡ | Protein length§
|
|||
|---|---|---|---|---|---|---|---|
| 75 | 150 | 300 | 500 | ||||
| 1 | 0.5 | 600 | ((A:3,B:3):3,C:6) | 732 (1.22) | 676 (1.13) | 637 (1.06) | 616 (1.03) |
| 1,200 | ((A:3,B:3):9,C:12) | 1600 (1.33) | 1372 (1.14) | 1301 (1.08) | 1243 (1.04) | ||
| 3,000 | ((A:3,B:3):27,C:30) | 4084 (1.36) | 3589 (1.20) | 3210 (1.07) | 3194 (1.06) | ||
| 5 | 1.0 | 600 | ((A:15,B:15):15,C:30) | 642 (1.07) | 619 (1.03) | 611 (1.02) | 607 (1.01) |
| 1,200 | ((A:15,B:15):45,C:60) | 1301 (1.08) | 1237 (1.03) | 1218 (1.02) | 1212 (1.01) | ||
| 3,000 | ((A:15,B:15):135,C:150) | 3308 (1.10) | 3161 (1.05) | 3053 (1.02) | 3043 (1.01) | ||
| 10 | 2.0 | 600 | ((A:30,B:30):30,C:60) | 624 (1.04) | 619 (1.03) | 609 (1.02) | 604 (1.01) |
| 1,200 | ((A:30,B:30):90,C:120) | 1278 (1.07) | 1238 (1.03) | 1210 (1.01) | 1219 (1.02) | ||
| 3,000 | ((A:30,B:30):270,C:300) | 3505 (1.17) | 3204 (1.07) | 3122 (1.04) | 3128 (1.04) | ||
Replacement rate (replacements per site per 1010 years).
Target time.
The branch lengths for the topology in Fig. 1 (given in parenthetical notation) ×102 are the expected absolute numbers of replacements per site.
The ratios between estimated and target times are given in parentheses.
Figure 2.
Frequency distribution of 1,000 estimates of the divergence time between lineages C and AB in Fig. 1, set to have occurred 3,000 Myr ago, obtained using a short (75 residues long), slow evolving (one replacement per site per 1010 years) protein, and using the split between A and B, set to 300 Myr ago, as the calibration point. T and M represent target (i.e., 3,000 Myr) and estimated mean (i.e., 4,084 Myr; see Table 1) times, respectively.
With real-world sequences, overestimates of divergence times are expected to be larger than suggested by our simulations, particularly because relative rate tests widely used to identify and exclude sequences that violate the rate-constancy assumption have but limited statistical power (7, 21–24). Relative rate tests neglect levels of rate variation between lineages where the rate of one lineage is as much as four times the rate of the other in most typical data sets (24). In addition, the power of relative rate tests decreases with the length of the sequences and the number of variable sites (23), which are precisely the conditions where sampling error differences between calibration and extrapolation rates become more pronounced.
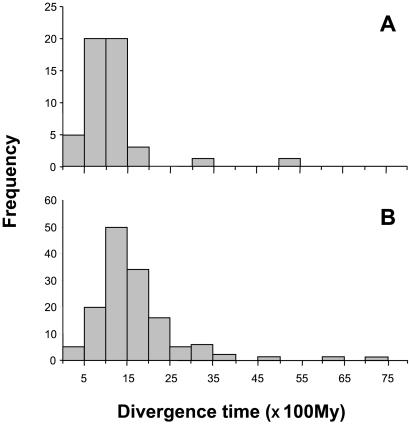
Fig. 3 illustrates the distribution of divergence time estimates taken from a representative multiprotein study (see table 1 of ref. 9; see also figure 2 of ref. 10). As a calibration point, the study used 310 Myr for the date of the split between birds and mammals, considered to be reliably attested by the fossil record. On the basis of arithmetic averages, Wang et al. (9) placed the divergence between arthropods and chordates at 993 ± 46, and the three-way split of animals, fungi, and plants at 1576 ± 88 Myr ago (see also ref. 10)—i.e., some 400 Myr earlier than predicted from the fossil record in both cases. Yet it is apparent from Fig. 3 that the distribution of estimated divergence times is conspicuously asymmetric, and markedly right-skewed in the two examples, as expected from the reciprocal scaling of under and overestimates on the target time. This asymmetry was noted by Wang et al. (9), who attributed it to the presence of outliers.
Figure 3.
Frequency distribution of divergence time estimates. (A) The split chordate-arthropod (50 estimates). (B) The split animal–fungi–plant (55 animal–fungi, 49 animal–plant, and 37 fungi–plant pooled together). Taken from table 1 of ref. 9.
Despite the booming amount of sequence information, molecular timing of evolutionary events has continued to yield conspicuously deeper dates than indicated by the stratigraphic data. Increasingly, the discrepancies between molecular and paleontological estimates are ascribed to deficiencies of the fossil record, while sequence-based time tables gain credit. Yet, we have identified a fundamental flaw of molecular dating methods, which leads to dates that are systematically biased toward substantial overestimation of evolutionary times. Moreover, as rate ratios, divergence times are highly sensitive to the vagaries of the molecular clock. It is thus not surprising that early molecular assessments inferred widely varying dates for the same event, some of them far earlier than those derived from the fossil record (reviewed in ref. 6). These studies typically focus on just one or a few, often slowly evolving (i.e., most easily alignable) proteins. Averages across multiple measures of the same divergence time are expected to converge to more consistent overestimates as molecular data sets become vastly larger in the future. If molecular-sequence-based time appraisals are to yield reliable estimates, centered around the target dates, they should take a new turn. Although enlarging the size of the data sets remains a critical issue, attention must be paid to careful choice of the sequences. Close approximation to the molecular clock premise should be a necessary condition. Given the limited power of available tests, however, acceptance of this premise seems safe only for long and fast evolving (yet alignable) sequences. Although proceeding with appropriate caution may not completely close the gap between clocks and rocks (for they still measure different events), it will likely contribute to its narrowing.
Acknowledgments
F.R.-T. and R.T. received support from contracts Ramón y Cajal and Doctor I3P, respectively, from the Ministerio de Ciencia y Tecnología (Spain). This work was supported by National Institutes of Health Grant GM42397 (to F.J.A.).
Abbreviation
- Myr
million years
References
- 1.Zuckerkandl E, Pauling L. In: Evolving Genes and Proteins. Bryson V, Vogel H J, editors. New York: Academic; 1965. pp. 97–166. [DOI] [PubMed] [Google Scholar]
- 2.Kimura M. Nature (London) 1968;217:624–626. doi: 10.1038/217624a0. [DOI] [PubMed] [Google Scholar]
- 3.Ayala F J. J Hered. 1986;77:226–235. doi: 10.1093/oxfordjournals.jhered.a110227. [DOI] [PubMed] [Google Scholar]
- 4.Gillespie J H. The Causes of Molecular Evolution. New York: Oxford Univ. Press; 1991. [Google Scholar]
- 5.Li W-H. Molecular Evolution. Sunderland, MA: Sinauer; 1997. [Google Scholar]
- 6.Wray G A. Genome Biol. 2002;3:1–7. doi: 10.1186/gb-2001-3-1-reviews0001. [DOI] [PMC free article] [PubMed] [Google Scholar]
- 7.Ayala F J, Rzhetsky A, Ayala F J. Proc Natl Acad Sci USA. 1998;95:606–611. doi: 10.1073/pnas.95.2.606. [DOI] [PMC free article] [PubMed] [Google Scholar]
- 8.Wray G A, Levinton J S, Shapiro L H. Science. 1996;274:568–573. [Google Scholar]
- 9.Wang Y-C, Kumar S, Hedges S B. Proc R Soc London Ser B. 1999;266:163–171. doi: 10.1098/rspb.1999.0617. [DOI] [PMC free article] [PubMed] [Google Scholar]
- 10.Heckman D S, Geiser D M, Eidell B R, Stauffer R L, Kardos N L, Hedges S B. Science. 2001;293:1129–1133. doi: 10.1126/science.1061457. [DOI] [PubMed] [Google Scholar]
- 11.Feng D-F, Cho G, Doolittle R F. Proc Natl Acad Sci USA. 1997;94:13028–13033. doi: 10.1073/pnas.94.24.13028. [DOI] [PMC free article] [PubMed] [Google Scholar]
- 12.Glaessner M F. The Dawn of Animal Life. Cambridge, U.K.: Cambridge Univ. Press; 1984. [Google Scholar]
- 13.Conway Morris S. Nature (London) 1993;361:219–225. [Google Scholar]
- 14.Nei M, Xu P, Glasko M. Proc Natl Acad Sci USA. 2001;98:2497–2502. doi: 10.1073/pnas.051611498. [DOI] [PMC free article] [PubMed] [Google Scholar]
- 15.Ayala F J. BioEssays. 1999;21:71–75. doi: 10.1002/(SICI)1521-1878(199901)21:1<71::AID-BIES9>3.0.CO;2-B. [DOI] [PubMed] [Google Scholar]
- 16.Rodríguez-Trelles F, Tarrío R, Ayala F J. Proc Natl Acad Sci USA. 2001;98:11405–11410. doi: 10.1073/pnas.201392198. [DOI] [PMC free article] [PubMed] [Google Scholar]
- 17.Jones D T, Taylor W R, Thornton J M. Comput Appl Biosci. 1992;8:275–282. doi: 10.1093/bioinformatics/8.3.275. [DOI] [PubMed] [Google Scholar]
- 18.Yang Z, Nielsen R, Hasegawa M. Mol Biol Evol. 1998;15:1600–1611. doi: 10.1093/oxfordjournals.molbev.a025888. [DOI] [PubMed] [Google Scholar]
- 19.Zhang J, Gu X. Genetics. 1998;149:1615–1625. doi: 10.1093/genetics/149.3.1615. [DOI] [PMC free article] [PubMed] [Google Scholar]
- 20.Yang Z. Comput Appl Biosci. 1997;13:555–556. doi: 10.1093/bioinformatics/13.5.555. [DOI] [PubMed] [Google Scholar]
- 21.Dobzhansky Th, Ayala F J, Stebbins G L, Valentine J W. Evolution. San Francisco: W. H. Freeman; 1977. [Google Scholar]
- 22.Scherer S. Mol Biol Evol. 1989;6:436–441. doi: 10.1093/oxfordjournals.molbev.a040561. [DOI] [PubMed] [Google Scholar]
- 23.Robinson M, Gouy M, Gautier C, Mouchirod D. Mol Biol Evol. 1998;15:1091–1098. doi: 10.1093/oxfordjournals.molbev.a026016. [DOI] [PubMed] [Google Scholar]
- 24.Bromham L, Penny D, Rambaut A, Hendy M D. J Mol Evol. 2000;50:296–301. doi: 10.1007/s002399910034. [DOI] [PubMed] [Google Scholar]


