Water temperature in Pensacola (FL) in May
Is it warm enough to swim in Pensacola in May? Average water temperature in Pensacola in May is 76.8°F and therefore suitable for comfortable swimming. The warmest sea in Pensacola in May is 84.6°F, and the coldest is 70.2°F. Average high air temperature in Pensacola in May is 83°F, and average low temperature is 66°F. To find out the sea temperature today and in the coming days, go to Current sea temperature in Pensacola
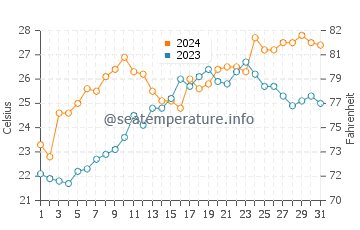
Changes water temperature in Pensacola in May 2024, 2023
To get an accurate forecast for the water temperature in Pensacola for any chosen month, compare two years within a 10 year range using the chart below. In addition to the sea water temperature in Pensacola, the selected years in the table also show the values of the maximum and minimum temperatures on each of the days of May.
You can choose any other years:
| Day | 2024 | 2023 | Min | Max |
|---|---|---|---|---|
| May 1 | 73.9°F | 71.8°F | 71.1°F | 75.4°F |
| May 2 | 73°F | 71.4°F | 70.9°F | 75.4°F |
| May 3 | 76.3°F | 71.2°F | 71.2°F | 76.3°F |
| May 4 | 76.3°F | 71.1°F | 71.1°F | 76.8°F |
| May 5 | 77°F | 72°F | 70.7°F | 78.4°F |
| May 6 | 78.1°F | 72.1°F | 70.5°F | 78.1°F |
| May 7 | 77.9°F | 72.9°F | 70.2°F | 77.9°F |
| May 8 | 79°F | 73.2°F | 70.9°F | 79°F |
| May 9 | 79.5°F | 73.6°F | 71.8°F | 79.5°F |
| May 10 | 80.4°F | 74.5°F | 72.3°F | 80.4°F |
| May 11 | 79.3°F | 76.1°F | 71.8°F | 79.3°F |
| May 12 | 79.2°F | 75.4°F | 71.2°F | 79.7°F |
| May 13 | 77.9°F | 76.6°F | 72.3°F | 80.2°F |
| May 14 | 77.2°F | 76.6°F | 72.3°F | 80.6°F |
| May 15 | 77.2°F | 77.4°F | 72.7°F | 80.4°F |
| Day | 2024 | 2023 | Min | Max |
|---|---|---|---|---|
| May 16 | 76.6°F | 78.8°F | 73.6°F | 81.3°F |
| May 17 | 78.8°F | 78.3°F | 73.8°F | 81.3°F |
| May 18 | 78.1°F | 79°F | 73.9°F | 81°F |
| May 19 | 78.4°F | 79.5°F | 73.9°F | 81.3°F |
| May 20 | 79.5°F | 78.6°F | 74.3°F | 81.5°F |
| May 21 | 79.7°F | 78.4°F | 74.1°F | 81.5°F |
| May 22 | 79.7°F | 79.3°F | 74.3°F | 81.5°F |
| May 23 | 79.3°F | 80.1°F | 74.3°F | 82°F |
| May 24 | 81.9°F | 79.2°F | 75°F | 82°F |
| May 25 | 81°F | 78.3°F | 75°F | 82.9°F |
| May 26 | 81°F | 78.3°F | 75.4°F | 84.4°F |
| May 27 | 81.5°F | 77.5°F | 75.7°F | 84.6°F |
| May 28 | 81.5°F | 76.8°F | 76.1°F | 82.8°F |
| May 29 | 82°F | 77.2°F | 75.9°F | 83.1°F |
| May 30 | 81.5°F | 77.5°F | 76.1°F | 84.2°F |
| May 31 | 81.3°F | 77°F | 76.1°F | 84°F |
Average water temperature in Pensacola in May over a decade
| 2015 | 2016 | 2017 | 2018 | 2019 |
| 77.7°F | 77°F | 76.5°F | 78.8°F | 78.8°F |
| 2020 | 2021 | 2022 | 2023 | 2024 |
| 75.7°F | 74.8°F | 77.7°F | 76.1°F | 78.8°F |
Pensacola sea state in May
Chart comparing the height of waves in Pensacola in May over the past years. The red line indicates the height of the waves when swimming in the sea is prohibited. To view the current sea conditions, click on the graph.

Weather and climate in Pensacola in May
This data display average monthly climate indicators in Pensacola in May based on our historical weather readings over a period of ten years. In addition to temperature, we include data on the number of rainy and sunny days so you can have all the information about your destination before your trip
- Average HIGH temperature83°F
- Average LOW temperature66°F
- Average rainfall days7 days
- Average rainfall107mm/4.2''
- Average daylight14h
- Average sunshine9h
- Average UV index10
Pensacola water temperature during other months:
You can also view information about water temperature for other months by clicking on the month button below
Temperature in neighboring cities
The nearest locations with the average water temperature in May. In addition, the maximum and minimum water temperatures for that month, recorded over the last decade, are shown
| Avr | Min | Max | |
|---|---|---|---|
| Gulf Breeze | 76.8°F | 70.2°F | 84.7°F |
| Warrington | 77°F | 70°F | 85.1°F |
| Oriole Beach | 76.6°F | 70.3°F | 84.6°F |
| East Pensacola Heights | 77.2°F | 70°F | 85.6°F |
| Tiger Point | 76.6°F | 70.2°F | 84.7°F |
| Perdido Key | 77°F | 70.2°F | 85.1°F |
| Woodlawn Beach | 76.8°F | 70.2°F | 85.3°F |
| Holley | 76.6°F | 70.2°F | 84.7°F |
| Bagdad | 77°F | 70°F | 87.1°F |
| East Milton | 77°F | 70°F | 87.1°F |
Florida Gulf Coast photo gallery


If you have interesting photos of this place, you can upload them here. Photos will be available to all users after verification by the moderator.
Vote for Florida Gulf Coast best beach
 Warning! Possible Rip Currents swim with care
This place is subject to rip currents (fast moving outward water)
Current rating: 5,0  (2 votes cast)
If you know this place (Pensacola) and want to leave your comment or rate it, then fill out the following form.
Get widget or API for your website
Our report for Pensacola is compiled using satellite data together with in-situ observations to get the most reliable daily data of sea surface temperatures, surf forecasts, current temperatures and weather forecasts.
