CHAPTER 2 QUALITY OF HUMAN LIFE INDEX SR


- Slides: 42

CHAPTER 2 QUALITY OF HUMAN LIFE

INDEX SR. NO. PARTICULARS 1 INTRODUCTION 2 P. Q. L. I. 3 ADVANTAGES AND LIMITATIONS OF P. Q. L. I. 4 HUMAN DEVELOPMENT 5 H. D. I. 6 CLASSIFICATION ON BASIS OF H. D. I. 7 LIMITATIONS OF H. D. I. 8 H. D. I. OF INDIA

INTRODUCTION A country is formed by the people living in it. When it is said that there is development in the economy, it should obviously mean that the quality of life of the people in the economy is improving. Previously, economic development of any country was measured by gross national product and per capita income. However, other factors were completely ignored and only monetary or economic aspect was given extreme importance.

INTRODUCTION Many economists have been trying to constantly search for a wider socio-economic yardstick (measure) to measure economic development in terms of quality of life. Recently there are two approaches developed by economist to measure economic development in terms of quality of life: 1. Physical quality of life Index (P. Q. L. I) 2. Human Development Index (H. Q. 1)

Physical Quality of Life Index (P. Q. L. I. ) Quality of life refers to overall well-being of people of a country. It does not depend on economic factors but on socio-political factors like: Ø Environment Ø Social security Ø National security Ø Political freedom Ø Overall infrastructure

Physical Quality of Life Index (P. Q. L. I. ) Physical Quality of Life Index (P. Q. L. I) was developed by famous economist Morris David in 1979 for 23 developed and developing countries. Morris David used the following three indicators to prepare a composite index known as Physical Quality of Life Index: 1. Life Expectant Rate (L. E. I) 2. Infant Mortality Rate (I. M. I) 3. Basic Literacy Rate (B. L. I)

Physical Quality of Life Index (P. Q. L. I. ) 1. Life Expectant Rate (L. E. I): Life expectancy means average number of year a person is expected to live. As per census of 2011, it is 66. 8 years in India. 2. Infant Mortality Rate (I. M. I): It refers to the number of infants dying within one year of their birth out of every 1000 births. As per census report of 2011, it is 47 per 1000. Higher infant mortality is harmful for economic development. 3. Basic Literacy Rate (B. L. I): Any person above the age of 7 year who can read and write in any one language with an ability to understand it is considered as literate. As per census 2011, it is 74. 04% in India.

Physical Quality of Life Index (P. Q. L. I. ) For each of the above indicator, the performance of individual country is rated on a scale of 1 to 100 where 1 represents the worst performance and 100 represent the best performance. P. Q. L. I is then constructed by averaging these three indicators giving equal weight to each of them. Morris David has given following formula to obtain P. Q. L. I = L. E. I. + I. M. I. + B. L. I. 3

Physical Quality of Life Index (P. Q. L. I. ) Example: Suppose, the L. E. I. for India is rated as 75, the I. M. I is rated as 40 and B. L. I. is rated as 65, then the P. Q. L. I will be 60. [(75+40+65)/3]

Advantages and limitations of P. Q. L. I. Advantage of P. Q. L. I : (Smart Code: AHEAD) 1. Aspect of welfare has been considered 2. Helps the government for analysis 3. Easy to compare 4. Also Considers Distribution 5. Data required is easily available Limitation of P. Q. L. I (Smart Code : MAN) 1. Many other factors have been ignored 2. All factors have been given equal importance 3. Not a proper measure of economic development

Advantages 1. Aspect of welfare has been considered The three indicator i. e. life expectancy rate, infant mortality rate and literacy rate very well represent the welfare of the people of the country. A country wherein all the three indicators are good can be said to be a developed economy.

Advantages 2. Helps the government for analysis P. Q. L. I helps to government to understand the overall welfare in the economy and how well its welfare policies are being implemented. This helps the government to take corrective action.

Advantages 3. Easy to compare The method followed to measure P. Q. L. I is standard for all the countries. Therefore, it can be used to make comparison between countries and this helps the relatively underdeveloped countries to take corrective measure.

Advantages 4. Also considers distribution The P. Q. L. I considers the distribution of welfare in the country. A country cannot have a high average of literacy rate, life expectancy and low infant mortality rate unless a large part of the population is covered by the benefits of economic development.

Advantages 5. Data required is easily available The data relating to all the three indicators is easily available in the census report. Therefore, measurement of P. Q. L. I is a simple.

Limitations 1. Many other factors have been ignored P. Q. L. I ignores many factors which influence the quality of life such as employment, housing, justice, social security as well as human rights.

Limitations 2. All factors have been given equal importance P. Q. L. I is a simple average of literacy rate, infant mortality rate and life expectancy rate i. e. all the factors have been giving equal weightage. However, it is difficult to understand the rationale behind giving equal importance to all factors.

Limitations 3. Not a proper measure of economic development P. Q. L. I. does not explain the structural change in the economy of a country. Moreover, it does not at all consider economic or monetary concept. Hence, it is a poor measure of economic development as well as economic growth. Inspite of these drawbacks, P. Q. L. I. is considered as an improvement over traditional measure of economic welfare. However, recently developed Human Development Index (HDI) is a better and more refined version of PQLI.

Human Development United Nations Development Programme has defined human development as a process of enlarging peoples’ choices and their level of well-being. According to Human Development Report, the three most important choices of people are: Ø To lead a long and healthy life Ø To acquire knowledge Ø To enjoy a decent standard of living. Human Development is measured by constructing Human Development Index (H. D. I)

Human Development The following is the importance of human development 1. It is an end 2. Helps to control population 3. Increases efficiency 4. Other resources are better utilized 5. The society becomes healthy and safe 6. Conservation of environment

Importance 1. It is an end Economic growth is the means and human development is an end. Economic growth enables an economy to improve human condition and enlarge the choices of the people which finally lead to their development.

Importance 2. Helps to control population Human development includes providing better education facilities. Educated people understand the benefits of having a small family. Increased medical facilities help to reduce the infant mortality rate.

Importance 3. Increases efficiency With human development, there is an improvement in health, nutrition and education. This helps to increase efficiency and productivity of labour.

Importance 4. Other resources are better utilized The utilization of resources highly depends on the efficiency of the human resource. Since, the efficiency of labour increases, other resources are also better utilized.

Importance 5. The society becomes healthy and safe Educated people who are bestowed with proper rights do not get involved in anti-social activities like riots, terrorism, robbery etc. Therefore, a safe and healthy society is created.

Importance 6. Conservation of environment Educated people are aware about the negative effect that over population, deforestation, heavy industrialization etc. have on the environment. Therefore, they make an extra effort to save the environment. Human development is extremely important and it depends on much more than just growth of income.

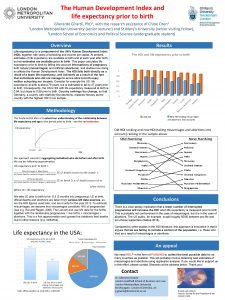
Human Development Index (H. D. I. ) Human Development is measured by constructing Human Development Index (H. D. I). The Human Development Index (HDI) is a composite statistic of life expectancy, education, and income indices used to rank countries. It was created by the Pakistani economist Mahbub ul Haq and the Indian economist Amartya Sen in 1990 and was published by the United Nations Development Programme.

Human Development Index (H. D. I. ) H. D. I. makes it clear that income cannot be considered as a yardstick for measuring human development because well-being depends on use of income and not on level of income. For constructing H. D. I, we have to prepare index number for each of the three dimensions of human development. Sr. No Dimension Index 1 Long and healthy life dimension Life Expectancy Index 2 Knowledge dimension Education Index 3 Standard of living dimension GDP per capita

Human Development Index (H. D. I. ) Note: Education index is weighted average of adult literacy rate as well as the primary, secondary and university enrollment ratio. In order to calculate the index, the following formula has been derived: Dimension Index = Actual Value – Minimum Value Maximum Value – Minimum Value

Human Development Index (H. D. I. ) For the purpose of maximum value and minimum value, the following table has been provided: Source : Human Development Report 2005. Indicators Life expectancy at birth (years) Adult literacy rate (%) Combined gross enrollment (%) GDP per capita (PPP US $) Maximum Value Minimum Value 85 25 100 0 100 0 40, 000 0

Human Development Index (H. D. I. ) For e. g. If the actual life expectancy in India is 66 years, then the life expectancy index will be calculated as follows: Life Expectancy Index = 66 -25 / 85 -25 = 41/60 = 0. 68 Finally, HDI is calculated by taking an average of three dimension indices: H. D. I. = Life Expectancy Index + Educational Index + GDP Index 3

Classification on basis of H. D. I. According to Human Development Report, 2005, different countries are classified in to 3 group of the basis of HDI in the following manner: Sr. No Group Range Example 1 High HD group 2 Medium HD group 3 Low HD group 0. 8 and above 0. 5 to 0. 8 Norway, USA, Japan China, Sri Lanka, India Less than 0. 5 Pakistan, Bangladesh

Limitations of H. D. I. Human Development is measured by constructing Human Development Index (H. D. I). The Human Development Index (HDI) is a composite statistic of life expectancy, education, and income indices used to rank countries. The following are the limitation of HDI: 1. Many factors are ignored 2. Problem of inequality is ignored 3. Imperfect Index 4. Arbitrary use of weights

Limitations 1. Many factors have been ignored Some critics are of view that many indicators of human development such as infant mortality, nutrition, security are totally neglected.

Limitations 2. Problem of inequality is ignored Since HDI is an overall average, it reflects the entire economy as a whole. HDI of a country neglects the problem of inequality. It treats all people and all regions at par.

Limitations 3. Imperfect index According to Prof. Amartya Sen, a Nobel Laureate, the HDI is an imperfect index which tries to catch complex reality of human development in one simple number.

Limitations 4. Arbitrary use of weights The HDI uses weighted average but it does not have any fruitful impact on measurement. The use of weights is arbitrary.

Human Development Index of India Ø India ranks 136 among 186 countries on its Human Development Index (HDI) as per the Human Development Report 2013 published by the United Nations. Ø The HDI value of India is 0. 647. Ø China has been ranked much higher than India. Ø The reason for the low ranking is obvious as India compares poorly with other countries on indicators such as life expectancy, education and per capita income.

Human Development Index of India The following are the indicators for India: 1. Life Expectancy – As per the Human Development Report, 2011, the life expectancy in India is 65. 8 years (65. 77 for males, and 67. 95 year for females). When compared to European countries, it is very low. 2. Literacy Rate – The literacy rate in India in 2011 was 74. 4% (82. 14% for males and 65. 45% for females). This is much lesser than developed nations. Also, average number of a years spent by a person in school is 10. 3 years in India compared to global average of 15 years.

Human Development Index of India 1. Poverty – There are still 400 million people in India below the poverty line. A lot of people do not have access to clean water and proper sanitation facilities.

Human Development Index of India Over 20 years since the beginning in 1990, HDI value has increased more than double i. e. from 0. 301 to 0. 647. We are currently in the medium HDI group and it will take us a long time to reach the high HDI group. Human Development Index Value In India (only for your reference) Source – Human Development Index Report 2013. Year 1990 2002 2010 HDI Value 0. 301 0. 577 0. 647

 Compare india and sri lanka on the basis of hdi
 Human development index definition ap human geography
 Optical fibre
 Dense index vs sparse index
 Bacteriological index vs morphological index
 Waveguide in optical fiber
 Simpson's diversity index worksheet answers
 Liquid limit of soil formula
 Clustered index và non clustered index
 Air quality index calculation
 A universal image quality index
 Icrg dataset free download
 Dr zhou wang
 8.3 human needs
 Chapter 8 human needs and human development
 Quality control and quality assurance
 Pmp quality vs grade
 Quality metrics pmp
 Define quality assurance in nursing
 Compliance vs quality
 Quality assurance vs quality control
 Quality management gurus
 Crosby quality is free
 What is tqm
 Gewandorf
 Human development index rwanda
 Human potential index
 Human poverty index calculation
 The medullary index of human hair is _____.
 Indikator sejahtera
 Human development index 2018
 What is human development
 What is human development index
 Apa itu quality of life
 Quality is a way of life
 European quality of life
 Ubi comp
 Quality of life inventory (qoli)
 Quality of life plus
 Human vs non human bones
 Non human nouns
 Index of it chapter 1
 Index of it chapter 1

