Water Quality Management in Rivers Dissolved Oxygen Depletion


- Slides: 36

Water Quality Management in Rivers

Dissolved Oxygen Depletion

Biochemical Oxygen Demand Measurement • Take sample of waste; dilute with oxygen saturated water; add nutrients and microorganisms (seed) • Measure dissolved oxygen (DO) levels over 5 days • Temperature 20° C • In dark (prevents algae from growing) • Final DO concentration must be > 2 mg/L • Need at least 2 mg/L change in DO over 5 days

Example • A BOD test was conducted in the laboratory using wastewater being dumped into a Lake. The samples are prepared by adding 3. 00 m. L of wastewater to the 300. 0 m. L BOD bottles. The bottles are filled to capacity with seeded dilution water.

Example : Raw Data

Example : Calculations • What is the BOD 5 of the sample? • Plot the BOD with respect to time.

Example : Time – Concentration Plot

Modeling BOD as a First-order Reaction Organic matter oxidized Organic matter remaining

Modeling BOD Reactions • Assume rate of decomposition of organic waste is proportional to the waste that is left in the flask.

Lo Lo- Lt BOD exerted BODt Lt L remaining

Ultimate Biochemical Oxygen Demand Lt = amount of O 2 demand left in sample at time, t Lo = amount of O 2 demand left initially (at time 0, no DO demand has been exerted, so BOD = 0) At any time, Lo = BODt + Lt (that is the amount of DO demand used up and the amount of DO that could be used up eventually) Assuming that DO depletion is first order BODt = Lo(1 - e-kt)

Example • If the BOD 5 of a waste is 102 mg/L and the BOD 20 (corresponds to the ultimate BOD) is 158 mg/L, what is k?

Example (cont)

Biological Oxygen Demand: Temperature Dependence • Temperature dependence of biochemical oxygen demand !As temperature increases, metabolism increases, utilization of DO also increases kt = k 20 T-20 = 1. 135 if T is between 4 - 20 o. C = 1. 056 if T is between 20 - 30 o. C

Example The BOD rate constant, k, was determined empirically to be 0. 20 days-1 at 20 o. C. What is k if the temperature of the water increases to 25 o. C? What is k if the temperature of the water decreases to 10 o. C?

Example

Nitrogenous Oxygen Demand • So far we have dealt only with carbonaceous demand (demand to oxidize carbon compounds) • Many other compounds, such as proteins, consume oxygen • Mechanism of reactions are different

Nitrogenous Oxygen Demand • Nitrification (2 step process) 2 NH 3 + 3 O 2 2 NO 2 - + 2 H+ + 2 H 2 O 2 NO 2 - + O 2 2 NO 3– Overall reaction: NH 3 + 2 O 2 NO 3 - + H+ + H 2 O • Theoretical NBOD =

Nitrogenous Oxygen Demand

Nitrogenous oxygen demand • Untreated domestic wastewater ultimate-CBOD = 250 - 350 mg/L ultimate-NBOD = 70 - 230 mg/L Total Kjeldahl Nitrogen (TKN) = total concentration of organic and ammonia nitrogen in wastewater: 15 - 50 mg/L as N Ultimate NBOD 4. 57 x TKN

Other Measures of Oxygen Demand

Chemical Oxygen Demand • Chemical oxygen demand - similar to BOD but is determined by using a strong oxidizing agent to break down chemical (rather than bacteria) • Still determines the equivalent amount of oxygen that would be consumed • Value usually about 1. 25 times BOD

Water Quality Management in Rivers

Dissolved Oxygen Depletion

Dissolved Oxygen Sag Curve

Mass Balance Approach • Originally developed by H. W. Streeter and E. B. Phelps in 1925 • River described as “plug-flow reactor” • Mass balance is simplified by selection of system boundaries • Oxygen is depleted by BOD exertion • Oxygen is gained through re-aeration

Steps in Developing the DO Sag Curve 1. Determine the initial conditions 2. Determine the re-aeration rate from stream geometry 3. Determine the de-oxygenation rate from BOD test and stream geometry 4. Calculate the DO deficit as a function of time 5. Calculate the time and deficit at the critical point

Selecting System Boundaries

Initial Mixing Qw = waste flow (m 3/s) DOw = DO in waste (mg/L) Lw = BOD in waste (mg/L) Qr = river flow (m 3/s) DOr = DO in river (mg/L) Lr = BOD in river (mg/L) Qmix = combined flow (m 3/s) DO = mixed DO (mg/L) La = mixed BOD (mg/L)

1. Determine Initial Conditions a. Initial dissolved oxygen concentration b. Initial dissolved oxygen deficit where D = DO deficit (mg/L) DOs = saturation DO conc. (mg/L)

1. Determine Initial Conditions c. DOsat is a function of temperature. Values can be found in Table. Initial ultimate BOD concentration

2. Determine Re-aeration Rate a. O’Connor-Dobbins correlation where kr = reaeration coefficient @ 20ºC (day-1) u = average stream velocity (m/s) h = average stream depth (m) b. Correct rate coefficient for stream temperature where Θ = 1. 024

Determine the De-oxygenation Rate a. rate of de-oxygenation = kd. Lt where kd = de-oxygenation rate coefficient (day-1) Lt = ultimate BOD remaining at time (of travel downstream) t b. If kd (stream) = k (BOD test) and

3. Determine the De-oxygenation Rate c. However, k = kd only for deep, slow moving streams. For others, where η = bed activity coefficient (0. 1 – 0. 6) d. Correct for temperature where Θ = 1. 135 (4 -20ºC) or 1. 056 (20 -30ºC)

4. DO as function of time • Mass balance on moving element • Solution is

5. Calculate Critical time and DO
 Turbid definition
 Why are some rivers in texas called “wrong way” rivers?
 Dissolved oxygen and chlorine molecules act as
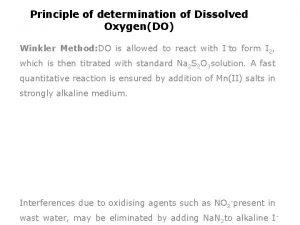
 Principle of winkler's method
 Dissolved oxygen in air
 Winkler titration
 What is dissolved oxygen
 Water and water and water water
 Salt dissolved in water
 Chlorine and water equation
 Is sucrose soluble in water
 Sodium carbonate dissolved in water
 Enthalpy specific heat equation
 Water contracts (gets smaller) when it freezes.
 Lettuce scheduling
 Objectives of irrigation
 Holy spirit rivers of living water
 Lateral thinking brain teasers
 Water quality management in india
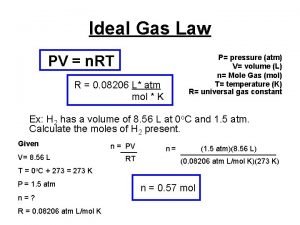
 Ideal gas law find n
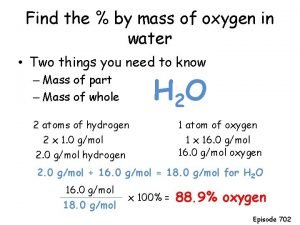
 Mass of oxygen in water
 Effect of ozone depletion on plants
 Baumeister self control
 Depletion formula
 Ozone depletion effect on humans
 Ece 424
 Serhiy levkov
 Depletion of animals
 Ch14 twitch
 Journal entry for revaluation of assets
 Ozone layer
 Ozone layer depletion introduction
 Stratospheric ozone depletion
 Chapter 11 depreciation
 Mosfet accumulation depletion inversion
 Depletion
 Ozone depletion diagram

