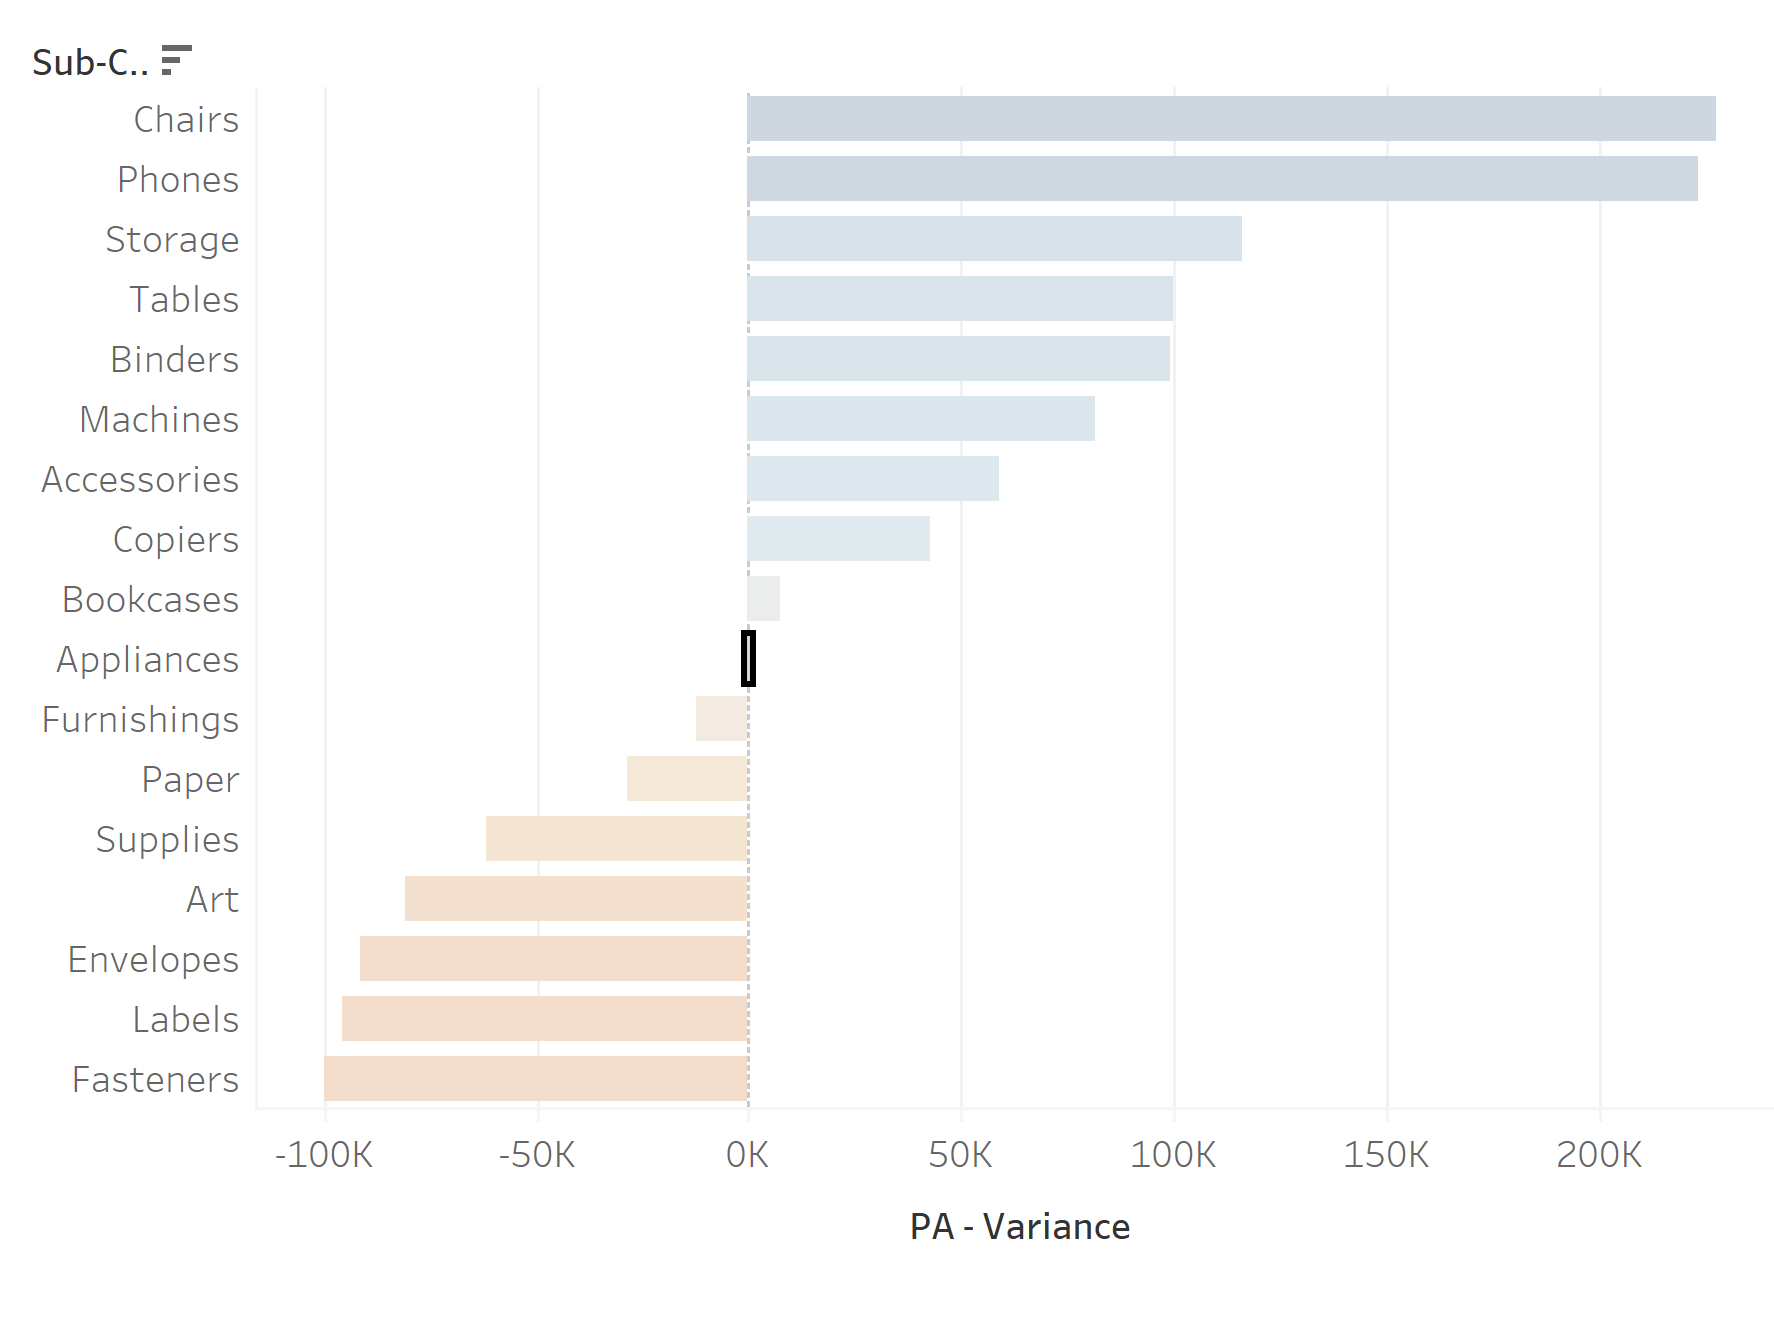
This blog will show how to reorder your bar chart by selecting a category:
0:00
/
Create Using a Set Action
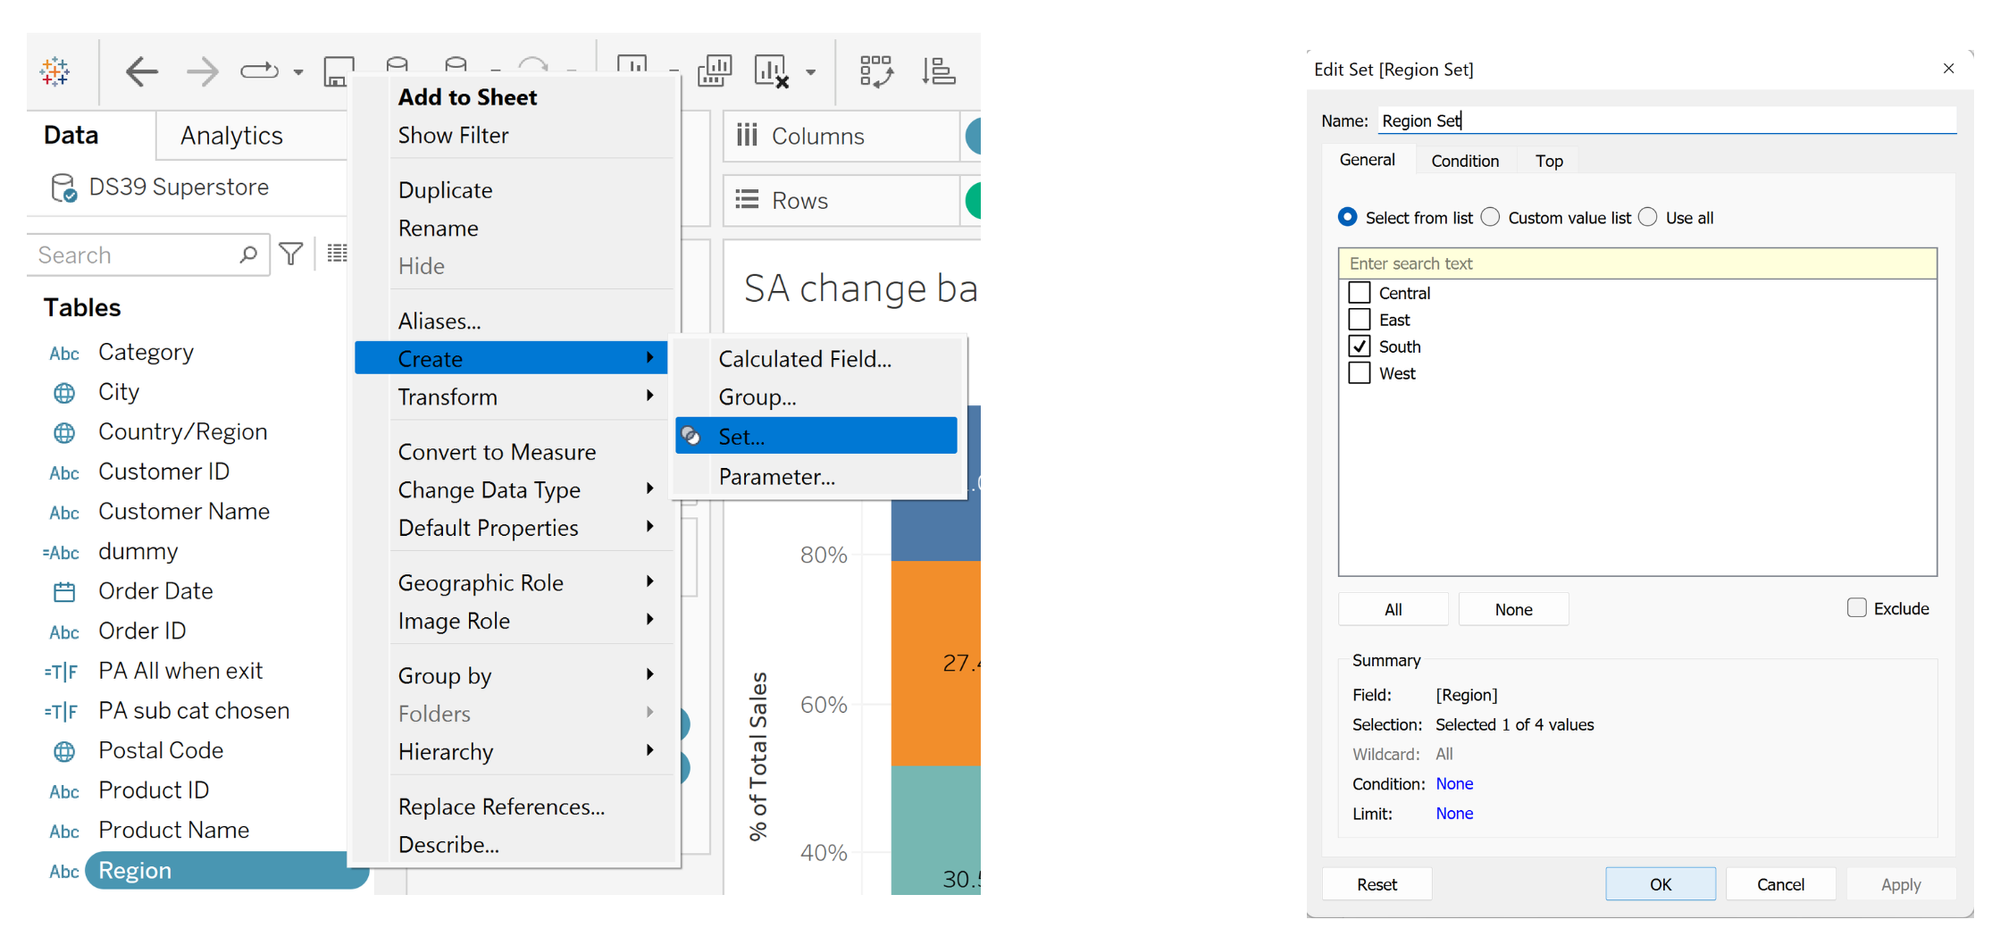
- Create a region set and add any member to it :
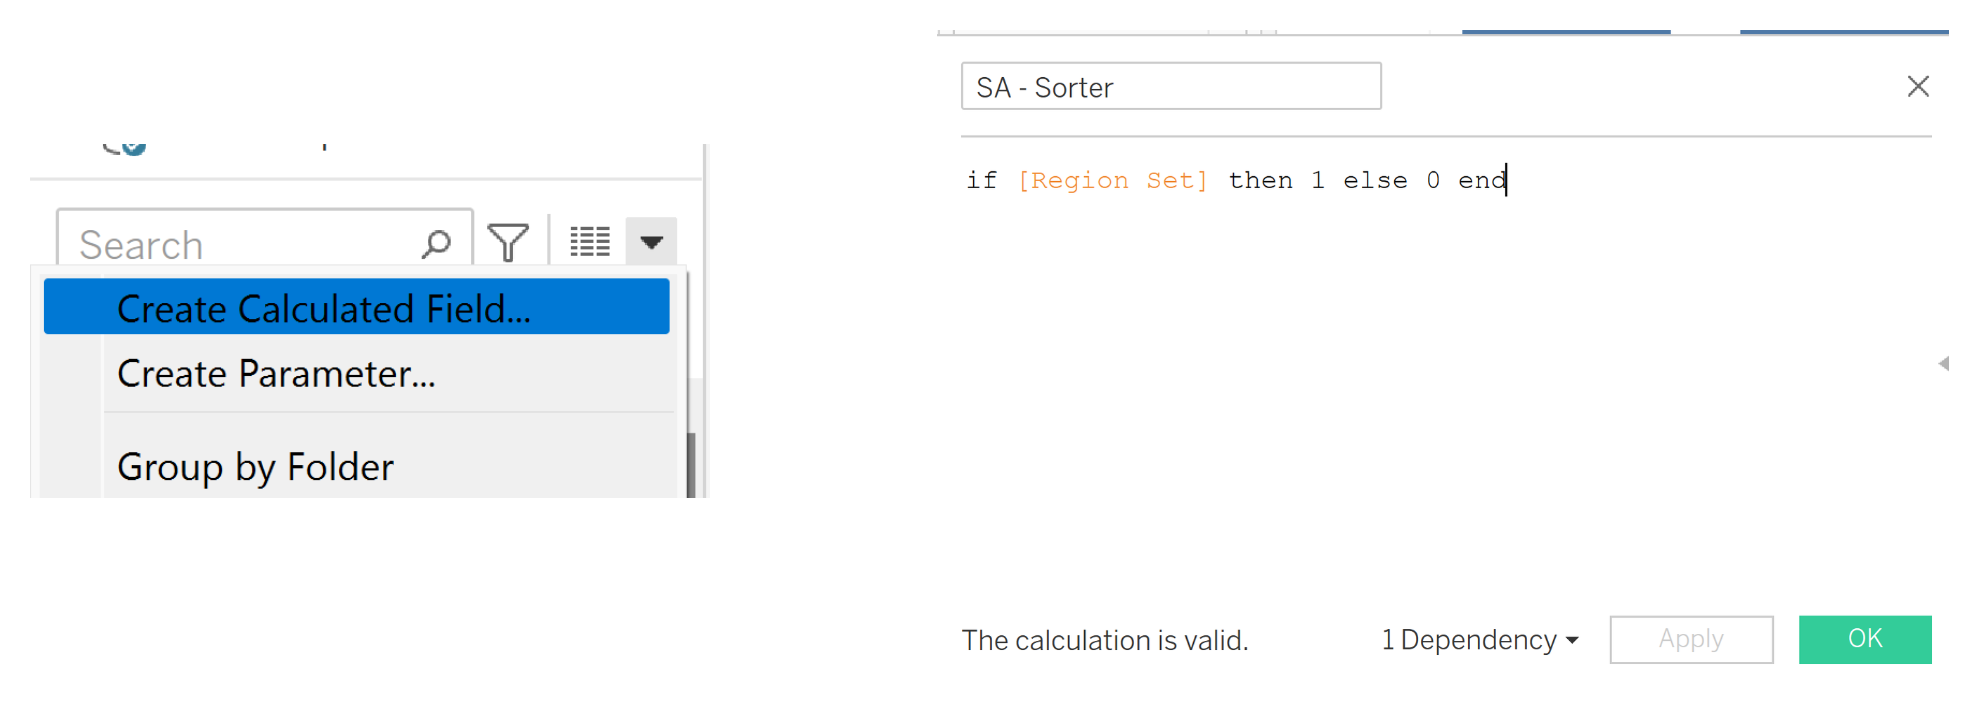
2. Create a calculated field that will determine the reorder:
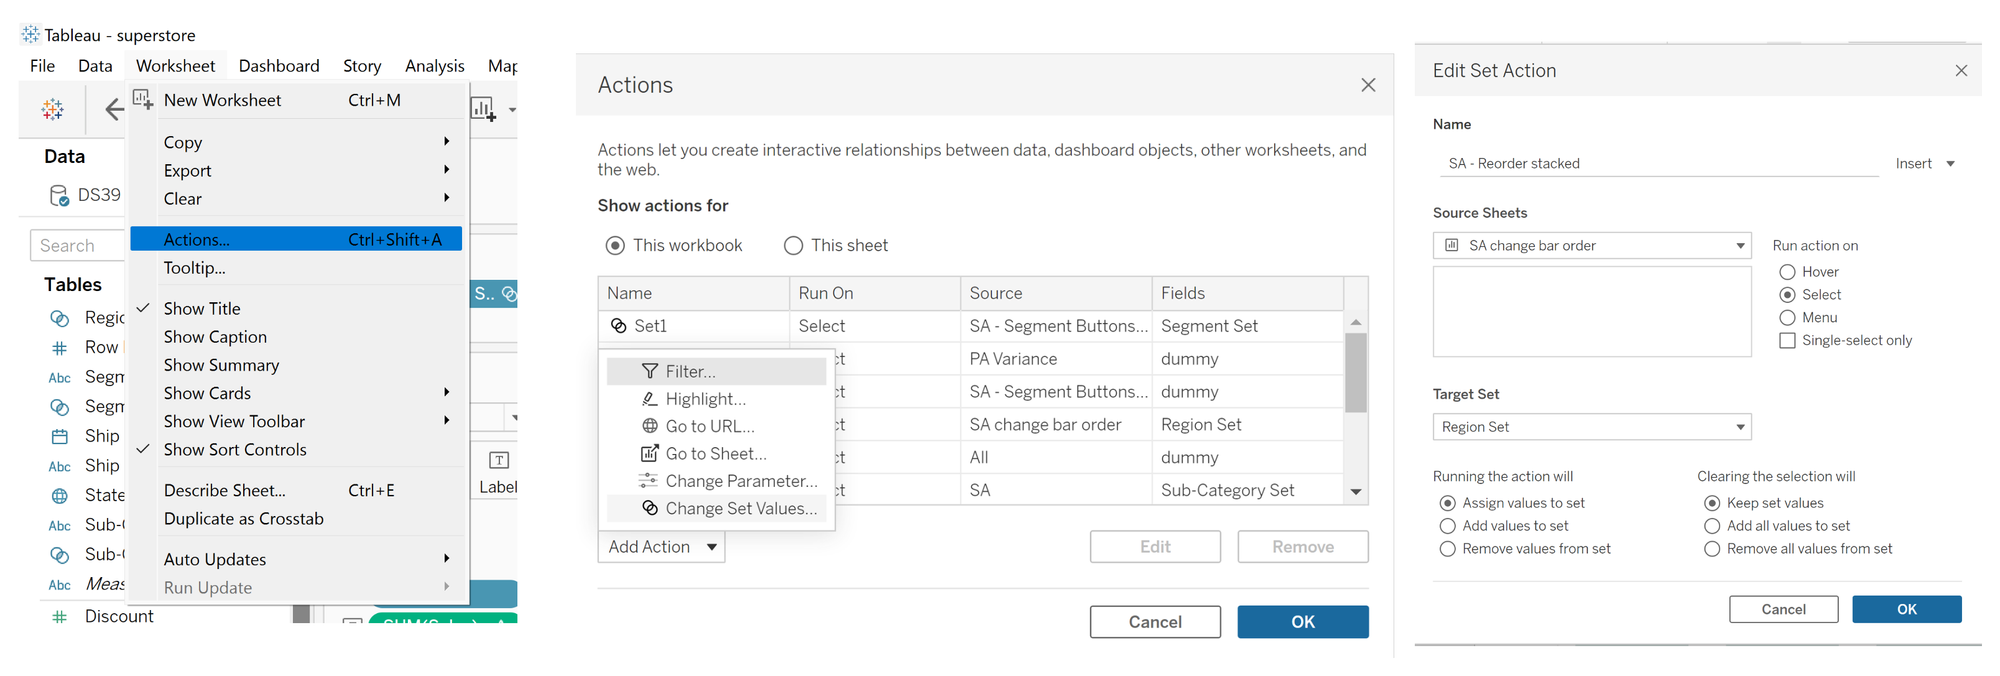
3. Add a set action:
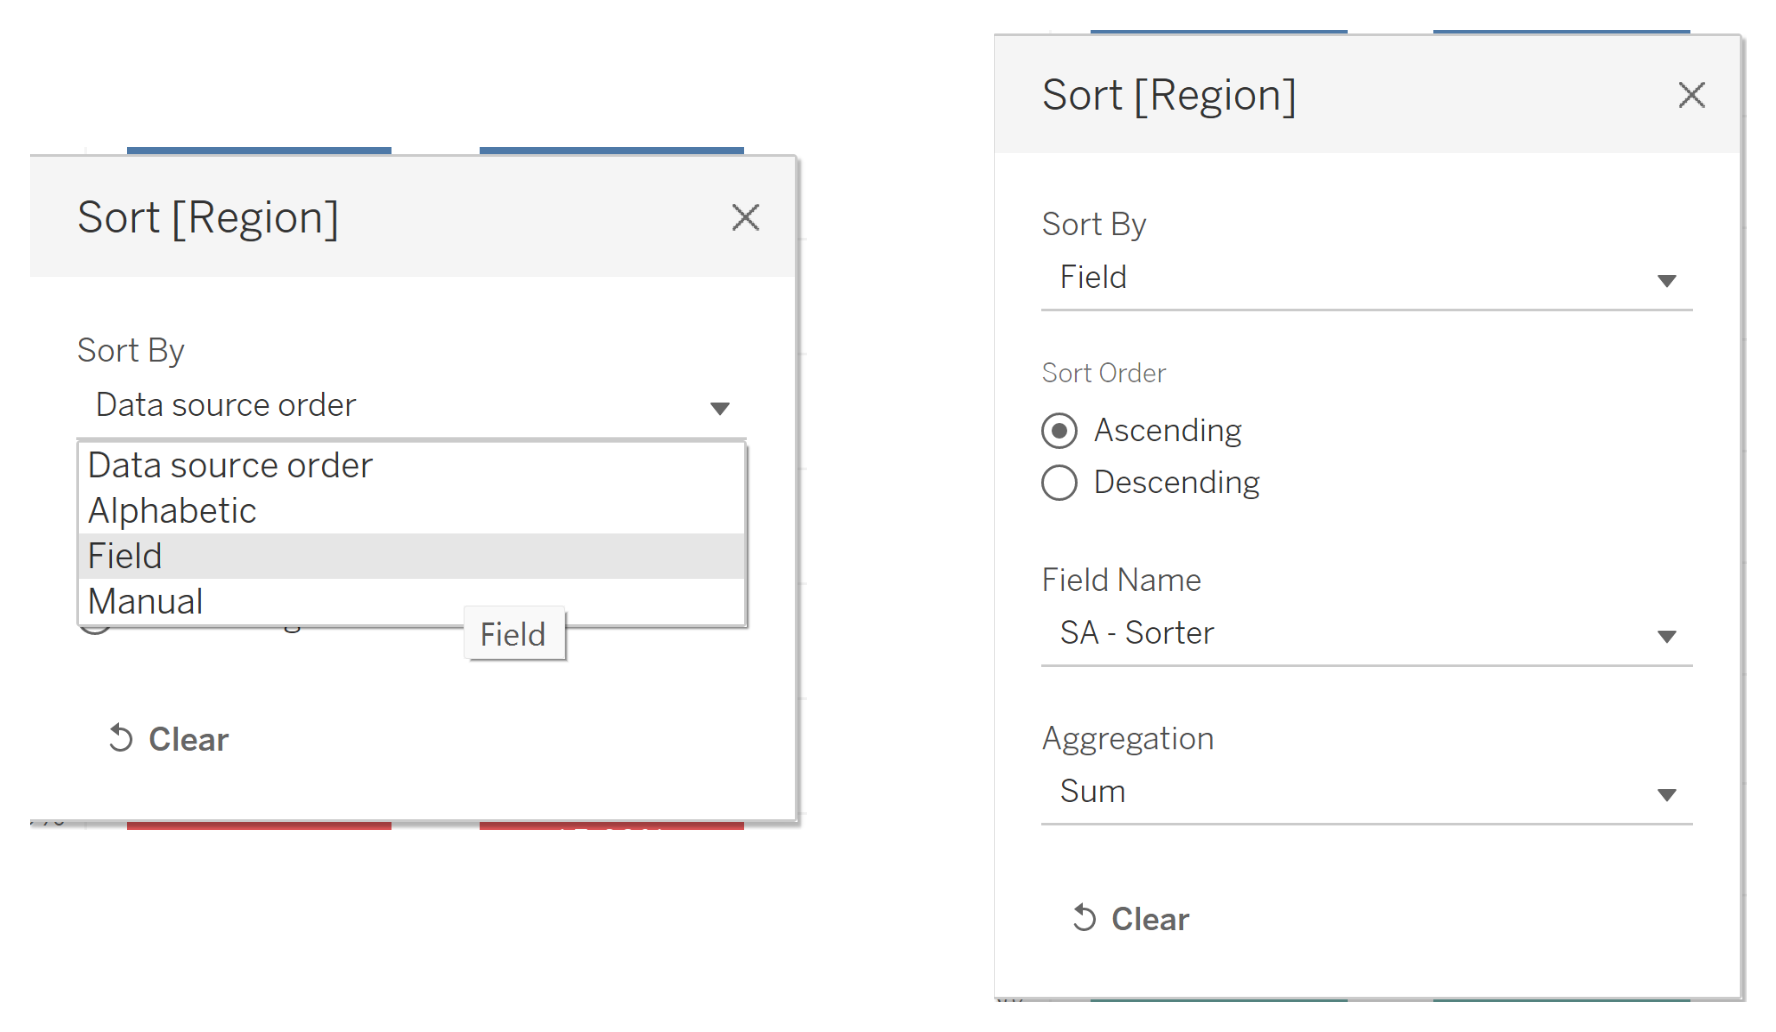
4. Click on region and go to sort, then configure as follows:
You may notice that when you click on a bar, it washes out everything else. To remove this, check out my blog on creating a dummy highlight:
The Data School - Dummy Highlight