Abstract
Purpose
An algorithm for diagnostic system with neural network is developed for diagnosis of dental caries in digital radiographs. The diagnostic performance of the designed system is evaluated.
Methods
The diagnostic system comprises of Laplacian filtering, window based adaptive threshold, morphological operations, statistical feature extraction and back-propagation neural network. The back propagation neural network used to classify a tooth surface as normal or having dental caries. The 105 images derived from intra-oral digital radiography, are used to train an artificial neural network with 10-fold cross validation. The caries in these dental radiographs are annotated by a dentist. The performance of the diagnostic algorithm is evaluated and compared with baseline methods.
Results
The system gives an accuracy of 97.1%, false positive (FP) rate of 2.8%, receiver operating characteristic (ROC) area of 0.987 and precision recall curve (PRC) area of 0.987 with learning rate of 0.4, momentum of 0.2 and 500 iterations with single hidden layer with 9 nodes.
Conclusions
This study suggests that dental caries can be predicted more accurately with back-propagation neural network. There is a need for improving the system for classification of caries depth. More improved algorithms and high quantity and high quality datasets may give still better tooth decay detection in clinical dental practice.
Keywords: Computer assisted diagnosis, Dental caries, Machine learning, Back propagation neural network
Introduction
A large percentage of adults are now a days affected by dental caries. Accuracy of early diagnosis of dental caries is still a challenging problem for dentists [1, 2]. Existing caries detection systems are not fully accepted by the practicing dentists and results are not fully accurate. The main limitations of diagnostic caries monitor are false positive diagnosis due to accumulation of food debris and plaque, staining of tooth and hypo mineralization results in wrong diagnosis. Electrical Caries Monitor (ECM) gives high false positive result for stained teeth, limit its usage. The main demerit of Direct Image Fibre Optic Trans-illumination (DIFOTI) is dentists must interpret images and it uses expensive machinery. Quantitative Light-induced Fluorescence (QLF) uses a complex procedure and demerit of this is initially dentist must detect the caries by manual examination. Hidden caries cannot be identified in photographic images. This works only on the surface of the tooth enamel and it is unable to detect caries which are in between the tooth and depth of caries. Analog radiography uses relatively high dose of ionised radiation that are injurious to health. Moreover, dentist must interpret images to detect caries.
Now a days, despite available highly reliable diagnostic tools, dental probe and digital radiography are widely used for screening and final diagnosis of dental caries. Dentist inspect caries on tooth surfaces by observation of texture and discoloration using visual tactile method [3]. This method is highly subjective, based on dentist’s expertise [4–6]. Hence it is necessary to implement an efficient, fully automatic and accurate dental caries detection algorithm.
Digital radiographs are helpful in dental abnormalities such as caries detection and for dental procedures because the images are available immediately and these images use relatively low level of radiation exposure. [7]. Since it uses low amount of radiation, the quality of the image is not quite clear, results in false negative recording. As the digital radiographs are very noisy, not easier to locate the edges. Quantum, photonic, electronic and quantization noise degrade dental radiographic image [8]. Dental radiographic image analysis due to image noise and low contrast make the problem further complex. For simultaneous improvement in contrast and intensity computer supported image processing algorithms are used [9]. Accurate and precise caries detection is essential for treatment of dental caries because teeth and bone areas in the images appear similar. But with the usage of engineering tool, edges of the tooth become easier. These images are more convenient for computer assisted algorithm development for analysis of caries detection and treatment.
Segmentation of teeth is a significant problem due to teeth variation in shape and size, arrangement of teeth varies from person to person [10]. In previous works, morphological operators, watershed transformation, level set segmentation, iterative thresholding and adaptive thresholding methods are used for segmentation of dental radiographs [11–14]. However, efficient operations are still not included in the existing software majorly used by dental practitioners. Hence, the effective benefits of these methods are still not available to the end users. No software exploits the power of AI tools and techniques such as neural network. The usage of such methods may help better in identification and diagnosis of dental caries [15].
Neural networks are the mathematical models that emulate the operation of the brain. It is a computing system made up of several highly interconnected processing elements. It processes the information given by external inputs and generate dynamic state response [16]. Variety of tasks of medical fields are already implemented using neural networks [17, 18] including medical diagnostics [19]. But the usage of neural networks in dentistry for caries detection is very limited [1]. Senthilkumaran presents a method of edge detection of dental X-ray image using neural network approach and Genetic algorithm [20, 21]. Yang Yu et al. and Ainas A. ALbahbah et al. used autocorrelation coefficient as feature parameters for tooth decay diagnosis using Back Propagation Neural Network (BPNN) [22, 23]. Suwadee Kosithowornchai et al. developed Linear Vector Quantization (LVQ) neural network for diagnosis of simulated dental caries [1].
This paper discusses about development of an algorithm for computer-based identification and confirmation of dental caries in dental radiographs applying image processing. The proposed method avoids subjective diagnosis; hence diagnosis is independent of visual errors. This would be helpful for medical practitioners as an add on approach for further identification and analysis. In this paper, a back propagation neural network is used to diagnose dental caries in periapical dental radiographs. The proposed method uses Laplacian filter for image enhancement, adaptive threshold for image segmentation, textural features extraction and BPNN for classification.
Methodology
The dataset used for training, validation and testing, consists of 49 caries and 56 sound dental X-ray images. The images analyzed in this work are obtained from SJM Dental College Chitradurga, India using intra oral Gendex X-ray machine with RVG sensor. This machine is directly connected to computer monitor and software provided by a German company called sirona. The images are taken for the purpose of orthodontics, periodontics or endodontics treatment and filling. The images were analysed by the clinician for caries. Observation and interpretation of the images for caries was carried out. The images were examined on the computer screen under optimal brightness and contrast. Caries was detected by interpreting the radiodensity of the images. Normal tooth enamel and dentin are radiopaque. Caries results in the loss of mineralisation of these structures and hence appears radiolucent. Diligent analysis of the images for this radiolucency gives the clinician a diagnostic criterion to term the tooth carious. This difference between the radio opacity of the normal tooth structure and the radiolucent appearance of caries allows a clear interpretation for the presence or absence of caries. Out of 105 dental X-ray images considered for study, dentist identified caries in 49 radiographs.
The dental X-ray images are saved as bmp files, resized to 256 × 256 of class double. The resized image is enhanced using Laplacian filter to get sharpened image. The edges of the image are highlighted, and low frequency components are removed. The algorithm used for segmentation using adaptive threshold and morphological processing is given in Table 1 [24]. The sharpened image is resized to 100 × 100 and each sub image is smoothened using Gaussian filter. This image is dilated and eroded. Then eroded image is subtracted from the dilated image to get the segmented image. This image is fed to feature extraction stage and sixteen statistical features are extracted [25]. The features extracted are contrast, correlation, energy, homogeneity, mean, standard deviation, entropy, Root Mean Square (RMS), variance, smoothness, kurtosis, skewness, Inverse Difference Moment (IDM), area, centroid and bounding box. These features are fed to BPNN for classification with 10-fold cross validation. BPNN classifier identifies the given test image as caries or normal image Fig. 1 shows the proposed methodology for identification of dental caries.
Table 1.
Algorithm used for segmentation of dental X-ray images [25]
| No. | Steps |
|---|---|
| 1 | Resize the image to 100 × 100 of class double, to get image1 |
| 2 | Compute fsize = fix(length(image1)/x) where fix rounds the value to the nearest integer towards zero. Vary x to get better performance (Typical value is 20). |
| 3 | Apply gaussian low pass filter of size 6 * fsize with standard deviation fsize for image1 to get image2 |
| 4 | Apply threshold to image2 with threshold = image2*(1 − t/100) to get image3 (typical value of t is 15) |
| 5 | Apply dilation to image3 using structural element b = [0 1 0;1 1 1;0 1 0] to get image4 |
| 6 | Apply erosion to image3 using structural element b = [0 1 0;1 1 1;0 1 0] to get image5 |
| 7 | Compute segmented_image = image4–image5 |
Fig. 1.
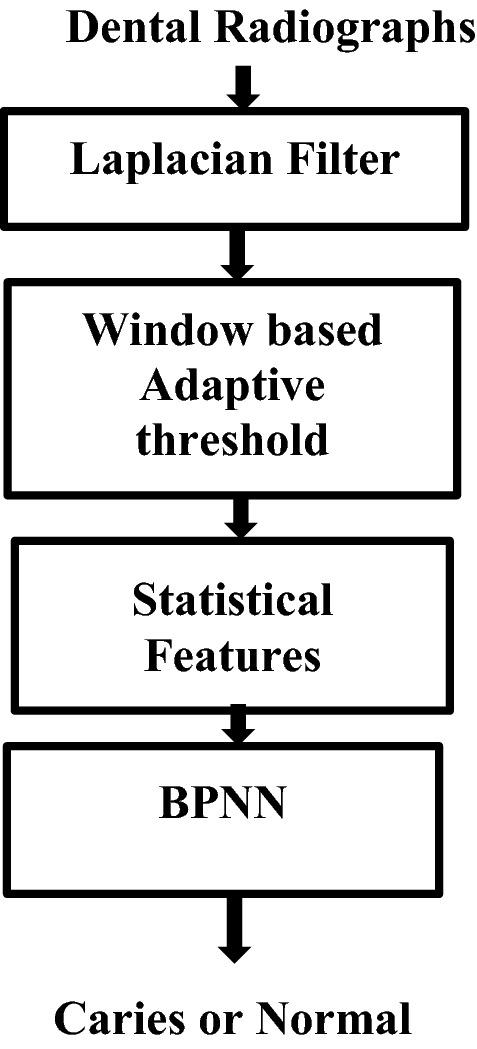
Proposed caries detection methodology
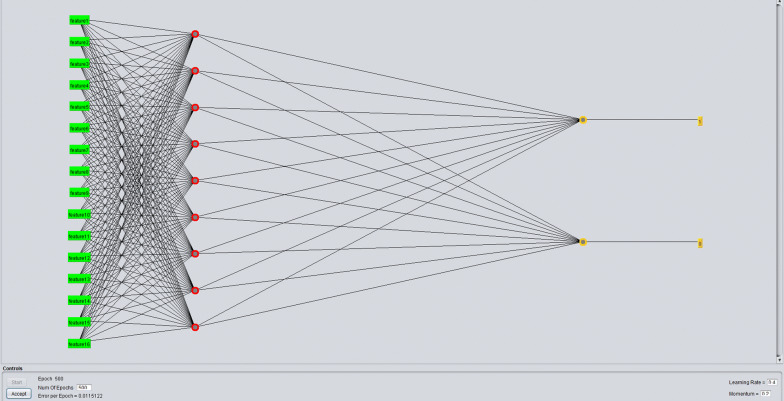
To reduce the computation time, it is required to use optimum number of nodes in each layer and optimum number of hidden layers. Hence it is necessary to determine the optimum number of hidden layers, the number of nodes in the input and output layer. Other design decision is to choose of activation function. In this study, sigmoid function is used as activation function because it is smooth, continuous and monotonically increasing function and it resembles to real neuron [26, 27]. Most of the pattern recognition problems gives very good classification accuracy with one or two layers. In this study FFBPNN with one hidden layer is used. The number of nodes in the hidden layer is equal to the average of the number of nodes present in the input and output layer. The inputs for the input layer nodes are the sixteen feature vectors extracted from segmented image. Hence, in this study, FFBPNN with sixteen input nodes is being used. The sixteen statistical features extracted from the segmented image are contrast, correlation, energy, homogeneity, mean, entropy, RMS, variance, smoothness, kurtosis, skewness, standard deviation, IDM, area and centroid. In this study, the ANN must differentiate the given dental radiograph as caries or normal. Hence output layer with two nodes are used. The target value set for caries as 1 and normal image as 0. Classification performance results were observed by varying number of nodes in the hidden layer, learning rate and number of iterations. The 16-9-2 ANN for caries detection is shown Fig. 2. The diagnostic performance of the system is evaluated using WEKA (Waikato Environment for Knowledge Analysis).
Fig. 2.
FFBPNN with 16 nodes, 1 hidden layer with 9 nodes and 2 output nodes used for dental caries detection
Results and discussion
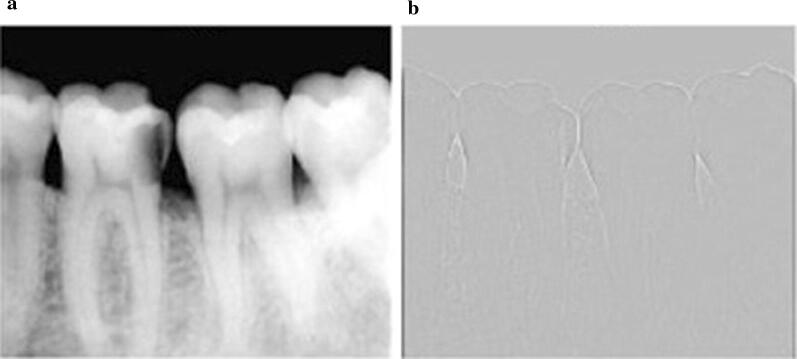
The original image, enhanced image using Laplacian filter are shown in Fig. 3a and b respectively. The enhanced image has edges only around tooth and caries region and remaining portion of the image is blurred. This greatly helps in extracting the features of tooth region.
Fig. 3.
a Original image b enhanced image using Laplacian filter
Figure 4a shows the image after passing through adaptive threshold. It is eroded and dilated by using morphological processing, shown in Fig. 4b and c respectively. Figure 4d shows segmented image, which is obtained by subtracting eroded image from dilated image.
Fig. 4.
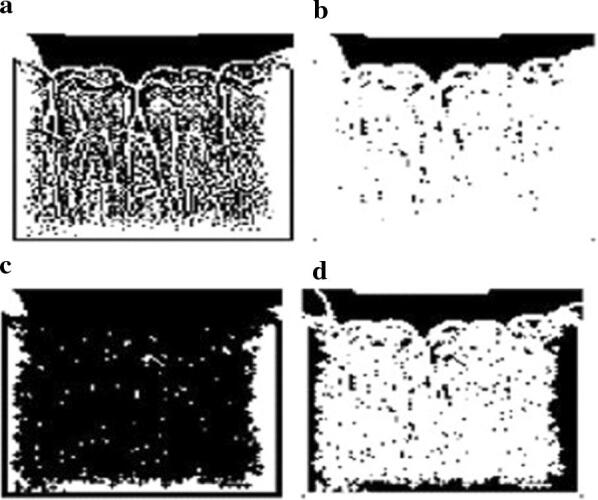
a Adaptive thresholded image b dilated image c eroded image d resultant image after subtracting eroded image from dilated image
Image enhancement
The parameter alpha controls the shape of the Laplacian operator. Table 2 gives performance of the diagnostic system with variation in alpha. The result in Fig. 5 shows that Laplacian filter is giving performance accuracy of 96.2% for alpha = 0.5. Therefore, Laplacian filter with alpha = 0.5 is considered for the study. The result is shown in Table 3, indicates that the interaction of the proposed method on performance parameter measures is significant.
Table 2.
Performance measures versus alpha for the Laplacian + adaptive threshold + statistical features + BPNN classifier system used for dental caries diagnosis
| Alpha | TP rate | FP rate | Precision | Recall | F-measure | MCC | ROC area | PRC area |
|---|---|---|---|---|---|---|---|---|
| 0.1 | 0.933 | 0.069 | 0.933 | 0.933 | 0.933 | 0.866 | 0.969 | 0.965 |
| 0.2 | 0.943 | 0.058 | 0.943 | 0.943 | 0.943 | 0.885 | 0.973 | 0.972 |
| 0.3 | 0.943 | 0.058 | 0.943 | 0.943 | 0.943 | 0.885 | 0.974 | 0.972 |
| 0.4 | 0.962 | 0.038 | 0.962 | 0.962 | 0.962 | 0.923 | 0.976 | 0.974 |
| 0.5 | 0.962 | 0.038 | 0.962 | 0.962 | 0.962 | 0.923 | 0.976 | 0.974 |
| 0.6 | 0.952 | 0.047 | 0.953 | 0.952 | 0.952 | 0.905 | 0.98 | 0.981 |
| 0.7 | 0.962 | 0.038 | 0.962 | 0.962 | 0.962 | 0.923 | 0.98 | 0.98 |
| 0.8 | 0.952 | 0.047 | 0.953 | 0.952 | 0.952 | 0.905 | 0.984 | 0.984 |
| 0.9 | 0.943 | 0.058 | 0.943 | 0.943 | 0.943 | 0.885 | 0.984 | 0.984 |
| 1 | 0.952 | 0.049 | 0.952 | 0.952 | 0.952 | 0.904 | 0.984 | 0.984 |
Fig. 5.
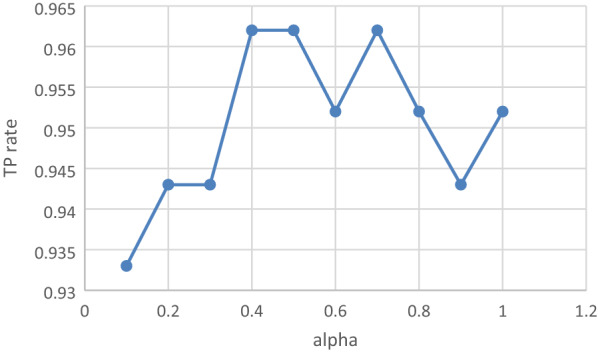
Variation of TP rate versus alpha
Table 3.
Two-way ANOVA statistical analysis results for data given in Table 2
| Source | SS | df | MS | F | Prob > F |
|---|---|---|---|---|---|
| Columns | 7.14338 | 7 | 1.02048 | 12095.34 | 0 |
| Rows | 0.00332 | 9 | 0.00037 | 4.38 | 0.0002 |
| Error | 0.00532 | 63 | 0.00008 | ||
| Total | 7.15201 | 79 |
The Laplacian filter is giving performance accuracy of 96.2%, is higher than the other Morphological filter and high boost filter Table 4. Two-way ANOVA statistical analysis for the result given in Table 5, indicates that the interaction of the proposed method on performance parameter measures is significant.
Table 4.
Comparison of performance measures of BPNN with other enhancement techniques
| Enhancement | TP rate | FP rate | Precision | Recall | F-measure | MCC | ROC area | PRC area |
|---|---|---|---|---|---|---|---|---|
| Laplacian | 0.962 | 0.036 | 0.963 | 0.962 | 0.962 | 0.924 | 0.983 | 0.984 |
| Morphological | 0.924 | 0.079 | 0.924 | 0.924 | 0.924 | 0.983 | 0.984 | 0.976 |
| High boost | 0.838 | 0.162 | 0.838 | 0.838 | 0.838 | 0.675 | 0.871 | 0.837 |
Table 5.
Two-way ANOVA statistical analysis results for data given in Table 4
| Source | SS | df | MS | F | Prob > F |
|---|---|---|---|---|---|
| Columns | 1.76857 | 7 | 0.25265 | 63.46 | 0 |
| Rows | 0.06042 | 2 | 0.03021 | 7.59 | 0.0059 |
| Error | 0.05573 | 14 | 0.00398 | ||
| Total | 1.88472 | 23 |
Figure 6 shows comparison of accuracy, ROC area and PRC area for the three enhancement techniques. By analysing this result, it is decided to Laplacian filter, dental caries analysis.
Fig. 6.
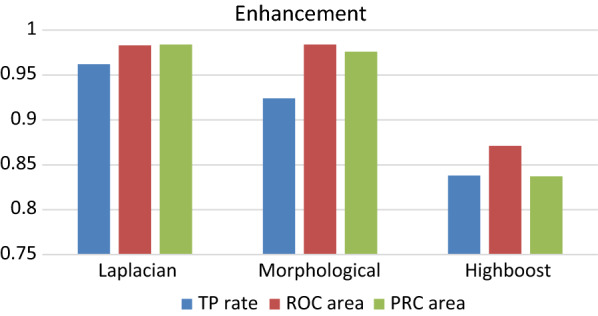
comparison of TP rate, ROC area and PRC area for the three enhancement techniques
Image segmentation
The proposed segmentation technique is compared with watershed transformation and active contouring. Table 6 shows the segmentation technique using combination of adaptive threshold and morphological operations gives better performance with accuracy of 0.962, ROC area of 0.983 and PRC area of 0.984. Two-way ANOVA statistical analysis for the result given in Table 6 is shown in Table 7, indicates that the interaction of the proposed method on performance parameter measures is significant.
Table 6.
Performance measures of the BPNN classifier for different segmentation techniques
| Segmentation | TP rate | FP rate | Precision | Recall | F-measure | MCC | ROC area | PRC area |
|---|---|---|---|---|---|---|---|---|
| Adaptive threshold | 0.962 | 0.036 | 0.963 | 0.962 | 0.962 | 0.924 | 0.983 | 0.984 |
| Watershed | 0.905 | 0.094 | 0.906 | 0.905 | 0.905 | 0.81 | 0.958 | 0.952 |
| Active contour | 0.886 | 0.118 | 0.886 | 0.886 | 0.886 | 0.77 | 0.951 | 0.949 |
Table 7.
Two-way ANOVA statistical analysis results for data given in Table 6
| Source | SS | df | MS | F | Prob > F |
|---|---|---|---|---|---|
| Columns | 1.86812 | 7 | 0.26687 | 223.44 | 0 |
| Rows | 0.0135 | 2 | 0.00675 | 5.65 | 0.0159 |
| Error | 0.01672 | 14 | 0.00119 | ||
| Total | 1.89834 | 23 |
Figure 7 gives the comparison of the segmentation methods in terms of TP rate, FP rate, ROC area and PRC area. Since adaptive thresholding in combination with adaptive thresholding is giving higher value of performance for dental caries diagnosis in dental radiographs, it is decided to use this segmentation technique for further analysis.
Fig. 7.
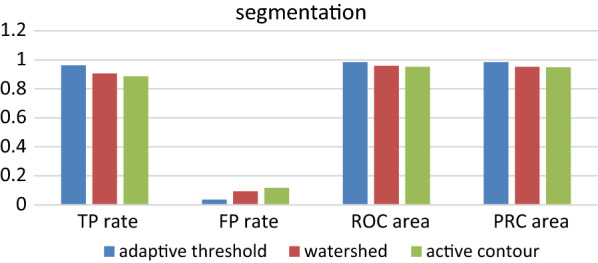
Comparison of TP rate, FP rate, ROC area and PRC area for the three segmentation techniques
Feature extraction
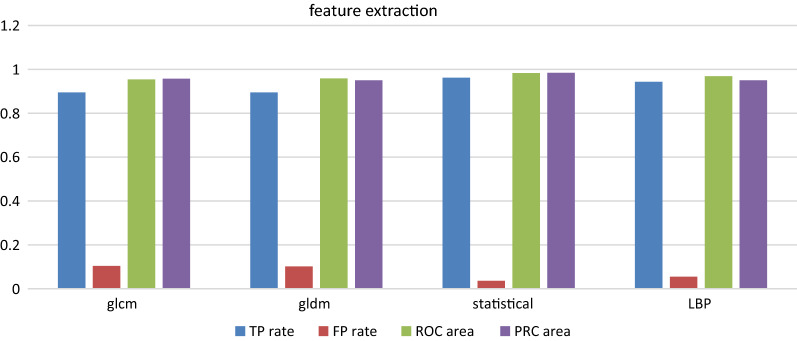
The proposed feature extraction method is compared with GLCM, Grey Level Difference Method (GLDM), Local Binary Patterns (LBP) feature extraction methods. The performance measures accuracy, False Positive (FP) rate, precision, recall, F measure, Matthews correlation coefficient (MCC), ROC area and PRC area are computed in Table 8. The proposed method gives higher value of accuracy (0.962), ROC area (0.983) and PRC area(0.984) as compared with the other methods. Two-way ANOVA statistical analysis for the result given in Table 8 is shown in Table 9, indicates that the interaction of the proposed method on performance parameter measures is significant.
Table 8.
Performance measures of different feature extraction methods used for dental caries diagnosis
| Features | TP rate | FP rate | Precision | Recall | F-measure | MCC | ROC area | PRC area |
|---|---|---|---|---|---|---|---|---|
| glcm | 0.895 | 0.104 | 0.896 | 0.895 | 0.895 | 0.79 | 0.954 | 0.958 |
| gldm | 0.895 | 0.102 | 0.897 | 0.895 | 0.895 | 0.792 | 0.959 | 0.95 |
| statistical | 0.962 | 0.036 | 0.963 | 0.962 | 0.962 | 0.924 | 0.983 | 0.984 |
| LBP | 0.943 | 0.055 | 0.944 | 0.943 | 0.943 | 0.886 | 0.969 | 0.95 |
Table 9.
Two-way ANOVA statistical analysis results for data given in Table 8
| Source | SS | df | MS | F | Prob > F |
|---|---|---|---|---|---|
| Columns | 2.56539 | 7 | 0.36648 | 418.04 | 0 |
| Rows | 0.01396 | 3 | 0.00465 | 5.31 | 0.007 |
| Error | 0.01841 | 21 | 0.00088 | ||
| Total | 2.59775 | 31 |
Figure 8 gives the comparison of the segmentation methods in terms of TP rate, FP rate, ROC area and PRC area. Since diagnostic system with statistical features is giving higher value of performance for dental caries diagnosis as compared to other textural feature extraction techniques, it is decided to use statistical features for the analysis.
Fig. 8.
Comparison of TP rate, FP rate, ROC area and PRC area for the feature extraction techniques
Classification
Table 10 gives the performance measures of proposed method with other type of classifiers. The proposed method gives higher value of accuracy (0.962), ROC area (0.983) and PRC area(0.984) as compared with the other methods. Two-way ANOVA statistical analysis for the result indicates that the interaction of the proposed method on performance parameter measures is significant (Table 11). Figure 9 gives the comparison of the segmentation methods in terms of TP rate, FP rate, ROC area and PRC area. Since diagnostic system with BPNN is giving higher value of performance for dental caries diagnosis as compared to other classifiers, it is decided to use statistical features for the analysis.
Table 10.
Performance measures of BPNN is compared with other classifiers for dental caries diagnosis
| Classifier | TP rate | FP rate | Precision | Recall | F-measure | MCC | ROC area | PRC area |
|---|---|---|---|---|---|---|---|---|
| BPNN | 0.962 | 0.036 | 0.963 | 0.962 | 0.962 | 0.924 | 0.983 | 0.984 |
| SVM | 0.838 | 0.182 | 0.866 | 0.838 | 0.833 | 0.699 | 0.828 | 0.787 |
| KNN | 0.905 | 0.094 | 0.906 | 0.905 | 0.905 | 0.81 | 0.906 | 0.874 |
| Naive bayes | 0.79 | 0.232 | 0.817 | 0.79 | 0.783 | 0.6 | 0.911 | 0.909 |
| Bagging | 0.914 | 0.088 | 0.914 | 0.914 | 0.914 | 0.828 | 0.921 | 0.891 |
| Random forest | 0.924 | 0.077 | 0.924 | 0.924 | 0.924 | 0.847 | 0.963 | 0.962 |
| XGBoost | 0.904 | 0.036 | 0.959 | 0.904 | 0.931 | 0.868 | 0.935 | 0.886 |
Table 11.
Two-way ANOVA statistical analysis results for data given in Table 10
| Source | SS | df | MS | F | Prob > F |
|---|---|---|---|---|---|
| Columns | 3.7874 | 7 | 0.54106 | 167.14 | 0 |
| Rows | 0.08896 | 6 | 0.01483 | 4.58 | 0.0012 |
| Error | 0.13596 | 42 | 0.00324 | ||
| Total | 4.01232 | 55 |
Fig. 9.
Comparison of TP rate, FP rate, ROC area and PRC area for the various classifiers
Table 1 shows algorithm for segmentation using adaptive threshold and morphological processing. The previous all results are recorded by taking x = 20 and t = 15. Table 12 shows performance measure of the proposed system for different value of x i.e., different size of sub image. Figures 10 and 11 shows variation of TP rate, ROC area with variation x, indicates that in the range of 35–50, it gives better performance. So, in further analysis, the value of x is set to 50. Two-way ANOVA statistical analysis for the result indicates that the interaction of the proposed method on performance parameter measures is significant (Table 13).
Table 12.
Performance measures versus x for Laplacian + adaptive threshold + statistical features + BPNN classifier used for dental caries diagnosis
| x | TP rate | FP rate | Precision | Recall | F-measure | MCC | ROC area | PRC area |
|---|---|---|---|---|---|---|---|---|
| 1 | 0.829 | 0.181 | 0.832 | 0.829 | 0.827 | 0.657 | 0.866 | 0.861 |
| 5 | 0.876 | 0.126 | 0.876 | 0.876 | 0.876 | 0.751 | 0.937 | 0.92 |
| 10 | 0.905 | 0.099 | 0.905 | 0.905 | 0.905 | 0.809 | 0.921 | 0.915 |
| 15 | 0.914 | 0.085 | 0.915 | 0.914 | 0.914 | 0.828 | 0.966 | 0.967 |
| 20 | 0.924 | 0.079 | 0.924 | 0.924 | 0.924 | 0.847 | 0.969 | 0.971 |
| 25 | 0.943 | 0.058 | 0.943 | 0.943 | 0.943 | 0.885 | 0.964 | 0.966 |
| 30 | 0.905 | 0.096 | 0.905 | 0.905 | 0.905 | 0.809 | 0.976 | 0.977 |
| 34 | 0.838 | 0.167 | 0.839 | 0.838 | 0.838 | 0.675 | 0.909 | 0.897 |
| 35 | 0.962 | 0.036 | 0.963 | 0.962 | 0.962 | 0.924 | 0.983 | 0.984 |
| 40 | 0.962 | 0.036 | 0.963 | 0.962 | 0.962 | 0.924 | 0.983 | 0.984 |
| 45 | 0.962 | 0.036 | 0.963 | 0.962 | 0.962 | 0.924 | 0.983 | 0.984 |
| 50 | 0.962 | 0.036 | 0.963 | 0.962 | 0.962 | 0.924 | 0.983 | 0.984 |
| 51 | 0.838 | 0.167 | 0.839 | 0.838 | 0.838 | 0.675 | 0.909 | 0.897 |
| 55 | 0.838 | 0.167 | 0.839 | 0.838 | 0.838 | 0.675 | 0.909 | 0.897 |
| 60 | 0.838 | 0.167 | 0.839 | 0.838 | 0.838 | 0.675 | 0.909 | 0.897 |
Fig. 10.

Variation of TP rate versus x
Fig. 11.
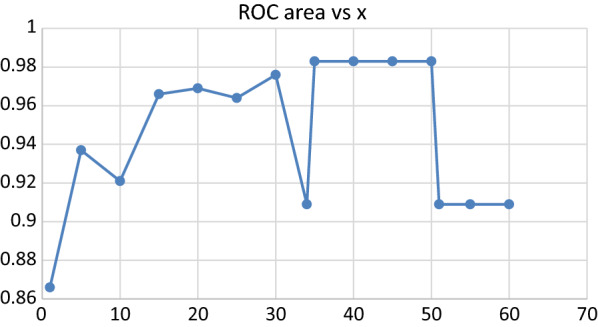
Variation of ROC area versus x
Table 13.
Two-way ANOVA statistical analysis results for data given in Table 12
| Source | SS | df | MS | F | Prob > F |
|---|---|---|---|---|---|
| Columns | 0.50545 | 7 | 1.21506 | 584.32 | 6.41794e-77 |
| Rows | 0.19974 | 14 | 0.01427 | 6.86 | 1.40296e-09 |
| Error | 0.20379 | 98 | 0.00208 | ||
| Total | 8.90898 | 119 |
By keeping the sub image size used in segmentation algorithm in the proposed system to x = 50, the value of t (Refer to Table 1) is varied and performance measures are evaluated and recorded in Table 14. Figure 12 shows that higher value of TP rate and ROC area for t = 15. So further analysis t = 15, x = 50 chosen. Two-way ANOVA statistical analysis for the result indicates that the interaction of the proposed method on performance parameter measures is significant (Table 15).
Table 14.
Performance measures versus t for Laplacian + adaptive threshold + statistical features + BPNN classifier used for dental caries diagnosis
| t | TP rate | FP rate | Precision | Recall | F-measure | MCC | ROC area | PRC area |
|---|---|---|---|---|---|---|---|---|
| 5 | 0.952 | 0.049 | 0.952 | 0.952 | 0.952 | 0.904 | 0.971 | 0.967 |
| 9 | 0.952 | 0.049 | 0.952 | 0.952 | 0.952 | 0.904 | 0.978 | 0.974 |
| 10 | 0.962 | 0.038 | 0.962 | 0.962 | 0.962 | 0.923 | 0.978 | 0.975 |
| 14 | 0.952 | 0.047 | 0.953 | 0.952 | 0.952 | 0.905 | 0.98 | 0.98 |
| 15 | 0.962 | 0.036 | 0.963 | 0.962 | 0.962 | 0.924 | 0.983 | 0.984 |
| 20 | 0.962 | 0.036 | 0.963 | 0.962 | 0.962 | 0.924 | 0.969 | 0.968 |
| 21 | 0.952 | 0.047 | 0.953 | 0.952 | 0.952 | 0.905 | 0.966 | 0.965 |
| 25 | 0.924 | 0.079 | 0.924 | 0.924 | 0.924 | 0.847 | 0.968 | 0.967 |
| 30 | 0.943 | 0.058 | 0.943 | 0.943 | 0.943 | 0.885 | 0.97 | 0.97 |
| 35 | 0.952 | 0.049 | 0.952 | 0.952 | 0.952 | 0.904 | 0.981 | 0.982 |
| 40 | 0.933 | 0.066 | 0.934 | 0.933 | 0.933 | 0.866 | 0.981 | 0.978 |
| 45 | 0.943 | 0.055 | 0.944 | 0.943 | 0.943 | 0.886 | 0.98 | 0.976 |
| 50 | 0.933 | 0.069 | 0.933 | 0.933 | 0.933 | 0.866 | 0.981 | 0.98 |
Fig. 12.
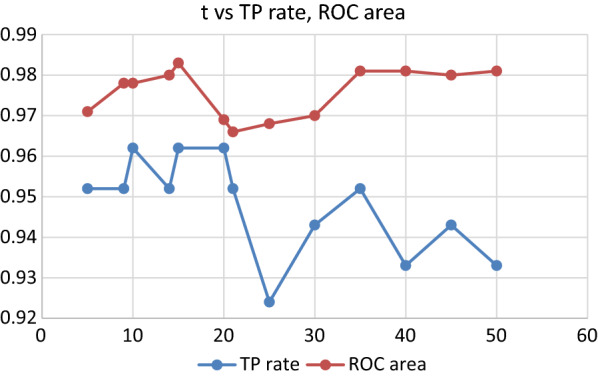
Variation of TP rate and ROC area versus t
Table 15.
Two-way ANOVA statistical analysis results for data given in Table 14
| Source | SS | df | MS | F | Prob > F |
|---|---|---|---|---|---|
| Columns | 9.18835 | 7 | 1.31262 | 9752.33 | 0 |
| Rows | 0.00575 | 12 | 0.00048 | 3.56 | 0.0003 |
| Error | 0.01131 | 84 | 0.00013 | ||
| Total | 9.2054 | 103 |
The above results are obtained for the proposed system, for 500 iterations, learning rate 0.3 and momentum = 0.2. By using momentum = 0.2 and 500 iterations, the performance measures of the system are tabulated for variation in learning rate in Table 16. It indicates that higher value of accuracy, ROC area, PRC area and minimum value of FP rate for learning rate = 0.4. Figure 13 shows the variation of accuracy, ROC area and PRC area with variation in learning rate. Two-way ANOVA statistical analysis for the result indicates that the interaction of the proposed method on performance parameter measures is significant (Table 17).
Table 16.
Performance measures versus learning rate for Laplacian + adaptive threshold + statistical features + BPNN classifier used for dental caries diagnosis
| Learning rate | TP rate | FP rate | Precision | Recall | F-measure | MCC | ROC area | PRC area |
|---|---|---|---|---|---|---|---|---|
| 0.1 | 0.962 | 0.038 | 0.962 | 0.962 | 0.962 | 0.923 | 0.974 | 0.971 |
| 0.15 | 0.971 | 0.028 | 0.972 | 0.971 | 0.971 | 0.943 | 0.974 | 0.972 |
| 0.2 | 0.971 | 0.028 | 0.972 | 0.971 | 0.971 | 0.943 | 0.975 | 0.972 |
| 0.25 | 0.971 | 0.028 | 0.972 | 0.971 | 0.971 | 0.943 | 0.978 | 0.984 |
| 0.3 | 0.962 | 0.036 | 0.963 | 0.962 | 0.962 | 0.924 | 0.983 | 0.984 |
| 0.39 | 0.971 | 0.028 | 0.972 | 0.971 | 0.971 | 0.943 | 0.987 | 0.987 |
| 0.4 | 0.971 | 0.028 | 0.972 | 0.971 | 0.971 | 0.943 | 0.987 | 0.987 |
| 0.41 | 0.971 | 0.028 | 0.972 | 0.971 | 0.971 | 0.943 | 0.985 | 0.986 |
| 0.5 | 0.962 | 0.036 | 0.963 | 0.962 | 0.962 | 0.924 | 0.982 | 0.983 |
| 0.6 | 0.962 | 0.036 | 0.963 | 0.962 | 0.962 | 0.924 | 0.982 | 0.982 |
| 0.7 | 0.962 | 0.036 | 0.963 | 0.962 | 0.962 | 0.924 | 0.984 | 0.985 |
| 0.8 | 0.962 | 0.036 | 0.963 | 0.962 | 0.962 | 0.924 | 0.984 | 0.984 |
| 0.9 | 0.962 | 0.036 | 0.963 | 0.962 | 0.962 | 0.924 | 0.984 | 0.984 |
| 1 | 0.962 | 0.036 | 0.963 | 0.962 | 0.962 | 0.924 | 0.977 | 0.978 |
Fig. 13.
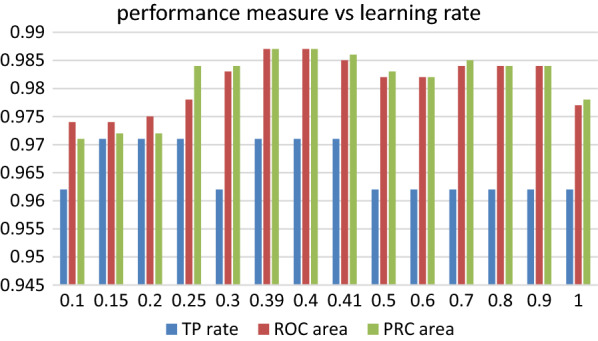
Variation of TP rate, ROC area and PRC area versus learning rate
Table 17.
Two-way ANOVA statistical analysis results for data given in Table 16
| Source | SS | df | MS | F | Prob > F |
|---|---|---|---|---|---|
| Columns | 10.6826 | 7 | 1.52609 | 62801.59 | 0 |
| Rows | 0.0011 | 13 | 0.00008 | 3.49 | 0.0002 |
| Error | 0.0022 | 91 | 0.00002 | ||
| Total | 10.6859 | 111 |
By using x = 50, t = 15, learning rate = 0.4, number of epochs = 500, the performance measures for the proposed system are recorded for variation in momentum, and are tabulated in Table 18. It indicates that higher value of accuracy, ROC area, PRC area and minimum value of FP rate for momentum = 0.2. Figure 14 shows the variation of accuracy, ROC area and PRC area with variation in momentum. Two-way ANOVA statistical analysis for the result indicates that the interaction of the proposed method on performance parameter measures is significant (Table 19).
Table 18.
Performance measures versus momentum for proposed method
| Momentum | TP rate | FP rate | Precision | Recall | F-measure | MCC | ROC area | PRC area |
|---|---|---|---|---|---|---|---|---|
| 0.1 | 0.971 | 0.028 | 0.972 | 0.971 | 0.971 | 0.943 | 0.985 | 0.985 |
| 0.2 | 0.971 | 0.028 | 0.972 | 0.971 | 0.971 | 0.943 | 0.987 | 0.987 |
| 0.3 | 0.971 | 0.028 | 0.972 | 0.971 | 0.971 | 0.943 | 0.985 | 0.986 |
| 0.4 | 0.952 | 0.044 | 0.954 | 0.952 | 0.952 | 0.906 | 0.984 | 0.985 |
| 0.5 | 0.952 | 0.044 | 0.954 | 0.952 | 0.952 | 0.906 | 0.983 | 0.983 |
| 0.6 | 0.952 | 0.044 | 0.954 | 0.952 | 0.952 | 0.906 | 0.984 | 0.984 |
| 0.7 | 0.952 | 0.044 | 0.954 | 0.952 | 0.952 | 0.906 | 0.987 | 0.987 |
| 0.8 | 0.962 | 0.036 | 0.963 | 0.962 | 0.962 | 0.924 | 0.987 | 0.987 |
| 0.9 | 0.962 | 0.036 | 0.963 | 0.962 | 0.962 | 0.924 | 0.984 | 0.985 |
| 1 | 0.638 | 0.393 | 0.657 | 0.638 | 0.615 | 0.28 | 0.608 | 0.59 |
Fig. 14.
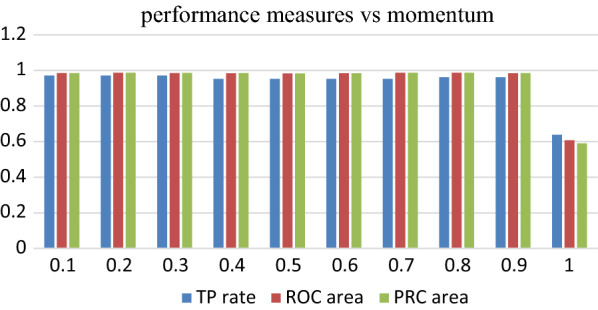
Variation of TP rate, ROC area and PRC area versus momentum
Table 19.
Two-way ANOVA statistical analysis results for data given in Table 18
| Source | SS | df | MS | F | Prob > F |
|---|---|---|---|---|---|
| Columns | 6.39355 | 7 | 0.91336 | 112.34 | 4.10854e-33 |
| Rows | 0.62573 | 9 | 0.06953 | 8.55 | 3.10541e-08 |
| Error | 0.51219 | 63 | 0.00813 | ||
| Total | 7.53147 | 79 |
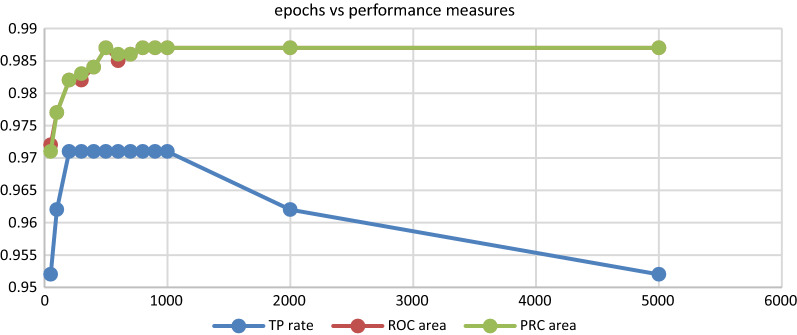
By using x = 50, t = 15, learning rate = 0.4, momentum = 0.2, the performance measures for the proposed system are recorded for variation in number of epochs, and are tabulated in Table 20. Figure 15 shows the variation of accuracy, ROC area and PRC area with variation in number of iterations. It indicates that higher value of accuracy, ROC area, PRC area and minimum value of FP rate for 500 iterations. Two-way ANOVA statistical analysis for the result indicates that the interaction of the proposed method on performance parameter measures is significant (Table 21).
Table 20.
Performance measures versus number of iterations
| Epochs | TP rate | FP rate | Precision | Recall | F-measure | MCC | ROC area | PRC area |
|---|---|---|---|---|---|---|---|---|
| 50 | 0.952 | 0.047 | 0.953 | 0.952 | 0.952 | 0.905 | 0.972 | 0.971 |
| 100 | 0.962 | 0.036 | 0.963 | 0.962 | 0.962 | 0.924 | 0.977 | 0.977 |
| 200 | 0.971 | 0.028 | 0.972 | 0.971 | 0.971 | 0.943 | 0.982 | 0.982 |
| 300 | 0.971 | 0.028 | 0.972 | 0.971 | 0.971 | 0.943 | 0.982 | 0.983 |
| 400 | 0.971 | 0.028 | 0.972 | 0.971 | 0.971 | 0.943 | 0.984 | 0.984 |
| 500 | 0.971 | 0.028 | 0.972 | 0.971 | 0.971 | 0.943 | 0.987 | 0.987 |
| 600 | 0.971 | 0.028 | 0.972 | 0.971 | 0.971 | 0.943 | 0.985 | 0.986 |
| 700 | 0.971 | 0.028 | 0.972 | 0.971 | 0.971 | 0.943 | 0.986 | 0.986 |
| 800 | 0.971 | 0.028 | 0.972 | 0.971 | 0.971 | 0.943 | 0.987 | 0.987 |
| 900 | 0.971 | 0.028 | 0.972 | 0.971 | 0.971 | 0.943 | 0.987 | 0.987 |
| 1000 | 0.971 | 0.028 | 0.972 | 0.971 | 0.971 | 0.943 | 0.987 | 0.987 |
| 2000 | 0.962 | 0.036 | 0.963 | 0.962 | 0.962 | 0.923 | 0.987 | 0.987 |
| 5000 | 0.952 | 0.047 | 0.953 | 0.952 | 0.952 | 0.905 | 0.987 | 0.987 |
| 10000 | 0.952 | 0.047 | 0.953 | 0.952 | 0.952 | 0.905 | 0.987 | 0.988 |
Fig. 15.
Variation of TP rate, ROC area and PRC area vs number of epochs
Table 21.
Two-way ANOVA statistical analysis results for data given in Table 20
| Source | SS | df | MS | F | Prob > F |
|---|---|---|---|---|---|
| Columns | 10.6902 | 7 | 1.52718 | 27863.05 | 1.2309e−148 |
| Rows | 0.0032 | 13 | 0.00025 | 4.5 | 7.21362e−06 |
| Error | 0.005 | 91 | 0.00005 | ||
| Total | 10.6984 | 111 |
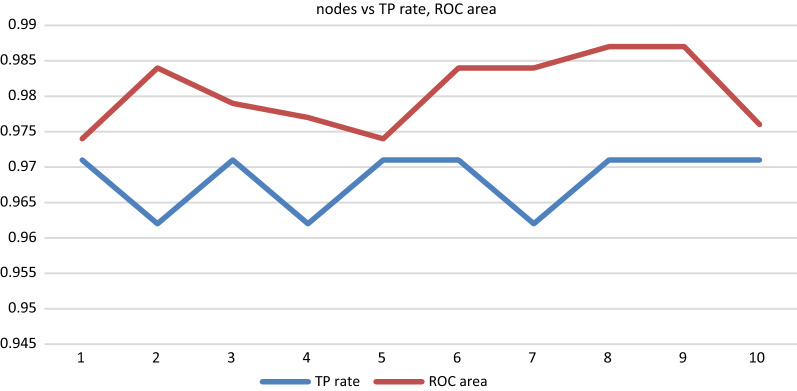
By using x = 50, t = 15, learning rate = 0.4, momentum = 0.2, number of epochs = 500, the performance measures for the proposed system are recorded for variation in hidden nodes, and are tabulated in Table 22. Figure 16 shows the variation of TP rate and ROC area with variation in number of nodes. It indicates that higher value of accuracy, ROC area, PRC area and minimum value of FP rate for nodes = 8 and 9. Two-way ANOVA statistical analysis for the result indicates that the interaction of the proposed method on performance parameter measures is significant (Table 23).
Table 22.
Performance measures versus number of hidden nodes
| Nodes | TP rate | FP rate | Precision | Recall | F-measure | MCC | ROC area | PRC area |
|---|---|---|---|---|---|---|---|---|
| 1 | 0.971 | 0.028 | 0.972 | 0.971 | 0.971 | 0.943 | 0.974 | 0.971 |
| 2 | 0.962 | 0.036 | 0.963 | 0.962 | 0.962 | 0.923 | 0.984 | 0.984 |
| 3 | 0.971 | 0.028 | 0.972 | 0.971 | 0.971 | 0.943 | 0.979 | 0.979 |
| 4 | 0.962 | 0.036 | 0.963 | 0.962 | 0.962 | 0.924 | 0.977 | 0.978 |
| 5 | 0.971 | 0.028 | 0.972 | 0.971 | 0.971 | 0.943 | 0.974 | 0.972 |
| 6 | 0.971 | 0.028 | 0.972 | 0.971 | 0.971 | 0.943 | 0.984 | 0.984 |
| 7 | 0.962 | 0.036 | 0.963 | 0.962 | 0.962 | 0.924 | 0.984 | 0.985 |
| 8 | 0.971 | 0.028 | 0.972 | 0.971 | 0.971 | 0.943 | 0.987 | 0.987 |
| 9 | 0.971 | 0.028 | 0.972 | 0.971 | 0.971 | 0.943 | 0.987 | 0.987 |
| 10 | 0.971 | 0.028 | 0.972 | 0.971 | 0.971 | 0.943 | 0.976 | 0.976 |
Fig. 16.
Variation of TP rate and ROC area versus number of hidden nodes
Table 23.
Two-way ANOVA statistical analysis results for data given in Table 22
| Source | SS | df | MS | F | Prob > F |
|---|---|---|---|---|---|
| Columns | 7.69599 | 7 | 1.09943 | 44819.75 | 0 |
| Rows | 0.00062 | 9 | 0.00007 | 2.79 | 0.0081 |
| Error | 0.00155 | 63 | 0.00002 | ||
| Total | 7.69815 | 79 |
ROC curve for proposed method with learning rate = 0.4, momentum = 0.2, number of iterations = 500 and hidden nodes = 9 is shown in Fig. 17.
Fig. 17.
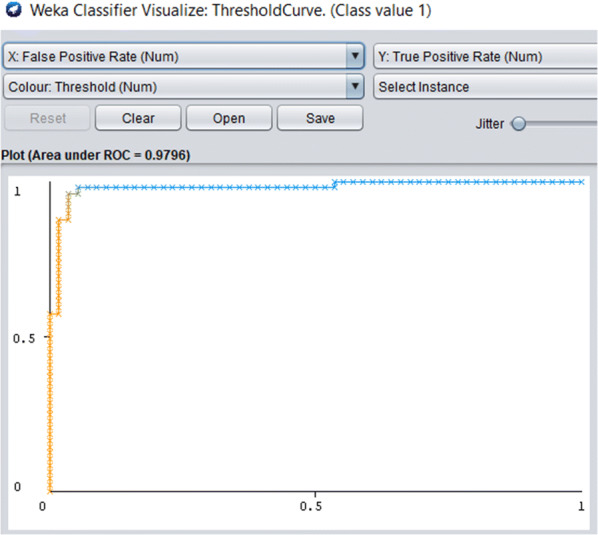
ROC curve for FFBPNN with learning rate = 0.4, iterations = 500, momentum = 0.2 and 9 hidden nodes
Comparison with other published works
Table 24 shows comparison of proposed work with other published work using dental radiographs. Singh et al. proposed a caries detection based on Radon Transformation and DCT using dental X-ray images [28]. Selected features are extracted using PCA technique, applied to Random Forest classifier and obtained accuracy of 86%. Ainas et al. presented Dental X-ray based tooth caries detection system using Histogram of Oriented Gradient and BPNN and have got an accuracy of 64.91% [23]. Wei Li et al. developed caries detection system using SVM and obtained 86.15% accuracy for training dataset and 77.34% accuracy for test dataset [29]. Tooth decay diagnosis developed by Yang Yu et al. using BPNN [22]. The authors achieved an accuracy of 94.2% with 10 hidden layers. Prajapati et al. developed Convolutional Neural Network based classification of major dental diseases [30] got an accuracy of 87.5% for detection of dental caries. The experimental results of the proposed method show that caries and normal X-ray images could be distinguished more accurately by the diagnostic system.
Table 24.
Comparison of the proposed work with other published works
Conclusion
Accurate diagnosis of tooth decay reduces the expenditure on oral health management and increases the probability of natural tooth protection in the long term. In this paper, an efficient dental diagnostic method is proposed. In the proposed system, Laplacian filter is used for enhancement, adaptive thresholding and morphological operations are used for segmentation and sixteen statistical features extracted from segmented image are applied to BPNN for classification. The experimental results show that caries and normal images could be distinguished more accurately with BPNN rather than SVM and KNN classifier. The proposed system gives accuracy of 97.1%, ROC area of 0.977 and PRC area of 0.987 for learning rate of 0.4, momentum = 0.2, hidden nodes = 9 and 500 iterations. Findings from the proposed study, shows that BPNN can deliver considerably good performance in dental caries diagnosis in dental radiographs. More improved algorithms and high quantity and high quality datasets may give still better tooth decay detection in clinical dental practice. There is a need for improving the system for classification of caries depth.
Acknowledgements
Authors would like to thank Dr. R. Gowramma, Principal, S.J.M. Dental College, Chitradurga for providing the datasets used in this research.
Compliance with ethical standards
Conflict of interest
The authors declare that they have no conflict of interest.
Footnotes
Publisher's Note
Springer Nature remains neutral with regard to jurisdictional claims in published maps and institutional affiliations.
References
- 1.Suwadee K, Sanpjet S, Supatyra P, Sujin B, Danaipong C. An artificial neural network for detection of simulated dental caries. Int J CARS. 2006 doi: 10.1007/s11548-006-0040-x. [DOI] [Google Scholar]
- 2.Anil KJ, Hong C. Matching of dental X-ray images for human identification. Pattern Recognit. 2004;37:1519–1532. doi: 10.1016/j.patcog.2003.12.016. [DOI] [Google Scholar]
- 3.Beltran-Aguilar ED, Barker LK, Canto MT, Dye BA, Gooch BF, Griffin SO. Survellance for dental caries, dental sealants, tooth retention, edentulism and enamel fluorosis-United States, 1988-1994 and 1999-2002. MMWR Surveill. Summ. 2005;54:1–43. [PubMed] [Google Scholar]
- 4.Centres for Disease Control and Prevention, National Health and Nutrition Examination Survey (NHANES) (1999–2002).
- 5.Stein PS, Desrosiers M, Donegan SJ, Yepes JF, Kryscio RJ. Tooth loss, dementia and neuropathy in the Nun study. J Am Dent Assoc. 2007;138:1314–1322. doi: 10.14219/jada.archive.2007.0046. [DOI] [PubMed] [Google Scholar]
- 6.Olsen GF, Brilliant SS, Primeaux D, Najarian K. An image processing enabled dental caries detection system. In: Proceedings of the 2009 ICME international conference on complex medical engineering; 2009. pp. 1–8.
- 7.Lee J-H, Kim D-H, Jeong S-N, Choi S-H. Detection and diagnosis of dental caries using a deep learning-based convolutional neural network algorithm. J Dent. 2018;77:106–111. doi: 10.1016/j.jdent.2018.07.015. [DOI] [PubMed] [Google Scholar]
- 8.Pierre G, Beaudoin G, De Guise JA. A method for modelling noise in medical images. IEEE Trans Med Imaging. 2004;23(10):1221–1232. doi: 10.1109/TMI.2004.832656. [DOI] [PubMed] [Google Scholar]
- 9.Suetens P. Fundamentals of medical imaging. 2. Cambridge: Cambridge University Press; 2009. [Google Scholar]
- 10.Kondo T, Ong S, Foong K. Tooth segmentation of dental study models using range images. IEEE Trans Med Imaging. 2004;23(3):350–362. doi: 10.1109/TMI.2004.824235. [DOI] [PubMed] [Google Scholar]
- 11.Pedro HML, Gilson AG, Luiz APN: Using the mathematical morphology and shape matching for automatic data extraction in dental X-ray images. In: Proceedings of the workshop of computer vision; 2009.
- 12.Zhou J, Abdel M. A content-based system for human identification based on bitewing dental X-ray images. Pattern Recognit. 2005;38(11):2132–2142. doi: 10.1016/j.patcog.2005.01.011. [DOI] [Google Scholar]
- 13.Nomir O, Abdel M. A system for human identification for human identification from X-ray dental radiographs. Pattern Recognit. 2005;38(11):1295–1305. doi: 10.1016/j.patcog.2004.12.010. [DOI] [Google Scholar]
- 14.Li S, Fevens T, Krzyzak A. An automatic variational level set segmentation framework for computer aided dental X-ray analysis in clinical environments. Comput Med Imaging Graph. 2006;30:65–74. doi: 10.1016/j.compmedimag.2005.10.007. [DOI] [PubMed] [Google Scholar]
- 15.Jain KR, Chauhan NC. Dental image analysis for disease diagnosis. Basel: Springer; 2019. [Google Scholar]
- 16.Hagan MT, Demuth HB, Beale M. Neural network design. Boston: PWS Publishing; 1995. [Google Scholar]
- 17.Lindahl D, Palmer J, Eden BL. Myocardial SPET: artificial neural network describes extent and severity of perfusion defects. Clin Physiol. 1999;19:495–503. doi: 10.1046/j.1365-2281.1999.00203.x. [DOI] [PubMed] [Google Scholar]
- 18.Holst H, Mare K, Jarund A, Astrok K, Evandre E, Tagil K, Ohlsso M, Edenbrandt L. An independent evaluation of a new method for automated interpretation of lung scintigrams using artificial neural networks. Eur J Nucl Med. 2001;28:33–38. doi: 10.1007/s002590000409. [DOI] [PubMed] [Google Scholar]
- 19.Mendonca EA. Clinical decision support systems perspectives in dentistry. J Dent Educ. 2004;68:589–597. doi: 10.1002/j.0022-0337.2004.68.6.tb03777.x. [DOI] [PubMed] [Google Scholar]
- 20.SenthilKumaran N. Edge detection for dental x-ray image segmentation using neural network approach. Int J Comput Sci Appl (TIJCSA). 2012;1(7):8–13. [Google Scholar]
- 21.SenthilKumaran N. Genetic algorithm approach to edge detection for dental x-ray image segmentation. Int J Adv Res Comput Sci Electron Eng (IJARCSEE). 2012;1(7):179–182. [Google Scholar]
- 22.Yang Y, Yun L, Yu-Jing L, Jian-Ming W, Dong-Hui L, We-Ping Y: Tooth decay diagnosis using back propagation neural network. In: Proceedings of 2006 international conference on machine learning and cybernetics; IEEE Press; 2006. pp. 3956–3959.
- 23.Ainas AA, Hazem ME, Sameh A. Detection of caries in panoramic dental X-ray images using back-propagation neural network. Int J Electron Commun Comput Eng. 2016;7(5):250–256. [Google Scholar]
- 24.Geetha V, Aprameya KS. Analysis of image segmentation techniques for diagnosis of dental caries in X-ray images. World Acad Sci Eng Technol. 2019;13(2):30–33. [Google Scholar]
- 25.Geetha V, Aprameya KS. Textural analysis based classification of digital X-ray images for dental caries diagnosis. Int J Eng Manuf (IJEM). 2019;9(3):44–45. [Google Scholar]
- 26.Cong H, Richard D: Artificial neural networks optimization for machining of cast and forged components. In: Proceedings of the sixth international conference on manufacturing engineering, Melbouirne VIC Australia; 1995. pp. 353–357.
- 27.Cajueiro DO, Andrade RFS. Learning paths in complex networks. Europhys Lett. 2009;87:580–584. doi: 10.1209/0295-5075/87/58004. [DOI] [Google Scholar]
- 28.Singh P, Sehgal: Automated caries detection based on Radon transformation and DCT. In: Proceedings of the 8th international conference on computing, communication and networking technologies; 2017. pp. 1–6.
- 29.Li W, Kuang W, Li Y, Li YJ, Ye WP: Clinical X-ray image based tooth decay diagnosis using SVM. In: Proceedings of international conference on machine learning and cybernetics; 2007. pp. 1616–1619.
- 30.Prajapati SA, Nagaraj R, Suman M: Classification of dental diseases using CNN and transfer learning. In: Proceedings of the 5th international symposium on computational and business intelligence; 2017. pp. 70–74.


