

Abstract
Metabolism of drugs affects their absorption, distribution, efficacy, excretion, and toxicity profiles. Metabolism is routinely assessed experimentally using recombinant enzymes, human liver microsome, and animal models. Unfortunately, these experiments are expensive, time-consuming, and often extrapolate poorly to humans because they fail to capture the full breadth of metabolic reactions observed in vivo. As a result, metabolic pathways leading to the formation of toxic metabolites are often missed during drug development, giving rise to costly failures. To address some of these limitations, computational metabolism models can rapidly and cost-effectively predict sites of metabolism—the atoms or bonds which undergo enzymatic modifications—on thousands of drug candidates, thereby improving the likelihood of discovering metabolic transformations forming toxic metabolites. However, current computational metabolism models are often unable to predict the specific metabolites formed by metabolism at certain sites. Identification of reaction type is a key step toward metabolite prediction. Phase I enzymes, which are responsible for the metabolism of more than 90% of FDA approved drugs, catalyze highly diverse types of reactions and produce metabolites with substantial structural variability. Without knowledge of potential metabolite structures, medicinal chemists cannot differentiate harmful metabolic transformations from beneficial ones. To address this shortcoming, we propose a system for simultaneously labeling sites of metabolism and reaction types, by classifying them into five key reaction classes: stable and unstable oxidations, dehydrogenation, hydrolysis, and reduction. These classes unambiguously identify 21 types of phase I reactions, which cover 92.3% of known reactions in our database. We used this labeling system to train a neural network model of phase I metabolism on a literature-derived data set encompassing 20 736 human phase I metabolic reactions. Our model, Rainbow XenoSite, was able to identify reaction-type specific sites of metabolism with a cross-validated accuracy of 97.1% area under the receiver operator curve. Rainbow XenoSite with five-color and combined output is available for use free and online through our secure server at http://swami.wustl.edu/xenosite/p/phase1_rainbow.
Graphical Abstract
INTRODUCTION
Phase I metabolism encompasses a collection of primarily oxidative reactions catalyzed by cytochromes P450 (CYP), other oxidoreductases, and hydrolases. Collectively, these enzymes are responsible for the majority of xenobiotic metabolism. For example, CYP enzymes catalyze the metabolism of more than 75% of FDA approved drugs.1 These enzymes catalyze reactions involving diverse substrates and form a diverse range of metabolites.2 Examples of phase I reactions include hydroxylation, epoxidation, S- and N-oxidation, dealkylation, deamination, dehalogenation, and dehydrogenation, among others.3 Furthermore, phase I metabolism can effect changes in the toxicity and bioactivity of metabolites by introducing or revealing functional groups such as hydroxyls, carboxyls, or amines through a wide range of chemical transformations.4-7
Although metabolism mainly detoxifies and deactivates xenobiotics, it can also bioactivate them into reactive metabolites.8,9 Reactive metabolites are electrophilic species that disturb cellular homeostasis through covalent and noncovalent interactions with biological macromolecules.10-13 Reactive metabolites can trigger cascades of toxic responses including direct cytotoxicity and immune-mediated hypersensitivity.13-16 Idiosyncratic adverse drug reactions (IADRs), an important and unpredictable type of immune-mediated hypersensitivity reaction, are associated with reactive metabolites. Approximately 62% of drugs either withdrawn from the market or labeled with a black box warning due to IADRs have been demonstrated to be metabolized into reactive metabolites.17,18 For this reason, substantial effort is put toward determining which molecules are metabolized into reactive metabolites.
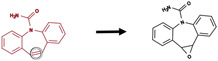
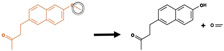
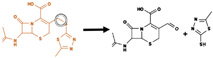
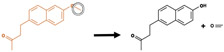
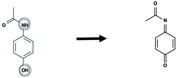
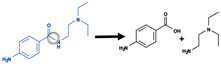
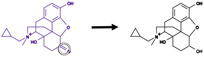
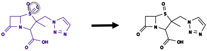
Whether xenobiotics are activated into toxic metabolites, or detoxified, often depends on the precise metabolic transformations they undergo in phase I metabolism. For example, the antibiotic drug chloramphenicol undergoes a variety of phase I metabolic transformations, but only two metabolites are known to be reactive, and these are believed to be responsible for chloramphenicol’s toxic side-effects (Figure 1).19-21 To identify potentially toxic drugs, we must be able to construct complete metabolic profiles, including the structures of metabolites, and assess their potential to react with biological macromolecules.
Figure 1.

Both site and type identifications are important for determining whether a metabolic transformation is beneficial or harmful. Antibiotic chloramphenicol is known for its severe toxicities such as “gray baby syndrome” and bone marrow suppression.22 These toxicities were attributed to the reactivity of both chloramphenicol and several of its phase I metabolites, nitroso-chloramphenicol, and acyl chloride-chloramphenicol.19-21 Nitroso-chloramphenicol and acyl chloride-chloramphenicol are generated through nitroreduction and dehalogenation of chloramphenicol, respectively. However, not all of chloramphenicol’s phase I metabolites are reactive. Both metabolites generated through hydrolysis and dehydrogenation of chloramphenicol were reported and predicted by our reactivity model23 to be inactive. This example illustrates the importance of knowing not only the site but the type of reaction in discriminating between beneficial and harmful metabolic transformations. Each colored circle marked a known site of metabolism with the reaction type denoted by an arrow of the corresponding color. Reactivity scores were assigned by our published reactivity model.23 These scores ranged from 0 to 1, displayed as rainbow shading on each site in accordance with the provided reactivity scale. The scale provides both color and size cue for prediction interpretation.
Current Approaches to Modeling Metabolism.
The existing in silico approaches to modeling phase I metabolism fall into three categories: (1) generic site of metabolism (SOM) prediction, (2) reaction-type specific SOM prediction, and (3) multiple reaction-type SOM prediction. All existing approaches fail to accurately predict bioactivation due to limitations in their ability to unambiguously identify metabolite structures from model predictions.
In generic SOM prediction, models predict which atoms or bonds are modified by metabolism. Sites are labeled as metabolized or not metabolized, but the specific type of metabolic reaction occurring at the site is not specified. SMARTCYP, RSPredictor, SOMP, MetaPrint2D, FAME 2, and XenoSite 1.0 are examples of models that use the generic SOM approach.24-30 These models are very effective at identifying metabolically labile sites, and they have become widely used in industry as a guide in designing molecules with increased half-lives. However, many sites have the potential to undergo several different types of reactions, yielding distinct metabolites. Consequently, these models do not provide enough information to unambiguously predict the metabolite structures and cannot model complete bioactivation pathways.
In reaction-type specific SOM prediction, models predict a single type of reaction to eliminate issues with ambiguous labels. For example, our group has published quinone formation, epoxidation, N-dealkylation, reduction, and sulfur-oxidation models.31-34 This approach has four significant advantages. First, the nuances of each reaction type can be carefully considered in isolation. Second, expert knowledge can guide design of input features, which can substantially improve accuracy. Third, curation of data sets of a uniform reaction-type encourages consistent annotation and identifies when data must be supplemented for reasonable performance. Fourth, the metabolic transformation is unambiguous, and the metabolite structure can be predicted. This approach has been invaluable in studying bioactivation pathways, including modeling the bioactivation of structural alerts.33,34 However, this approach has three key limitations. First, each model is typically trained on disjoint data sets, so their outputs are not scaled to predict the relative likelihood of different reaction-types. Second, information common to different reaction-types is not exploited to improve accuracy. Third, only a small minority of reaction-types have been modeled this way.
In multiple reaction-type SOM prediction, a single model is used to simultaneously predict multiple phase I reactions types. These models attempt to address the limitations of both generic SOM and reaction-type specific SOM models. To our knowledge, only two reaction-type SOM models—SOME35 and He et al.36—have been reported in the literature. In this work, we show that these published models only cover 42–48% phase I metabolism and leave out several reaction types that frequently generate reactive metabolites like epoxidation37 and quinone formation.38 In addition, we argue that these existing models are not probabilistic and are thus difficult to interpret. Nevertheless, the multiple reaction-type approach has potential if three key issues can be addressed: (1) coverage of phase I reactions is limited, (2) existing models are not probabilistic and do not indicate the relative likelihood of different metabolic transformations, and (3) no effective, scalable method for visualizing and interpreting these models is available. As the number of reaction types modeled proliferates, our ability to visualize and coherently organize results is diminished.
Unambiguous Reaction-Type Specific Site of Metabolism Model.
The central innovation put forward in this study is a “five color”, metabolic-rainbow classification of reaction types (Table 1). In this framework, bonds and lone-pairs (sites) are labeled with one of five colors, each corresponding to a set of possible reactions at that site. Given the context of the labeled sites, the colors can be unambiguously decoded into one of the 21 reaction types. We grouped these diverse phase I reaction types into five classes based the structural changes that they introduce to the substrates: stable oxygenation, unstable oxygenation, dehydrogenation, hydrolysis, and reduction. Two design goals guided the classification of reaction types into five colors. First, knowledge of the site and color of a reaction, should almost always be sufficient to determine the expected metabolite. Second, semantically related reaction types should be grouped into the same color. Detailed definitions of each color (or class) can be found in the Data and Methods section.
Table 1.
Five Colors of Phase I Metabolism
| Number |
||||
|---|---|---|---|---|
| Color | Definition | Reaction Types | Molecule | Site |
| Red |
 Stable Oxygenation (SO) |
aromatic hydroxylation aliphatic hydroxylation aromatic epoxidation aromatic epoxidation N-oxidation S-oxidation |
3098 | 10280 |
| Orange |
 Unstable Oxygenation (UO) |
N-dealkylation O-dealkylation S-dealkylation C-dealkylation oxidative deamination oxidative dehalogenation |
3749 | 5811 |
| Green |
 Dehydrogenation (DH) |
dehydrogenation alcohol to aldehyde or ketone single- to double-bond double- to triple-bond quinone formation iminium formation |
762 | 2794 |
| Blue |
 Hydrolysis (HD) |
ester hydrolysis amide hydrolysis ether hydrolysis cyanide hydrolysis |
3188 | 3969 |
| Purple |
 Reduction (RD) |
carbonyl reduction nitro reduction sulfo reduction reductive dehalogenation hydrogenation |
1213 | 1590 |
We demonstrate that the five color approach overcomes several limitations of prior approaches. First, predictions corresponding to 21 phase I reaction types can be unambiguously displayed on just five molecular diagrams, each corresponding to a different color. Second, because the model is trained on all reaction types and colors at the same time, information can be shared across reaction types, which reduces the total number of trainable weights and could improve the performance of the model on rare reaction types. Third, by using the same molecules to train all reaction types, the model outputs are expected to predict the relative probabilities between different reaction-types with greater accuracy.
Using the five color metabolism framework, we constructed a deep neural network model and trained it to produce probabilistic predictions of both the site and the type of human phase I metabolism for small, drug-like molecules. The model computes raw site- and molecule-level prediction scores, each corresponding to the probability that the site or molecule is metabolized by one of the five colors of metabolic reaction. The raw site-level scores are then aggregated and scaled to make general phase I and 21 reaction-type specific predictions. We trained the model on a diverse data set of 20 736 literature-derived human phase I reactions comprising 21 phase I reaction types ranging from the most common types like hydroxylation and dealkylation to less common yet important reactive-metabolite generating reaction types like epoxidation and quinone formation.
DATA AND METHODS
Metabolism Training Data.
We collected a chemically diverse set of molecules and metabolic reactions from the literature-derived Accelrys Metabolite Database (AMD). A total of 20 736 human in vitro and in vivo records were gathered. Each record was composed of one or more chemical transformations. A diverse set of phase I reaction types, including hydroxylation, dealkylation, deamination, dehalogenation, and hydrolysis, among others were present in our training data set (Table 1). Our study accounted for 92.3% of all human phase I metabolism in the AMD data set. The remaining 7.7% phase I reaction types excluded from the current study, in order from most to least common, were tautomerization, isomerization, rearrangement, radical formation, hydration, deacylation, denitrogenation, and decarbonylation. Reactions starting from the same substrate were mapped onto a single training molecule using maximum common substructure matching.39 Our final data set contained 9 674 unique molecules. Under the AMD licensing agreement, we were not allowed to disclose the structures of molecules in the data set. However, to enable rebuilding of our complete database and reproduction of our results, we provide all reaction and molecule AMD registry numbers in the Supporting Information.
Five Colors of Metabolism.
Using the five color classification approach, we identified 21 reaction types, and grouped them into five classes: red, orange, green, blue, and purple (Table 1). The first class is red, for stable oxygenation. In a red reaction, an oxygen is added to the substrate, yielding a single observable metabolite. Red reactions include hydroxylation, aromatic/aliphatic epoxidation, nitrogen oxidation, and sulfur oxidation (Table 2). The second class is orange, for unstable oxygenation. In an orange reaction, addition of an oxygen to the substrate destabilizes one of the molecule’s heavy bond (bond connecting between two non-hydrogen atoms). Eventually this bond breaks and gives rise to two metabolites, one contains the added oxygen and the other does not. Orange reactions include nitrogen-, oxygen-, sulfur-, and carbon-dealkylation and oxidative dehalogenation (Table 3). The third class is green, for dehydrogenation. In a green reaction, hydrogen(s) is extracted to form double bond, triple bond, iminium, or quinone. Green reactions include double/triple bond formation and quinone/imine/methide formation (Table 4). The forth class is blue, for hydrolysis. In a blue reaction, addition of a water molecule causes amide-, ester-, or ether-bond breakage and gives rise to two metabolites. Blue reactions include amide, ester, and ether hydrolysis (Table 5). The fifth class is purple, for reduction. In a purple reaction, an oxygen is removed or hydrogen(s) is(are) added to the substrate. Purple reactions include nitro-, carbonyl-, and sulfo-reduction, reductive dehalogenation, and hydrogenation (Table 6).
Table 2.
Red Reactions: Stable Oxygenations (SOs)a
| Reaction Type | Example | SOM Labeling | Site |
|---|---|---|---|
| Hydroxylation |
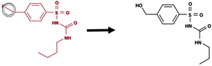
|
Bond between a heavy atom and a hydrogen | 8475 |
| N-oxidation |
|
Lone-pair on nitrogen atom | 665 |
| Epoxidation |
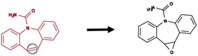
|
Double/aromatic bond between two carbon atoms | 636 |
| S-oxidation |
|
Lone-pair on surfur atom | 424 |
Examples, labeling strategies, and reaction type counts for each “red”, stable-oxygenation reaction type.
Table 3.
Orange Reactions: Unstable Oxygenations (UOs)a
| Reaction Type | Example | SOM Labeling | Site |
|---|---|---|---|
| N-dealkylation |
|
Bond between nitrogen and carbon | 2970 |
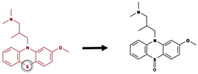
| O-dealkylation |
|
Bond between oxygen and carbon | 1712 |
| S-dealkylation |
|
Bond between sulfur and carbon | 93 |
| C-dealkylation |
|
Bond between two carbon | 577 |
| Oxidative Dehalogenation |
|
Bond between halogen and carbon | 309 |
Examples, labeling strategies, and reaction type counts for each “orange”, unstable-oxygenation reaction type.
Table 4.
Green Reactions: Dehydrogenations (DHs)a
| Reaction Type | Example | SOM Labeling | Site |
|---|---|---|---|
| Double/triple bond formation |
|
Bond between heavy atom and hydrogen | 2741 |
| Quinone/Imine/Methide formation |
|
Bond between heavy atom and hydrogen | 90 |
Examples, labeling strategies, and reaction type counts for each “green”, dehydrogenation reaction type.
Table 5.
Blue Reactions: Hydrolyses (HDs)a
| Reaction Type | Example | SOM Labeling | Site |
|---|---|---|---|
| Amide hydrolysis |
|
Amide bond | 1118 |
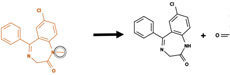
| Ester hydrolysis |
|
Ester bond | 2112 |
| Ether hydrolysis |
|
Ether bond | 47 |
Examples, labeling strategies, and reaction type counts for each “blue”, hydrolysis reaction type.
Table 6.
Purple Reactions: Reductions (RDs)a
| Reaction Type | Example | SOM Labeling | Site |
|---|---|---|---|
| Nitro reduction |

|
Bond between nitrogen and attached oxygen | 313 |
| Carbonyl reduction |
|
Carbonyl bond | 869 |
| Sulfo reduction |
|
Bond between sulfur and attached oxygen | 46 |
| Reductive dehalogenation |
|
Bond between halogen and attached carbon | 2 |
| Hydrogenation |
|
Double, triple bond between pair of hydrogenated atoms | 1435 |
Examples, labeling strategies, and reaction type counts for each “purple”, reduction reaction type.
While abundant data is available for phase I reactions like hydroxylation and dealkylations, reactions such as quinone formation and cyanide hydrolysis have only a few examples in our data set. Were individual models constructed for each reaction type, some of these models would be susceptible to ascertainment bias due to data limitations.40
Colored Sites of Metabolism.
We implemented automated labeling rules that use the structures of substrate and product and the reaction type to identify the specific bond(s) or lone-pair(s), called site(s) of metabolism (SOM(s)), at which the metabolic transformation takes place in each reaction record. Although labeling bonds as SOMs is obvious, labeling lone-pairs as SOMs is unconventional. We define a lone-pair as a pair of unshared valence electrons that do not participate in a covalent bond. For example, there are two lone pairs on the oxygen atom in a water molecule. In phase I metabolic reactions, a lone pair can donate electrons to form a covalent bond. When this occurs, we consider the lone pair is the site of metabolism. Reaction-type specific SOMs are labeled via a set of rules defined for each reaction type (Table 2-6). The final data set had 10 280, 5811, 2794, 3869, and 1590 sites of stable oxygenation, unstable oxygenation, dehydrogenation, hydrolysis, and reduction, respectively (Table 1).
Our labeling rules could identify SOMs for the majority of AMD reaction records, but they were not perfect. Each reaction record was manually inspected to identify mislabeled SOMs. About 15% of all automatically labeled SOMs were identified as incorrect and manually corrected. As with other manual processes, there were human errors in the label inspection. We approximated such errors by randomly selecting a subset of the manually corrected reaction records for further evaluation. For these selected reaction records, multiple independent annotators repeated the manual inspection. Next, all annotators examined and discussed each reaction record together to reach consensus on the correct labeling. Of the 200 sampled reaction records, ten records had annotations that are deviated from the established correct labeling. As a result, approximately 5% of the manually annotated reaction records contained errors.
Identification of Potential Sites of Metabolism.
Each type of metabolic reaction occurs at some but not all sites. For example, epoxidation only occurs at double and aromatic bonds while hydrolysis takes place at amide, ester, and ether bonds. These sets of potential sites could be used to heuristically estimate specific chemical domains for reaction types—where in the molecule a specific reaction happens. To assess our model’s ability to predict sites of metabolism for individual reaction types within their specific chemical domains, we identified all reaction-type specific potential sites (Table S6) using SMARTS patterns.41 While useful for identifying potential sites, SMARTS patterns alone cannot specifically identify SOM because only a small fraction of potential sites are metabolized. Of 691, 349 bonds and lone-pairs (pseudobonds) in our data set, 461, 876 (66.81%) sites were identified as potential sites for at least one of the covered phase I reaction types. On average, 99.97% of class-specific labeled SOMs were in the corresponding set of potential sites. Class-specific labeled SOMs that did not fall within the corresponding domain for their class were in fact mislabeled sites.
Descriptors.
To predict the susceptibility to metabolism of each bond/lone pair in the data set, our model used structural, physical, and chemical information encoded in numerical descriptors. Each bond was represented by a vector of 404 descriptors that describe its properties at atom, bond, and molecule levels. All of these descriptors are calculated by in-house software from 2D Open Babel SDF files.42 The majority of the descriptors used in this project are atom-level descriptors (e.g., atom identity, charge, hybridization) previously developed for XenoSite metabolism models, as described in previous studies from our group.26,31,43 For each bond, there were 189 descriptors for each atom on either side of the bond (Table S1), 10 bond descriptors (e.g., bond type, bond length) (Table S2), and 16 molecule descriptors (e.g., molecular weight, topological polar surface area, molar refractivity) (Table S3). The complete list of descriptors used in this study is provided in the Supporting Information Tables S1, S2, and S3.
Multitarget Deep Neural Network Model.
Our phase I model was a multitarget, deep neural network with one input layer, four hidden layers, and two output layers (Figure 2). Multitask neural networks can reuse features learned for one class of reactions to predict another, data-limited class, and can significantly reduce the number of model parameters required.23,44,45
Figure 2.

Structure of the phase I reaction model. (left) The diagram shows how information propagated through the neural network model, which contained one input layer, two hidden layers, and two output layers. From the structure of an input molecule, 16 molecule-level, 10 bond-level, and 2 sets of 179 atom-level descriptors were calculated for each bond and lone-pair and fed to the model. Colored circles represent model predictions, which range from 0 to 1. Bars are vectors of real numbers. The five classes of phase I metabolism covered in this study are stable oxygenation (SO), unstable oxygenation (UO), dehydrogenation (DH), hydrolysis (HD), and reduction (RD). (right) Examples from the data used in the two sequential training stages, on bond and molecule neural network, are shown. Observed stable oxygenation reactions at the bond and molecule level are circled.
The top output layer computed molecule prediction vectors, each contained five scores corresponding to the five classes of phase I reactions. Each of these molecule prediction scores correlated to the probability that a given molecule was observed to be metabolized via the corresponding reaction class. Similarly, the bottom output layer computed bond prediction vectors, each containing five scores. These scores correlated to the probabilities that a given bond/lone-pair was an actual site of metabolism for each of the five reaction classes.
The network was trained in two stages. First, the bond-level network was trained to produce accurate bond-level scores. For an input molecule, atom-level, bond-level, and molecule-level descriptors were calculated for all bonds and lone-pairs. These descriptors were inputs to a neural network with two hidden layers (each contains 25 nodes, ReLU activation) that generated vectors of five scores corresponding to the five classes of phase I reactions. Each element in the vector represented the probability that a bond/lone-pair was a phase I reaction-class SOM. The weights of the model were calibrated during training by performing gradient descent on the cross-entropy error (with L2 penalty coefficient of 0.3) of the difference between the predicted and actual response values of each bond using TensorFlow and SciPy LBFGS Optimizer.46-48 Second, the molecule-level network of two hidden layers (each contains five nodes, ReLu activation) was trained. In this training step, each row of the data matrix represented a molecule, and each column was descriptor. Descriptors included the top five bond-level scores for each reaction class (25 in total) and all molecule-level descriptors. Similar to the first stage, we trained the weights of the networks using gradient descent on the cross-entropy error (with L2 penalty coefficient of 0.3) so that molecules observed being metabolized by certain class of reaction received higher score for that class than other molecules.
The accuracy of the model was evaluated using a 10-fold cross-validation procedure. The data set was divided into ten groups with an equal number of substrates in each group. Predictions were generated for each tenth of the data by a model trained using the remaining nine tenths of the data. The resulting predictions covered the complete data set and were used to compute the accuracy metrics in this study.
Visualizing Metabolism in Colors.
There is no established way of displaying SOM data from many reaction types in a coherent or efficient way. One motive in defining reaction classes as “colors” is to introduce a mnemonic metaphor as a foundation for efficient visualizations of metabolism. Reaction color becomes a visual cue for reaction classes and reaction types.
Specifying the five reaction colors more precisely, each was mapped to colorblind safe hex codes.49,50 Generally, rainbow coloring is often deemed inappropriate for visualization.51-53 In this case, however, it is appropriate because there are no natural ordering to the reaction classes to which the color is keyed.
In displaying metabolism data and predictions the 2D depiction of the molecule is always used, and it is annotated with both (1) white circles with a black shadow to denote each atom and bond that are metabolized and (2) background shading with color and size that denotes the strength of predictions at each atom and bond. Usually, the 2D depiction of the molecule is black. Here, we use color in the 2D depiction to indicate reaction color. The white circles and rainbow shading on a certain colored 2D depiction are the observed SOMs and predictions of that specific metabolism color.
For the most part, SOMs are visualized exactly as used for modeling described in the prior section, but in some cases, adjustments are made. For a SOM labeled at the bond between a hydrogen and a heavy atom, the circle is displayed at the corresponding heavy atom. Similarly, a lone-pair SOM is visualized at the atom bearing the lone-pair. Likewise, model predictions for a bond between a hydrogen and a heavy atom or for a lone-pair is visualized at the corresponding heavy atom. These modifications allow for displaying all known SOMs and model predictions on a standard 2D molecular diagram, commonly used by organic chemists, which only contains heavy atoms.
Three Levels of Visualization.
We define three levels of visualizations at which to display observed SOMs and model predictions. The three levels of visualization work together (Figure 3). A large number of molecules can be displayed with just the highest visualization level, and lower level visualizations can clarify details when they are requested. Also, multiple levels can be displayed at the same time to display metabolism data at different resolutions (Figure 3).
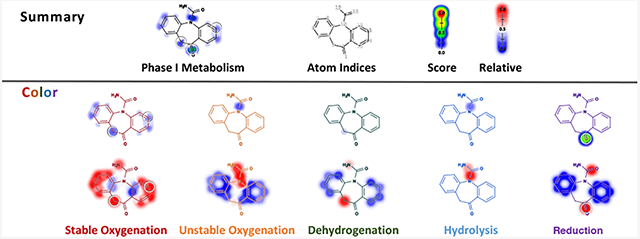
Figure 3.

Phase I metabolism in colors. Phase I model predictions on oxcarbazepine are displayed at three levels. (A) The top level displays summarized predictions to highlight metabolic “hot spots”. (B) The middle level contains predictions for each of the five reaction colors. (C) The bottom level displays predictions for each of the 21 reaction types. For each reaction type, the prevalence of metabolized sites among all potential sites is in parentheses.
At the highest level, we show predictions as a single molecule, so this may be most useful for screening large numbers of molecules in the first pass (Figure 3A). Predictions of each of the five reaction types are aggregated into a single score for each SOM, as outlined in the following section (Prediction Aggregation and Scaling). This visualization uses a black molecule depiction with white circles. In the future, we might add color to the circles to indicate reaction class, perhaps including multicolored circles when multiple reaction colors are observed at a single site.
At the middle level, each row has five depictions, one for each reaction color (Figure 3B). This visualization makes immediately apparent the reaction type of most predictions and SOMs. Here, each of the five molecules depicts a reaction color, and observed sites of metabolism are annotated with white circles. The model predictions for each reaction color are displayed as shading behind the molecule of the corresponding color. The color of the depicted molecule is a critical visual cue. With practice, one can distinguish reaction-types based on structural context and the reaction color.
At the lowest level, all reaction types are displayed in separate depictions (Figure 3C). The visualization still colors the molecule depiction with the class color, but there are multiple molecules with the same color. Reported sites of metabolism, again, are marked with white circles. The reaction type name is included too, to clarify which depiction corresponds to which reaction type. This is the most expansive visualization, which is most suitable for drilling down into the details of molecules being examined most rigorously.
Though the predictions in the model can be visualized, it does take effort to learn how to navigate the figure. In the future, we plan to integrate this model as a building block into composite algorithms designed to answer specific questions in drug development. For example, we hope to build algorithms that can predict bioactivation pathways. Ultimately, we expect this visualization may be more useful as a diagnostic for tools that make use of predictions from the model.
Prediction Aggregation and Scaling.
To improve visualization, the model raw predictions were, at times, aggregated and scaled. The aggregated and scaled predictions are visualized as the background shading behind each molecule using a rainbow- and size-based color map (Figure 3).
The highest visualization described in the prior section contains aggregated predictions (Figure 3A). In the aggregation step, each site i is assigned with a single score pi by computing the probabilistic-OR over its five raw color-prediction scores :
5
| (1) |
The first row of the middle visualization described in the prior section contains scaled prediction (Figure 3B). In this scaling step, each raw color-prediction site score of site i is scaled by the color j predictions of all n sites in the same molecule:
| (2) |
The second row of the middle visualization (Figure 3B) and the lowest visualization (Figure 3C) described in the prior section contains scaled predictions . Because some types of reactions are rare, their raw predictions from the model are low and their corresponding color on the visualization scale are difficult for human eyes to differentiate. To improve the visibility of probabilistic differences between sites of the same reaction type, the raw prediction of site i is scaled by predictions on all N potential sites specific to that reaction type across the entire data set using logit and sigmoid (σ) functions:
| (3) |
The scaled predictions for a reaction type are displayed only at its potential sites. These predictions are visualized using the red–blue color scheme, where red indicates probabilities higher than average and blue indicates probabilities lower than average. In addition, we split epoxidation and dehydrogenation reaction types into aromatic and aliphatic subtypes for visualization because these subtypes have drastically different background probabilities.
RESULTS AND DISCUSSION
In the following sections, we examine our rainbow-SOM deep neural network, Rainbow XenoSite, model of phase I metabolism. Rainbow XenoSite was trained on a large training set of molecules, covering observed metabolic transformations in human liver microsome, recombinant isozymes, and human in vivo studies. The majority of phase I metabolism was included (Data and Methods). First, we compared the reaction coverage and properties of Rainbow XenoSite to published SOM prediction models. Second, we demonstrated how the rainbow-SOM labeling-scheme significantly reduced the ambiguity in reaction types compared to the generic SOM labeling-scheme. Third, we assessed the accuracy of Rainbow XenoSite in predicting both metabolized sites and molecules. Fourth, we evaluated the accuracy of Rainbow XenoSite in discriminating which molecules with specific structural alerts are bioactivated.18,54 Finally, we discussed the limitations of our approach and suggested future studies to improve toxicity risk assessment.
Reaction Coverage Comparison.
We compared our five-color metabolism model (Rainbow XenoSite) to several previously published phase I SOM prediction models: SMARTCyp, RSPredictor, SOMP, MetaPrint2D, FAME 2, Site of Metabolism Estimator (SOME), He et al., and a selection of single reaction type models (Table 7).24-36 Side by side summary of the models’ methodology and data (Table 7) revealed several key observations encompassing interpretability, chemical space coverage, and reaction type coverage.
Table 7.
Improved Reaction Coverage of Rainbow XenoSite in Comparison to Previously Published Models
| Rainbow Xeno- Site |
SMARTCyp24 | RSPredictor25 | SOMP27,28 | MetaPrint2D29 | FAME30 | combined SRMs31-34 |
SOME35 | He et al.36 | |
|---|---|---|---|---|---|---|---|---|---|
| phase I coverage | 92.3% | 45.5% | 48.0% | 46.1% | 74.8% | 48.0 | 21.0%a | 42.6% | 37.6% |
| red | Ar-hydroxylationb | Ar-hydroxylation | Ar-hydroxylation | Ar-hydroxylation | Ar-hydroxylation | Ar-hydroxylation | Ar-hydroxylation | Ar-hydroxylation | |
| Al-hydroxylationc | Al-hydroxylation | Al-hydroxylation | Al-hydroxylation | Al-hydroxylation | Al-hydroxylation | Al-hydroxylation | Al-hydroxylation | ||
| N-oxidation | N-oxidation | N-oxidation | N-oxidation | N-oxidation | N-oxidation | N-oxidation | |||
| S-oxidation | S-oxidation | S-oxidation | S-oxidation | S-oxidation | S-oxidation | S-oxidation | |||
| P-oxidation | P-oxidation | ||||||||
| epoxidation | epoxidation | epoxidation | epoxidation | epoxidation | |||||
| orange | N-dealkylation | N-dealkylation | N-dealkylation | N-dealkylation | N-dealylation | N-dealylation | N-dealylation | N-dealkylation | N-dealylation |
| O-dealkylation | O-dealkylation | O-dealkylation | O-dealkylation | O-dealkylation | O-dealkylation | O-dealylation | |||
| S-dealkylation | S-dealkylation | S-dealkylation | |||||||
| C-dealkylation | C-dealkylation | ||||||||
| P-dealkylation | P-dealkylation | ||||||||
| oxidative-deamination | oxidative-deamnation | ||||||||
| oxidative-dehalogenation | oxidative-dehalogenation | oxidative-dehalogenation | |||||||
| green | alcohol to aldehyde or ketone | alcohol to aldehyde or ketone | alcohol to alhyde or ketone | alcohol to aldehyde or ketone | alcohol to aldehyde or ketone | ||||
| double/triple-bond formation | double/triple-bond formation | ||||||||
| quinone formation | quinone formation | ||||||||
| iminium formation | iminium formation | ||||||||
| blue | ester hydrolysis | ester hydrolysis | |||||||
| amide hydrolysis | amide hydrolysis | ||||||||
| ether hydrolysis | ether hydrolysis | ||||||||
| cyanide hydrolysis | cyanide hydrolysis | ||||||||
| purple | sulfore-duction | ||||||||
| nitro-reduction | nitro-reduction | nitro-reduction | nitro-reduction | ||||||
| carbonyl-reduction | |||||||||
| phosphate-reduction | |||||||||
| descriptors | topological | SMARTCyp—estimated energy required for CYP to access certain functional groups (defined by SMARTS string), accessibility | topological, quantum mechanic, SMARTCyp | chemical fingerprints | circular fingerprints | topological | topological | quantum mechanic | topological, quantum mechanic |
| machine learning algorithm | multitarget, deep neural network | linear model | ensemble of SVM models | Bayesian | statistics | ensemble of decision trees | single-target neural networks | six support vector machine (SVM) models, each makes SOM prediction for a phase I reaction type | ensemble of machine learning algorithms |
| SOM labeling Strategy | five color SOM | generic SOM | generic SOM | generic SOM | generic SOM | generic SOM | atom/bond SOM | reaction-type specific atom SOM | reaction-type specific bond SOM |
| prediction format | probabilistic | ranking | ranking | binary output | probabilistic?d | probabilistic?e | probabilistic | probabilistic?f | unspecified |
| data source | AMD | literature curation | literature curation | AMD | AMD | literature curation | AMD | AMD | BKM-react |
| reproducibility | training data published | training data published | training data published | training data not published | training data not published | training data published | training data published | training data not published | training data published |
| availability to test new molecules | web server | web server | web server | web server | software | software | web server | software | no |
Combined SRMs: combined single reaction models.
Aromatic hydroxylation
Aliphatic hydroxylation.
The scores are given in five different buckets: little/no data, 0–0.15, 0.15–0.33, 0.33–0.66, and 0.66–1.
The authors30 claimed that the mean of predictions given by ensemble of decision trees is probabilistic but failed to provide evidence that the score is well-scaled.
The authors35 claimed that the output from SVM were probabilistic after Platt scaling but failed to provide evidence that the scaling indeed worked. In addition, Platt scaling of SVM output has been shown to fail in certain instances.26 Platt scaling is based on the assumption that the distance from a point to the decision plane in SVM is correlated to the confidence of the classification prediction. In reality, the distance of a point from the decision plane is dependent on the sparsity of the data and does not always reflect the confidence of the prediction.
First, Rainbow XenoSite and single reaction type models are the only models that produce well-scaled, probabilistic outputs (Figure S1). Compared to ranking and binary outputs, probabilistic predictions are more useful for triaging purposes in drug development because medicinal chemists rely on estimates of confidence in a predicted outcome to direct their efforts and resources in the most efficient ways.
Second, Rainbow XenoSite covers the largest proportion of known human phase I metabolic reactions of all phase I models. We calculated the percentage contribution of each reaction type to the totality of phase I reactions in the AMD database. We estimated each model’s coverage of phase I metabolism by summing up the percentages corresponding to each reaction type included in that model. While previously published models cover up to 74.7% of phase I reactions, Rainbow XenoSite covers 92.3% of AMD phase I reactions (Table 7). Specifically, SMARTCyp, Xenosite 1.0, RSPredictor, SOMP, MetaPrint2D, and FAME 2 are five published generic SOM phase I prediction models.24-30 SMARTCyp, XenoSite 1.0/RSPredictor, SOMP, MetaPrint2D, and FAME 2 account for 45.5%, 48%, 46.1%, 74.7%, and 48% of all human phase I reactions from the AMD database, respectively (Table 7). Similarly, Site of Metabolism Estimator (SOME)35 and He et al.36 are two published multireaction phase I prediction models. SOME and He et al. account for 42.6% and 37.6% of all human phase I reactions from the AMD database, respectively (Table 7). The large difference in reaction coverage and output format makes a direct performance comparison between Rainbow XenoSite and previously published models difficult.
Third, Rainbow XenoSite is a more comprehensive model of reaction types and includes many important bioactivation reactions missed by other models. Previously, we published several models that focused on specific reactions like epoxidation, quinone species formation, N-dealkylation, S-oxidation, and N-reduction.31-34 These reactions play important roles in the bioactivation of multiple structural alerts leading to the formation of deleterious reactive metabolites.33,34 Given a molecular structure, each of the published single-reaction models outputs probabilistic prediction scores corresponding to the likelihood that each atom or bond in the molecule is a site of metabolism for that specific reaction. Rainbow XenoSite can make predictions for all of these important bioactivation reactions. In contrast, the SMARTCyp, RSPredictor, SOMP, MetaPrint2D, FAME 2, SOME, and He et al. models do not comprehensively cover these important bioactivation reactions (Table 7).
Ambiguity of Generic SOMs.
We compared the rainbow-SOM labeling-scheme to the generic-SOM labeling-scheme in term of unambiguous mapping from the labels to the reported products. Given a labeled site, we can identify the reaction types that can occur at that site by assessing whether that site matches the reaction types’ potential sites defined by SMARTS strings (see Table S6). For sites that can undergo more than one type of reactions, the ambiguous sites, we quantified how often knowledge of the site of metabolism alone is sufficient or insufficient to infer the structure of the metabolite.
Most sites marked using generic-SOM labeling-scheme are ambiguous. As an exemplar of the generic SOM labels, we used scheme previously adopted by XenoSite (XenoSite 1.0).26 XenoSite 1.0 used a generic-SOM labeling-scheme where atoms of a compound were labeled as SOM based on the structural change from substrate to product. In addition to XenoSite 1.0, published models like SMARTCyp, SOMP, MetaPrint2D, and FAME 2 also generically predict SOM and use a similar labeling-scheme.24,27-30 A single generic SOM can map to multiple possible reactions of different types, leaving ambiguity as to which metabolite is generated by metabolism of the site. Of 20 472 SOMs identified using the generic atom labeling-scheme (Table S5), 18 544 can undergo more than one reaction type, yielding 90.58% ambiguous SOMs. We identified 20 major groupings of ambiguous SOMs under this labeling-scheme (Figure 4). Of 23 872 SOMs identified using the generic bond labeling-scheme where bonds between two heavy atoms are labeled as sites, 17 061 can undergo more than one reaction type, which modestly reduces the percentage of ambiguous SOMs to 71.47%.
Figure 4.

Generic SOM labels are ambiguous. Many sites of metabolism (SOM) labeled using the generic SOM method can undergo more than one type of reaction. We list the top 20 groups of ambiguous sites. These sites were reported to undergo the reaction annotated on the left but could also undergo the reaction of the right. The numbers of known sites that can undergo at least two reaction types are listed. Example molecules are known drugs with known ambiguous SOM circled. Each reaction name in the table is colored in accordance with its corresponding reaction class.
Compared to the generic-SOM labeling-scheme, the rainbow-SOM labeling-scheme significantly reduces the ambiguity in mapping from the labels to reported products. In contrast to the generic-SOM approach, the rainbow-SOM labels specify both sites and reaction types by identifying modified bonds and the reaction classes of reactions observed at those bonds (Table S5). As a result, only 0.3% of rainbow labeled sites are ambiguous. Despite these improvements, the rainbow labels are ambiguous for a small subset of C-dealkylation reactions wherein oxygen can attach to either of the two carbons in the bond. The rainbow-SOM labeling-scheme nearly eliminates all ambiguity in mapping from the labels to reported products, which will enable metabolite structure prediction from effective rainbow-SOM models of metabolism.
Reaction-Class Specific Site-Level Accuracy.
Considering each color separately, Rainbow XenoSite accurately predicts SOMs within metabolized molecules. We used “top-two” and “average site AUC” to evaluate model accuracy. First, we measured top-two performance on a color by color basis, where a molecule was considered to be correctly predicted if any of its reported SOMs were ranked in the top two sites sorted by that class-specific prediction score. The top-two metric is commonly used to evaluate CYP site of metabolism models and is useful for assessing how the model will perform when comparing potential SOMs within individual drug candidates. Stable oxygenation, unstable oxygenation, dehydrogenation, reduction, and hydrolysis top-two accuracies were, respectively, 72.2%, 80.4%, 74.2%, 94.9%, and 94.7% (Figure 5). Across all five classes, the model had an average cross-validated top-two accuracy of 88.2%. Second, we measured average site AUC, a metric based on the area under the ROC curve (AUC). AUC is a standard metric employed in machine learning to quantify how well a model is able to distinguish between positives and negative cases of a specific chemical class. To compute average site AUC, individual AUCs are computed for each molecule in the data set, color by color. These AUCs are then averaged across the whole data set to produce a single summary statistic for each reaction class. Average site AUC accuracies for stable oxygenation, unstable oxygenation, dehydrogenation, reduction, and hydrolysis were 91.1%, 97.6%, 94.7%, 99.5%, and 99.7%, respectively. Across all five classes, the average AUC was 97.5% (Figure 5).
Figure 5.

Rainbow XenoSite accurately predicts sites of phase I metabolism. Ten-fold cross-validated accuracies are shown. Across all five classes, the model had an average cross-validated top-two, average AUC, and potential site AUC accuracies of 88.2%, 97.5%, and 92.3%, respectively.
Considering all colors together, Rainbow XenoSite accurately predicts class-specific SOMs within metabolized molecules. In contrast to the previous accuracy metrics, here all colors are considered together, and the model’s ability to correctly predict the color and site at the same time is measured. In this evaluation, each color–site pair is considered an individual entity. All pairs are ranked by the scores assigned by the model and compared with the known metabolism to verify if the color-specific SOMs are separated from the rest. With all reaction color considered together, the model has top-two and average site AUC of 78.2% and 97.3%, respectively.
Rainbow XenoSite can accurately distinguish metabolized sites from all other potential sites across the entire data set. To evaluate this claim, we introduce the “potential site AUC” metric. In this metric, sites that are unable to undergo metabolism via a certain reaction color, i.e. not matching any SMARTS patterns that defining the corresponding potential site set, were removed from the calculation of the potential site AUC for that reaction color because they can be easily predicted as not-metabolized by both human experts and machine learning models. We then calculated AUCs for the remaining potential sites for each metabolism color.55 Stable oxygenation, unstable oxygenation, dehydrogenation, reduction, and hydrolysis potential site AUC accuracies were 85.4%, 94.3%, 86.8%, 98.2%, and 93.9%, respectively. Across all five targets, the model had an average potential site AUC of 92.3% (Figure 5).
Rainbow XenoSite can also accurately identify which of the five colors of metabolism are most likely for a given site (Figure 6). For each metabolized site, we constructed computed AUCs from the scores assigned to each of the five metabolism colors. The “average reaction-specificity AUC” reflects the model’s ability to specify a reaction type for a metabolized site. The average reaction-specificity AUC was 97.4%.
Figure 6.

Rainbow XenoSite accurately predicts the phase I metabolism of six example drugs. The highest scoring sites as predicted by Rainbow XenoSite correspond to known sites of metabolism, both for combined phase I metabolism and for each reaction type individually. From top to bottom, example drugs shown include chloramphenicol, levomepromazine, diethylstibestrol, methamphetamine, terbinafine, and belinostat. Circles mark known sites of metabolism. Predicted scores were collected from 10-fold cross-validated experiments.
Reaction-Type Specific Site-Level Accuracy.
In addition to making accurate predictions among the five colors of metabolism, Rainbow XenoSite can accurately separate metabolized sites from nonmetabolized sites for each of the 21 phase I reaction types included. To evaluate this claim, we computed metrics on both reaction-type specific potential sites only (PS) and across all training sites (global) (Table 8). Across 21 reaction types, our Rainbow XenoSite had an average cross-validated potential site AUC and global AUC of 85.7% and 99.0%, respectively.
Table 8.
Reaction-Type Specific Accuracy
| Rainbow XenoSite |
|||||
|---|---|---|---|---|---|
| reaction type | PS | global | SOME35 | He et al.36 | |
| red | S-oxidation | 89.4% | 99.9% | 92.9%a | |
| C-hydroxylation | 79.8% | 93.8% | 89.4%a | ||
| N-oxidation | 91.1% | 99.6% | 96.9%a | ||
| aromatic epoxidation | 95.8% | 99.5% | |||
| aliphatic epoxidation | 89.5% | 97.5% | |||
| orange | N-dealkylation | 94.2% | 99.5% | 95.4%a | 95.5%a |
| oxidative dehalogenation | 82.8% | 99.9% | |||
| O-dealkylation | 92.3% | 99.6% | 94.3%a | ||
| S-dealkylation | 76.1% | 99.9% | |||
| C-dealkylation | 86.0% | 96.5% | |||
| green | aliphatic dehydegenation | 87.8% | 94.6% | ||
| quinone formation | 92.1% | 99.8% | |||
| aromatic dehydrogenation | 90.4% | 97.2% | |||
| blue | amide hydrolysis | 77.3% | 99.8% | ||
| ester hydrolysis | 81.1% | 99.9% | |||
| etder hydrolysis | 79.6% | 99.6% | |||
| purple | nitro reduction | 91.8% | 99.9% | ||
| aliphatic hydrogenation | 98.7% | 99.9% | |||
| carbonyl/sulfo reduction | 95.2% | 99.9% | |||
| reductive dehalogenation | 99.2% | 99.9% | |||
| aromatic hydrogenation | 97.9% | 99.9% | |||
There was no secure online web server available for the user to submit test molecules for either SOME35 or He et al.36 models. As a result, Rainbow XenoSite, SOME, and He et al. could not be evaluated on the same set of test molecules. The reported accuracies across all training sites from SOME and He et al. models on the same reaction types supported by Rainbow XenoSite are shown. This comparison is inexact.
Ideally, we would like to know how well our model performs in predicting reaction-types in comparison to existing models: SOME35 and He et al.36 using the same set of molecules. Unfortunately, there was no secure online web server available for the user to submit test molecules for either existing model. As a result, we can only report accuracies across all training sites from SOME35 and He et al.36 models on the same reaction types (Table 8). This comparison is inexact, since the specific molecules used to calculate performance metrics differ among the models.
Molecule-Level Model Accuracy.
Rainbow XenoSite accurately predicts whether a molecule undergoes specific classes of phase I reaction. In our training data set, each substrate was metabolized through one or more reaction classes but rarely through all five types. As a result, not all training molecules are a substrate of a certain reaction class. For each reaction class, we used the “molecule AUC” metric to evaluate how well the model separated class-specific substrates from nonsubstrates. Rainbow XenoSite has molecule AUCs of 78.3%, 83.9%, 77.3%, 90.4%, and 92.7% for stable oxygenation, unstable oxygenation, dehydrogenation, reduction, and hydrolysis, respectively (Figure 7).
Figure 7.

Rainbow XenoSite accurately predicts substrates of phase I metabolism. Receiver-operating characteristic curves based on 10-fold cross-validated predictions are shown. Rainbow XenoSite has molecule AUCs of 78.3%, 83.9%, 77.3%, 90.4%, and 92.7% for stable oxygenation, unstable oxygenation, dehydrogenation, reduction, and hydrolysis, respectively.
Probability Scaling of Model Output.
The model’s outputs can be interpreted as probabilities. When we binned class-specific sites by the phase I prediction score, the proportion of class-specific SOMs in each bin closely correlated with the bin’s score (Figure S1). Likewise, when we binned molecules by the phase I molecule scores, the proportion of class-specific metabolized molecules in each bin also correlates with the bin score (Figure S2). Quantitatively, the Pearson regression coefficients of site and molecule levels were 0.996 and 0.947, respectively.
Reactive Metabolite Forming Reactions.
Predicting the formation electrophilically reactive metabolites is an important step in avoiding idiosyncratic adverse drug reactions.56-59 Experimental methods for detecting reactive metabolites, most frequently in vitro incubation with glutathione and cyanide, are well-established.60-62 However, these methods require significant time and resources, especially when screening thousands of compounds during drug development. Our previous works and others have shown the instrumental role of computational methods in directing these experimental efforts.23,31,32,34 We published several models that focused on specific reactions like epoxidation,31 quinone species formation,32 S-oxidation,34 nitroaromatic reduction,34 and N-dealkylation.33 These reactions play important roles the bioactivation of multiple structural alerts leading to the formation of deleterious reactive metabolites.34 Given a molecular structure, each of these models outputs probabilistic prediction scores corresponding to the likelihood that each atom or bond in the molecule is a site of metabolism for that specific reaction. The following five sections demonstrate that Rainbow XenoSite can predict reactive metabolite formation reactions with high accuracy, comparable to previous models of individual reaction types.
Epoxidation.
Epoxides, the second most common type of reactive metabolites, are often formed via P450-mediated oxidation of double bonds or aromatic rings.37,63 Epoxides are detoxified by epoxide hydrolases and the glutathione system.64-67 When these pathways are overwhelmed, epoxides can covalently bind to proteins and cause toxic side effects and immune reactions.
Rainbow XenoSite can predict the formation of this key reactive metabolite and is comparable in accuracy to our previous epoxidation model.31 The epoxidation model was trained on a data set containing 524 molecules, 389 of which contained sites of epoxidation. Our model was able to predict this data set with an accuracy of 92.7% potential site AUC (Figure 8A), compared to the potential site AUC of 94.3% of the previous epoxidation model (two-sided p = 0.097). Reliability plot of unscaled stable oxygenation on potential epoxidation sites demonstrate that the scores can be interpreted as probabilities (Figure S3A).
Figure 8.

Rainbow XenoSite accurately predicts key reactive metabolite formation reactions. Previously, we trained multiple models, each accurately predict a specific reactive metabolite formation reactions: epoxidation, one-step quinone formation, N-dealkylation, nitroaromatic reduction, and thiophene S-oxidation.23,31,32,34 Rainbow XenoSite performs as well as the previous models on these reactive metabolite formation reactions. The previous models’ potential site AUC accuracies on epoxidation, one-step quinone formation, N-dealkylation, nitroaromatic reduction, and thiophene S-oxidation data sets are 94.3%, 92.5%, 94.7%, 93.0%, and 88.0%, respectively. Rainbow XenoSite potential site AUC accuracies are 92.7%, 90.1%, 92.2%, 90.1%, and 86% on epoxidation, one-step quinone formation, N-dealkylation, nitroaromatic reduction, and thiophene S-oxidation data sets, respectively. The differences between each pair of performances are statistically insignificant. Data sets of 524, 39, 883, 98, and 50 molecules were used to test Rainbow XenoSite performance on epoxidation, one-step quinone formation, N-dealkylation, nitroaromatic reduction, and thiophene S-oxidation. Example molecules are shown with Rainbow XenoSite cross-validated scaled prediction (refer to Prediction Aggregation and Scaling).
One-Step Quinone Formation.
Quinone is the most common class of reactive metabolites, accounting for 40% of known reactive metabolites.68 Quinone species are frequently highly electrophilically reactive.38 Quinones are formed through one or two metabolic steps.32 In one-step quinone formation, the parent compound undergoes dehydrogenation to form the quinone metabolite. In two-step quinone formation, the parent compound undergoes a hydroxylation step following by a dehydrogenation step to form the quinone metabolite.
Rainbow XenoSite predicted the formation of this important reactive metabolite. Our model predicted a data set of 39 molecules that form quinone through one-step (dehydrogenation) with an accuracy of 90.1% AUC across all quinone formation potential sites (Figure 8B). This performance is comparable the potential site AUC of 92.5% of previous quinone formation model (two-sided p = 0.36).32 Reliability plot of unscaled dehydrogenation scores on potential quinone sites demonstrate that the scores are well-scaled probabilities (Figure S3B).
Unfortunately, Rainbow XenoSite does not predict two-step quinone formation reactions. Only a small subset of quinones are formed via one-step of metabolism. This is an intrinsic limitation of this approach, but it might be addressed by an algorithm that chain predictions of the Rainbow XenoSite into multiple steps. This possibility is out of scope of this study and will be considered future work.
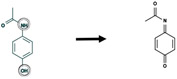
N-Dealkylation.
Alkylated amines are a class of compounds with important biological and pharmaceutical functions.69,70 N-dealkylation, the replacement of an alkyl group by hydrogen, is the main metabolism pathway for many alkylated amines.71-73 This removed alkyl group is often transformed into a reactive aldehyde. Unfortunately, metabolic studies often focus on the amine metabolite and do not report the aldehyde metabolite because aldehydes are presumed to be quickly detoxified to carboxylic acids and alcohols by multiple enzyme systems. However, some reactive aldehydes escape these detoxification pathways, and form adducts that can give rise to adverse drug events, especially in patients where the detoxification pathways are inhibited by other drugs.74,75
Rainbow XenoSite accurately predicts sites of N-dealkylation on the data set of 883 molecules used to train our previous N-dealkylation model.33 Rainbow XenoSite predicted N-dealkylation with an accuracy of 92.2% global AUC (Figure 8C). This accuracy is comparable to the global AUC accuracy of 94.7% of our previous N-dealkylation model (two-sided p = 0.08). Reliability plot of unscaled unstable oxygenation on potential N-dealkylation sites demonstrate that the scores can be interpreted as probabilities (Figure S3C).
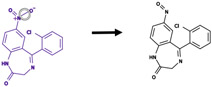
Nitroaromatics Reduction.
Nitroaromatics are common in the environment and are important pharmacophores in many drugs.76-79 Unfortunately, nitroaromatic groups can metabolically transform into electrophilic, highly unstable intermediates such as nitroso and nitro anion radicals through reduction.34,80-82
Rainbow XenoSite accurately predicts nitroaromatic reduction. Previously, we published the prediction from an early version of Rainbow XenoSite on nitroaromatic-containing drugs. The early version model was trained on a data set containing 3061 molecules, 98 of which contain nitroaromatics.34 In comparison, the training data set of the current Rainbow XenoSite contains 314 nitroaromatic molecules. Rainbow XenoSite predicted nitro-reduction of the 98 molecules with an AUC accuracy of 90.1% (Figure 8D), compared to 93.0% obtained by the early version of the model (two-sided p = 0.16). Reliability plot of unscaled reduction on nitroaromatics demonstrate that the scores can be interpreted as probabilities (Figure S3D).
Thiophene S-Oxidation.
Thiophenes are five-membered sulfur-containing aromatic rings that are important pharmacophores in many drugs.83-89 Thiophenes can undergo P450-mediated S-oxidation to form a reactive sulfur oxide, which can subsequently bind to proteins causing toxic side effects. For example, suprofen is a thiophene-containing analgesic medication that failed in late-stage clinical trials because of the formation of a short-lived reactive metabolite that caused irreversible inhibition of phase I enzymes.90 However, many nontoxic drugs also contain thiophenes that are not bioactivated, such as eprosartan, a closely related analogue to suprofen.91
Rainbow XenoSite can predict thiophene S-oxidation. Previously, we published the predictions from an early version of Rainbow XenoSite on thiophene-containing compounds.34 The training data set of the earlier model contained 50 thiophene containing compounds,34 compared to 105 in the training data for the current study. Our current Rainbow XenoSite predicted thiophene S-oxidation with a global AUC accuracy of 86.0% (Figure 8D), compared to the previous model’s performance of 88.0% (two-sided p = 0.398). The reliability plot of unscaled stable oxygenation on thiophenes demonstrate that the scores can be interpreted as probabilities (Figure S3E).
Model Limitations.
Rainbow XenoSite has several limitations. First, our model does not cover all phase I reactions. Although rare, excluded reactions include tautomerization, isomerization, and rearrangement, which can have important implications on the efficacy and safety profile of drugs. In the future, improved models may be able to label and group these reaction types with a similar approach. Second, while the current SOM labeling scheme significantly reduced ambiguity, it does not provide sufficient information to predict the exact metabolites of a small number of reactions, about 0.3% of the total. In future studies, we could add an ordering to the labeling of bonds, enabling us to distinguish the exact site of oxygen addition in C-dealkylation reactions. Such an order-dependent SOM label would remove the ambiguity in these rare cases. Third, the model slightly underperformed previously developed models of specific reactive metabolite generating reactions, though the drop in performance was not statistically significant. It is possible that improved descriptors or training protocols could change this general trend. Fourth, Rainbow XenoSite only considers the metabolic aspect of IADRs. However, IADRs are complex phenomenon with other important aspects, including dosage, route of administration, competing bioactive and detoxification pathways, comorbidities, coadministered medications, and genetic variants.92-94
CONCLUSIONS
Published site of metabolism models can provide both accurate and rapid screening for large numbers of small molecules. Unfortunately, they are unable to unambigously identify the type of reaction at each predicted site. This ambiguity makes it difficult to discern whether a harmful metabolic transformation would occur. The current study demonstrated that modeling both site and type of reaction can enable unambiguous metabolite structure prediction. We developed a labeling-scheme that reduced the number of ambiguous SOMs from 90.6% to 0.3%. We also showed that it is possible to develop a single, simple, interpretable model for a wide variety of phase I reaction types by grouping them into classes and using a multitarget deep neural network model. This labeling approach allows us to capture 92.3% of observed phase I reactions, a substantial improvement over current literature approaches. Our model predicted the five classes of phase I metabolism with top-two, average site AUC, and potential site AUC accuracies of 78.2%, 97.3%, and 92.3%, respectively. In comparison to previous models exclusively designed for specific reaction types, our model performed equally well on several important structural alert bioactivation pathways. These results underscore the feasibility of reducing ascertainment bias inherent in reaction-specific models without sacrificing performance. While we have not comprehensively handled all the relevant complexities of predicting a compound’s likelihood of metabolism-induced toxicity, we are moving closer to that goal. Ultimately, we envision that combined models of metabolism, metabolite structure prediction, and reactivity prediction will provide a powerful tool in assessing the IADR risk of new drug candidates.
Supplementary Material
ACKNOWLEDGMENTS
The authors thank the developers of the open-source cheminformatics tools Open Babel and RDKit and machine learning toolkit TensorFlow, of which we made significant use.
Funding
Research reported in this publication was supported by the National Library Of Medicine of the National Institutes of Health under award number R01LM012222 and R01LM012482. Computations were performed using the facilities of the Washington University Center for High Performance Computing, which were partially funded by National Institutes of Health (NIH) grant numbers 1S10RR022984-01A1 and 1S10OD018091-01. The content is solely the responsibility of the authors and does not necessarily represent the official views of the National Institutes of Health. We also thank both the Department of Immunology and Pathology at the Washington University School of Medicine and the Washington University Center for Biological Systems Engineering for their generous support of this work.
ABBREVIATIONS
- ADR
adverse drug reaction
- AMD
Accelrys Metabolite Database
- AUC
area under the receiver operating characteristic curve
- CYP
Cytochromes P450
- SOM
site of metabolism
Footnotes
The authors declare no competing financial interest.
Supporting Information
The Supporting Information is available free of charge at https://pubs.acs.org/doi/10.1021/acs.jcim.9b00836.
Full list of atom, bond, and molecule descriptors in Tables S1, S2, and S3, respectively (PDF)
AMD_Registry_Numbers.csv, which lists unique molecules IDs, associated molecule and reaction registry numbers, and their CYP isozymes- and HML-mediated metabolic status (ZIP)
REFERENCES
- (1).Williams JA; Hyland R; Jones BC; Smith DA; Hurst S; Goosen TC; Peterkin V; Koup JR; Ball SE Drug-Drug Interactions for UDP-glucuronosyltransferase Substrates: A Pharmacokinetic Explanation for Typically Observed Low Exposure (AUCi/AUC) Ratios. Drug Metab. Dispos 2004, 32, 1201–1208. [DOI] [PubMed] [Google Scholar]
- (2).Guengerich FP Cytochromes P450, Drugs, and Diseases. Mol. Interventions 2003, 3, 194. [DOI] [PubMed] [Google Scholar]
- (3).Danielson P The Cytochrome P450 Superfamily: Biochemistry, Evolution and Drug Metabolism in Humans. Curr. Drug Metab 2002, 3, 561–597. [DOI] [PubMed] [Google Scholar]
- (4).Guengerich FP Common and Uncommon Cytochrome P450 Reactions Related to Metabolism and Chemical Toxicity. Chem. Res. Toxicol 2001, 14, 611–650. [DOI] [PubMed] [Google Scholar]
- (5).Lewis DF 57 Varieties: The Human Cytochromes P450. Pharmacogenomics 2004, 5, 305–318. [DOI] [PubMed] [Google Scholar]
- (6).Kruger CL; Hayes AW Metabolism: A Determinant of Toxicity. Princ. Methods Toxicol, 6th ed.; 2014; Chapter 4, pp 59–100. [Google Scholar]
- (7).Guengerich FP Cytochrome P450s and Other Enzymes in Drug Metabolism and Toxicity. AAPS J. 2006, 8, E101–E111. [DOI] [PMC free article] [PubMed] [Google Scholar]
- (8).Lee WM Drug-Induced Hepatotoxicity. N. Engl. J. Med 2003, 349, 474–485. [DOI] [PubMed] [Google Scholar]
- (9).Pandit A; Sachdeva T; Bafna P Drug-Induced Hepatotoxicity: A Review. J. Appl. Pharm. Sci 2012, 233–243. [Google Scholar]
- (10).Miller EC; Miller JA In Vivo Combinations Between Carcinogens and Tissue Constituents and Their Possible Role in Carcinogenesis. Cancer Res. 1952, 12, 547–556. [PubMed] [Google Scholar]
- (11).Holtzman JL Role of Reactive Oxygen and Metabolite Binding in Drug Toxicity. Life Sci. 1982, 30, 1–9. [DOI] [PubMed] [Google Scholar]
- (12).Park BK; Kitteringham NR; Maggs JL; Pirmohamed M; Williams DP The Role of Metabolic Activation in Drug-Induced Hepatotoxicity. Annu. Rev. Pharmacol. Toxicol 2005, 45, 177–202. [DOI] [PubMed] [Google Scholar]
- (13).Nelson SD; Pearson PG Covalent and Noncovalent Interactions in Acute Lethal Cell Injury Caused by Chemicals. Annu. Rev. Pharmacol. Toxicol 1990, 30, 169–195. [DOI] [PubMed] [Google Scholar]
- (14).Guengerich FP; MacDonald JS Applying Mechanisms of Chemical Toxicity to Predict Drug Safety. Chem. Res. Toxicol 2007, 20, 344–369. [DOI] [PubMed] [Google Scholar]
- (15).Tang W; Lu AY Metabolic Bioactivation and Drug-Related Adverse Effects: Current Status and Future Directions From a Pharmaceutical Research Perspective. Drug Metab. Rev 2010, 42, 225–249. [DOI] [PubMed] [Google Scholar]
- (16).Jaeschke H; Gores GJ; Cederbaum AI; Hinson JA; Pessayre D; Lemasters JJ Mechanisms of Hepatotoxicity. Toxicol. Sci 2002, 65, 166–176. [DOI] [PubMed] [Google Scholar]
- (17).Walgren JL; Mitchell MD; Thompson DC Role of Metabolism in Drug-Induced Idiosyncratic Hepatotoxicity. Crit. Rev. Toxicol 2005, 35, 325–361. [DOI] [PubMed] [Google Scholar]
- (18).Stepan AF; Walker DP; Bauman J; Price DA; Baillie TA; Kalgutkar AS; Aleo MD Structural Alert/Reactive Metabolite Concept as Applied in Medicinal Chemistry to Mitigate the Risk of Idiosyncratic Drug Toxicity: A Perspective Based on the Critical Examination of Trends in the Top 200 Drugs Marketed in the United States. Chem. Res. Toxicol 2011, 24, 1345–1410. [DOI] [PubMed] [Google Scholar]
- (19).Cravedi JP; Perdu-Durand E; Baradat M; Alary J; Debrauwer L; Bories G Chloramphenicol Oxamylethanolamine as an End Product of Chloramphenicol Metabolism in Rat and Humans: Evidence for the Formation of a Phospholipid Adduct. Chem. Res. Toxicol 1995, 8, 642–648. [DOI] [PubMed] [Google Scholar]
- (20).Gross BJ; Branchflower RV; Burke TR; Lees DE; Pohl LR Bone Marrow Toxicity in Vitro of Chloramphenicol and Its Metabolites. Toxicol. Appl Pharmacol 1982, 64, 557–565. [DOI] [PubMed] [Google Scholar]
- (21).Yunis AA Differential In-Vitro Toxicity of Chloramphenicoi, Nitroso-Chloramphenicol, and Thiamphenicol. Sex. Sex. Transm. Dis 1984, 11, 340–342. [DOI] [PubMed] [Google Scholar]
- (22).Feder HMJ; Osier C; Maderazo EG Chloramphenicol: A Review of Its Use in Clinical Practice. Clin. Infect. Dis 1981, 3, 479–491. [DOI] [PubMed] [Google Scholar]
- (23).Hughes TB; Dang NL; Miller GP; Swamidass SJ Modeling Reactivity to Biological Macromolecules With a Deep Multitask Network. ACS Cent. Sci 2016, 2, 529–537. [DOI] [PMC free article] [PubMed] [Google Scholar]
- (24).Rydberg P; Gloriam DE; Zaretzki J; Breneman C; Olsen L SMARTCyp: A 2D Method for Prediction of Cytochrome P450-Mediated Drug Metabolism. ACS Med. Chem. Lett 2010, 1, 96–100. [DOI] [PMC free article] [PubMed] [Google Scholar]
- (25).Zaretzki J; Rydberg P; Bergeron C; Bennett KP; Olsen L; Breneman CM RS-Predictor Models Augmented With SMARTCyp Reactivities: Robust Metabolic Regioselectivity Predictions for Nine CYP Isozymes. J. Chem. Inf. Model 2012, 52, 1637–1659. [DOI] [PMC free article] [PubMed] [Google Scholar]
- (26).Zaretzki J; Matlock M; Swamidass SJ XenoSite: Accurately Predicting CYP-mediated Sites of Metabolism With Neural Networks. J. Chem. Inf. Model 2013, 53, 3373–3383. [DOI] [PubMed] [Google Scholar]
- (27).Rudik AV; Dmitriev AV; Lagunin AA; Filimonov DA; Poroikov VV Metabolism Site Prediction Based on Xenobiotic Structural Formulas and PASS Prediction Algorithm. J. Chem. Inf. Model 2014, 54, 498–507. [DOI] [PubMed] [Google Scholar]
- (28).Rudik A; Dmitriev A; Lagunin A; Filimonov D; Poroikov V SOMP: Web-Server for in Silico Prediction of Sites of Metabolism for Drug-Like Compounds. Bioinformatics 2015, 31, 2046. [DOI] [PubMed] [Google Scholar]
- (29).Adams SE Molecular Similarity and Xenobiotic Metabolism. Ph.D. thesis, University of Cambridge, 2010. [Google Scholar]
- (30).Šícho M; de Bruyn Kops C; Stork C; Svozil D; Kirchmair J FAME 2: Simple and Effective Machine Learning Model of Cytochrome P450 Regioselectivity. J. Chem. Inf. Model 2017, 57, 1832–1846. [DOI] [PubMed] [Google Scholar]
- (31).Hughes TB; Miller GP; Swamidass SJ Modeling Epoxidation of Drug-Like Molecules With a Deep Machine Learning Network. ACS Cent. Sci 2015, 1, 168–180. [DOI] [PMC free article] [PubMed] [Google Scholar]
- (32).Hughes TB; Swamidass SJ Deep Learning to Predict the Formation of Quinone Species in Drug Metabolism. Chem. Res. Toxicol 2017, 30, 642–656. [DOI] [PMC free article] [PubMed] [Google Scholar]
- (33).Dang NL; Hughes TB; Miller GP; Swamidass SJ Computationally Assessing the Bioactivation of Drugs by N-Dealkylation. Chem. Res. Toxicol 2018, 31, 68–80. [DOI] [PMC free article] [PubMed] [Google Scholar]
- (34).Dang NL; Hughes TB; Miller GP; Swamidass SJ Computational Approach to Structural Alerts: Furans, Phenols, Nitroaromatics, and Thiophenes. Chem. Res. Toxicol 2017, 30, 1046–59. [DOI] [PMC free article] [PubMed] [Google Scholar]
- (35).Zheng M; Luo X; Shen Q; Wang Y; Du Y; Zhu W; Jiang H Site of Metabolism Prediction for Six Biotransformations Mediated by Cytochromes P450. Bioinformatics 2009, 25, 1251–1258. [DOI] [PubMed] [Google Scholar]
- (36).He S; Li M; Ye X; Wang H; Yu W; He W; Wang Y; Qiao Y Site of Metabolism Prediction for Oxidation Reactions Mediated by Oxidoreductases Based on Chemical Bond. Bioinformatics 2016, btw617. [DOI] [PubMed] [Google Scholar]
- (37).Lamb DC; Waterman MR; Zhao B Streptomyces Cytochromes P450: Applications in Drug Metabolism. Expert Opin. Drug Metab. Toxicol 2013, 9, 1279–1294. [DOI] [PubMed] [Google Scholar]
- (38).Schwöbel JA; Wondrousch D; Koleva YK; Madden JC; Cronin MT; Schüürmann G Prediction of Michael-Type Acceptor Reactivity Toward Glutathione. Chem. Res. Toxicol 2010, 23, 1576–1585. [DOI] [PubMed] [Google Scholar]
- (39).Landrum G Open-Source Cheminformatics and Machine Learning. 2006; http://www.rdkit.org/ (accessed June 14th, 2017). [Google Scholar]
- (40).Martin E; Mukherjee P; Sullivan D; Jansen J Profile-Qsar: A Novel Meta-Qsar Method That Combines Activities Across the Kinase Family to Accurately Predict Affinity, Selectivity, and Cellular Activity. J. Chem. Inf. Model 2011, 51, 1942–1956. [DOI] [PubMed] [Google Scholar]
- (41).DAYLIGHT Chemical Information Systems, Inc. SMARTS–A Language for Describing Molecular Patterns. 1997; http://www.daylight.com/dayhtml/doc/theory/theory.smarts.html (accessed June 14th, 2017).
- (42).O'Boyle NM; Banck M; James CA; Morley C; Vandermeersch T; Hutchison GR Open Babel: An Open Chemical Toolbox. J. Cheminf 2011, 3, 33. [DOI] [PMC free article] [PubMed] [Google Scholar]
- (43).Hughes TB; Miller GP; Swamidass SJ Site of Reactivity Models Predict Molecular Reactivity of Diverse Chemicals With Glutathione. Chem. Res. Toxicol 2015, 28, 797–809. [DOI] [PMC free article] [PubMed] [Google Scholar]
- (44).Pan SJ; Yang Q A Survey on Transfer Learning. IEEE Transactions on knowledge and data engineering 2010, 22, 1345–1359. [Google Scholar]
- (45).Dahl GE; Jaitly N; Salakhutdinov R Multi-Task Neural Networks for QSAR Predictions. arXiv, 2014, 1406.1231. [Google Scholar]
- (46).Abadi M; Agarwal A; Barham P; Brevdo E; Chen Z; Citro C; Corrado GS; Davis A; Dean J; Devin M; Ghemawat S; Goodfellow I; Harp A; Irving G; Isard M; Jia Y; Jozefowicz R; Kaiser L; Kudlur M; Levenberg J; Mané D; Monga R; Moore S; Murray D; Olah C; Schuster M; Shlens J; Steiner B; Sutskever H ; Talwar K; Tucker P; Vanhoucke V; Vasudevan V; Viégas F; Vinyals O; Warden P; Wattenberg M; Wicke M; Yu Y; Zheng X TensorFlow: Large-Scale Machine Learning on Heterogeneous Systems. 2015; http://tensorflow.org/ (accessed April 4th, 2017). [Google Scholar]
- (47).Jones E; Oliphant T; Peterson P SciPy: Open Source Scientific Tools for Python. 2001; http://www.scipy.org/ (accessed June, 14th, 2018). [Google Scholar]
- (48).Byrd RH; Lu P; Nocedal J; Zhu C A Limited Memory Algorithm for Bound Constrained Optimization. SIAM Journal on Scientific Computing 1995, 16, 1190–1208. [Google Scholar]
- (49).Wong B Points of View: Color Coding. Nat. Methods 2010, 7, 573–573. [DOI] [PubMed] [Google Scholar]
- (50).Krzywinski M; Birol I; Jones S; Marra M Getting Into Visualization of Large Biological Data Sets. 2012; http://mkweb.bcgsc.ca/biovis2012/krzywinski-visualizing-biological-data.pdf/ (accessed June 14th, 2017). [Google Scholar]
- (51).Borland D; Taylor RM Rainbow Color Map (Still) Considered Harmful. IEEE computer graphics and applications 2007, 27, 14–17. [DOI] [PubMed] [Google Scholar]
- (52).Light A; Bartlein PJ The End of the Rainbow? Color Schemes for Improved Data Graphics. Trans., Am. Geophys. Union 2004, 85, 385–391. [Google Scholar]
- (53).Bujack R; Turton TL; Samsel F; Ware C; Rogers DH; Ahrens J The Good, the Bad, and the Ugly: A Theoretical Framework for the Assessment of Continuous Colormaps. IEEE Transactions on Visualization and Computer Graphics 2018, 24, 923–933. [DOI] [PubMed] [Google Scholar]
- (54).Kalgutkar AS; Gardner I; Obach RS; Shaffer CL; Callegari E; Henne KR; Mutlib AE; Dalvie DK; Lee JS; Nakai Y; O’Donnell JP; Boer J; Harriman SP A Comprehensive Listing of Bioactivation Pathways of Organic Functional Groups. Curr. Drug Metab 2005, 6, 161–225. [DOI] [PubMed] [Google Scholar]
- (55).Swamidass SJ; Azencott C-A; Daily K; Baldi P A CROC Stronger Than ROC: Measuring, Visualizing and Optimizing Early Retrieval. Bioinformatics 2010, 26, 1348–1356. [DOI] [PMC free article] [PubMed] [Google Scholar]
- (56).Shenton JM; Chen J; Uetrecht JP Animal Models of Idiosyncratic Drug Reactions. Chem.-Biol. Interact 2004, 150, 53–70. [DOI] [PubMed] [Google Scholar]
- (57).Adams DH; Ju C; Ramaiah SK; Uetrecht J; Jaeschke H Mechanisms of Immune-Mediated Liver Injury. Toxicol. Sci 2010, 115, 307–321. [DOI] [PMC free article] [PubMed] [Google Scholar]
- (58).Pichler WJ; Naisbitt DJ; Park BK Immune Pathomechanism of Drug Hypersensitivity Reactions. J. Allergy Clin. Immunol 2011, 127, S74–S81. [DOI] [PubMed] [Google Scholar]
- (59).Stachulski AV; Baillie TA; Kevin Park B; Scott Obach R; Dalvie DK; Williams DP; Srivastava A; Regan SL; Antoine DJ; Goldring CE; Chia AJ; Kitteringham NR; Randle LE; Callan H; Luis CJ; Farrell J; Naisbitt DJ; Lennard MS The Generation, Detection, and Effects of Reactive Drug Metabolites. Med. Res. Rev 2013, 33, 985–1080. [DOI] [PubMed] [Google Scholar]
- (60).Zhu M; Ma L; Zhang H; Humphreys WG Detection and Structural Characterization of Glutathione-Trapped Reactive Metabolites Using Liquid Chromatography-High-Resolution Mass Spectrometry and Mass Defect Filtering. Anal. Chem 2007, 79, 8333–8341. [DOI] [PubMed] [Google Scholar]
- (61).Rousu T; Pelkonen O; Tolonen A Rapid Detection and Characterization of Reactive Drug Metabolites in Vitro Using Several Isotope-Labeled Trapping Agents and Ultra-Performance Liquid Chromatography/Time-of-Flight Mass Spectrometry. Rapid Commun. Mass Spectrom 2009, 23, 843–855. [DOI] [PubMed] [Google Scholar]
- (62).Jian W; Liu H-F; Zhao W; Jones E; Zhu M Simultaneous Screening of Glutathione and Cyanide Adducts Using Precursor Ion and Neutral Loss Scans-Dependent Product Ion Spectral Acquisition and Data Mining Tools. J. Am. Soc. Mass Spectrom 2012, 23, 964–976. [DOI] [PubMed] [Google Scholar]
- (63).Rydberg P; Lonsdale R; Harvey JN; Mulholland AJ; Olsen L Trends in Predicted Chemoselectivity of Cytochrome P450 Oxidation: B3LYP Barrier Heights for Epoxidation and Hydroxylation Reactions. J. Mol. Graphics Modell. 2014, 52, 30–35. [DOI] [PubMed] [Google Scholar]
- (64).Morisseau C Role of Epoxide Hydrolases in Lipid Metabolism. Biochimie 2013, 95, 91–95. [DOI] [PMC free article] [PubMed] [Google Scholar]
- (65).Fretland AJ; Omiecinski CJ Epoxide Hydrolases: Biochemistry and Molecular Biology. Chem.-Biol. Interact 2000, 129, 41–59. [DOI] [PubMed] [Google Scholar]
- (66).Seidegård J; Ekström G The Role of Human Glutathione Transferases and Epoxide Hydrolases in the Metabolism of Xenobiotics. Environ. Health Perspect 1997, 105, 791–799. [DOI] [PMC free article] [PubMed] [Google Scholar]
- (67).Srivastava SK; Watkins SC; Schuetz E; Singh SV Role of Glutathione Conjugate Efflux in Cellular Protection Against Benzo [A] Pyrene-7, 8-Diol-9, 10-Epoxide–Induced DNA Damage. Mol. Carcinog 2002, 33, 156–162. [PubMed] [Google Scholar]
- (68).Testa B; Pedretti A; Vistoli G Reactions and Enzymes in the Metabolism of Drugs and Other Xenobiotics. Drug Discovery Today 2012, 17, 549–560. [DOI] [PubMed] [Google Scholar]
- (69).Simplicio AL; Clancy JM; Gilmer JF Prodrugs for Amines. Molecules 2008, 13, 519–547. [DOI] [PMC free article] [PubMed] [Google Scholar]
- (70).Baumann M; Baxendale IR An Overview of the Synthetic Routes to the Best Selling Drugs Containing 6-Membered Heterocycles. Beilstein J. Org. Chem 2013, 9, 2265–2319. [DOI] [PMC free article] [PubMed] [Google Scholar]
- (71).Wong DT; Bymaster FP; Reid LR; Mayle DA; Krushinski JH; Robertson DW Norfluoxetine Enantiomers as Inhibitors of Serotonin Uptake in Rat Brain. Neuropsychopharmacology 1993, 8, 337–344. [DOI] [PubMed] [Google Scholar]
- (72).Guengerich F; Okazaki O; Seto Y; Macdonald T Radical Cation Intermediates in N-Dealkylation Reactions. Xenobiotica 1995, 25, 689–709. [DOI] [PubMed] [Google Scholar]
- (73).Hiemke C; Härtter S Pharmacokinetics of Selective Serotonin Reuptake Inhibitors. Pharmacol. Ther 2000, 85, 11–28. [DOI] [PubMed] [Google Scholar]
- (74).Sanoh S; Tayama Y; Sugihara K; Kitamura S; Ohta S Significance of Aldehyde Oxidase During Drug Development: Effects on Drug Metabolism, Pharmacokinetics, Toxicity, and Efficacy. Drug Metab. Pharmacokinet 2015, 30, 52–63. [DOI] [PubMed] [Google Scholar]
- (75).Barr JT; Jones JP Evidence for Substrate-Dependent Inhibition Profiles for Human Liver Aldehyde Oxidase. Drug Metab. Dispos 2013, 41, 24–29. [DOI] [PMC free article] [PubMed] [Google Scholar]
- (76).Purohit V; Basu AK Mutagenicity of Nitroaromatic Compounds. Chem. Res. Toxicol 2000, 13, 673–692. [DOI] [PubMed] [Google Scholar]
- (77).Ritter CL; Malejka-Giganti D Nitroreduction of Nitrated and C-9 Oxidized Fluorenes in Vitro. Chem. Res. Toxicol 1998, 11, 1361–1367. [DOI] [PubMed] [Google Scholar]
- (78).Nelson SD Biological Reactive Intermediates VI; Springer: Boston, MA, 2001; pp 33–43. [Google Scholar]
- (79).Williams DP; Naisbitt DJ Toxicophores: Groups and Metabolic Routes Associated With Increased Safety Risk. Curr. Opin. Drug Discovery Dev 2002, 5, 104–115. [PubMed] [Google Scholar]
- (80).Boelsterli UA; Ho HK; Zhou S; Yeow Leow K Bioactivation and Hepatotoxicity of Nitroaromatic Drugs. Curr. Drug Metab 2006, 7, 715–727. [DOI] [PubMed] [Google Scholar]
- (81).Kedderis GL; Miwa GT The Metabolic Activation of Nitroheterocyclic Therapeutic Agents. Drug Metab. Rev 1988, 19, 33–62. [DOI] [PubMed] [Google Scholar]
- (82).Uetrecht J N-Oxidation of Drugs Associated With Idiosyncratic Drug Reactions. Drug Metab. Rev 2002, 34, 651–665. [DOI] [PubMed] [Google Scholar]
- (83).Dalvie DK; Kalgutkar AS; Khojasteh-Bakht SC; Obach RS; O’Donnell JP Biotransformation Reactions of Five-Membered Aromatic Heterocyclic Rings. Chem. Res. Toxicol 2002, 15, 269–299. [DOI] [PubMed] [Google Scholar]
- (84).Bakker J; Gommers F; Nieuwenhuis I; Wynberg H Photoactivation of the Nematicidal Compound Alpha-Terthienyl From Roots of Marigolds (Tagetes Species). A Possible Singlet Oxygen Role. J. Biol. Chem 1979, 254, 1841–1844. [PubMed] [Google Scholar]
- (85).Iyengar S; Arnason J; Philogene B; Morand P; Werstiuk N; Timmins G Toxicokinetics of the Phototoxic Allelochemical α-Terthienyl in Three Herbivorous Lepidoptera. Pestic. Biochem. Physiol 1987, 29, 1–9. [Google Scholar]
- (86).Matsuura H; Saxena G; Farmer S; Hancock R; Towers G Antibacterial and Antifungal Polyine Compounds From Glehnia Littoralis Ssp. Planta Med. 1996, 62, 256–259. [DOI] [PubMed] [Google Scholar]
- (87).Chan G; Towers GN; Mitchell J Ultraviolet-Mediated Antibiotic Activity of Thiophene Compounds of Tagetes. Phytochemistry 1975, 14, 2295–2296. [Google Scholar]
- (88).Hudson J; Graham E; Miki N; Towers G; Hudson L; Rossi R; Carpita A; Neri D Photoactive Antiviral and Cytotoxic Activities of Synthetic Thiophenes and Their Acetylenic Derivatives. Chemosphere 1989, 19, 1329–1343. [Google Scholar]
- (89).Malmström J; Jonsson M; Cotgreave IA; Hammarström L; Sjödin M; Engman L The Antioxidant Profile of 2, 3-Dihydrobenzo [B] Furan-5-Ol and Its 1-Thio, 1-Seleno, and 1-Telluro Analogues. J. Am. Chem. Soc 2001, 123, 3434–3440. [DOI] [PubMed] [Google Scholar]
- (90).O’Donnell JP; Dalvie DK; Kalgutkar AS; Obach RS Mechanism-Based Inactivation of Human Recombinant P450 2C9 by the Nonsteroidal Anti-Inflammatory Drug Suprofen. Drug Metab. Dispos 2003, 31, 1369–1377. [DOI] [PubMed] [Google Scholar]
- (91).Gramec D; Peterlin Mašič L; Sollner Dolenc M Bioactivation Potential of Thiophene-Containing Drugs. Chem. Res. Toxicol 2014, 27, 1344–1358. [DOI] [PubMed] [Google Scholar]
- (92).Uetrecht J; Naisbitt DJ Idiosyncratic Adverse Drug Reactions: Current Concepts. Pharmacol. Rev 2013, 65, 779–808. [DOI] [PMC free article] [PubMed] [Google Scholar]
- (93).Daly AK Using Genome-Wide Association Studies to Identify Genes Important in Serious Adverse Drug Reactions. Annu. Rev. Pharmacol. Toxicol 2012, 52, 21–35. [DOI] [PubMed] [Google Scholar]
- (94).Bugelski PJ Genetic Aspects of Immune-Mediated Adverse Drug Effects. Nat. Rev. Drug Discovery 2005, 4, 59–69. [DOI] [PubMed] [Google Scholar]
Associated Data
This section collects any data citations, data availability statements, or supplementary materials included in this article.