

Abstract
Current tailored-therapy efforts in cancer are largely focused on a small number of highly recurrently mutated driver genes but therapeutic targeting of these oncogenes remains challenging. However, the vast number of genes mutated infrequently across cancers has received less attention, in part, due to a lack of understanding of their biological significance. We present SYSMut, an extendable systems biology platform that can robustly infer the biologic consequences of somatic mutations by integrating routine multiomics profiles in primary tumors. We establish SYSMut’s improved performance vis-à-vis state-of-the-art driver gene identification methodologies by recapitulating the functional impact of known driver genes, while additionally identifying novel functionally impactful mutated genes across 29 cancers. Subsequent application of SYSMut on low-frequency gene mutations in head and neck squamous cell (HNSC) cancers, followed by molecular and pharmacogenetic validation, revealed the lipidogenic network as a novel therapeutic vulnerability in aggressive HNSC cancers. SYSMut is thus a robust scalable framework that enables the discovery of new targetable avenues in cancer.
Keywords: drug sensitivity, functional genomics, glucocorticoid receptor, lipid metabolism, multiomics integrative analysis
Introduction
Large-scale profiling studies of multiple cancers have revealed a substantial number of molecular aberrations that accumulate across epigenomic, genomic and transcriptional scales [1, 2]. The resulting molecular heterogeneity across cancer lesions within the same tissue type reflects the multiple ways in which signaling networks can be pathologically altered. Of the plethora of somatic mutations typically observed in a given cancer sample, only a minority are expected to functionally contribute to cancer etiology and/or aggressiveness [2, 3]. While current targeted therapeutic strategies have focused on a small set of known oncogenes [4, 5], the inherent molecular heterogeneity of cancers often results in either intrinsic or rapidly acquired resistance to treatment [6–8]. This molecular heterogeneity poses a significant biological and clinical challenge and has motivated the computational discovery of additional functionally significant mutations that might present therapeutic vulnerabilities in cancer.
Several computational approaches have been developed to analyze cancer mutational profiles to identify and prioritize driver genes and/or pathways [9]. While gene-level [2, 10–13] and network-level [14–17] frequentist approaches have been able to identify the most recurrently mutated (Mut) genes and pathways associated with cancer initiation and development, they tend to be less reliable in identifying functionally significant genes that fall within the long tail of rarely Mut genes in cancer owing to the sheer diversity of genetic and epigenetic changes in tumors and the significant heterogeneity between and within tumor samples. As such, computational approaches that integrate genomic, transcriptomic and epigenetic data with gene regulatory networks have been developed to provide insight into the impact of somatic mutations on biological pathways [18–24]. While state-of-the-art computational approaches have identified a relatively small number of significantly Mut cancer driver genes [24], the functional significance of the vast majority of genes that are Mut at low frequencies (<5%) remains largely unknown (Figure 1A). We also note that this particular challenge is compounded because existing integrative approaches do not explicitly account for the influence of co-occurring cis−/trans-regulatory factors that could confound the estimates of a given mutation’s downstream transcriptional impact.
Figure 1.

Fraction of known drivers among recurrently Mut genes, and overview of SYSMut algorithmic framework. (A) Somatic mutations across 30 types of solid tumors were obtained from the Pan-Cancer Atlas dataset, comprising ~10 K tumor samples. Stacked bar plot showing the fraction of the previously known driver genes to the unknown Mut genes, where the Y-axis indicating the cancer types, and the X-axis denotes the number of Mut genes in each cancer. Cancer types are sorted from top to bottom based on total number of Mut genes. Recurrent Mut genes (mutation rates > %0.5 on the right) depicted a higher fraction of known driver genes, while only a very small fraction of rarely Mut genes (mutation rates <0.5% on the left) are known yet. (B) Module 1: For each Mut Gene (G0), this module identifies its transcriptional TG by traversing a predefined transcriptional influence network. Additionally, this module prepares multiomics profiles of tumor samples for downstream analysis, including mutation status of the GI, gene expression levels of all genes in the network, along with DNAMeth and sCNA of all target genes. (C) Module 2: This module employs a hierarchical Bayesian regression framework that integrates multiomics tumor profiles to estimate the relative influence of each GI on the expression levels of a specific transcriptional TG in both Mut and non-Mut tumor samples, while also accounting for cis-regulatory influences of other confounder genes (PG), and trans-regulatory influences on the TG expression. (D) Module 3: This module uses the output of the Bayesian regression framework to determine the statistical significance of differences in the regulatory influence of the GI on the expression levels of a specific TG in the Mut and non-Mut contexts, thus enabling quantification of the transcriptional impact of mutations in GI on the expression levels of TG. (E) Module 4: Predicts probabilities of the mutational impact of each GI by summarizing the impact of GI across all downstream TGs.
Recognizing the multifactorial molecular deregulations emblematic of cancer tissues, we present a SYStems biology framework for the identification and prioritization of Mutations (SYSMut) with significant functional impact. SYSMut integrates tumor mutational profiles with DNA copy number, DNA methylation (DNAMeth) and transcriptomic data to reliably decode the downstream transcriptional impact of rare somatic mutations. We note that not all mutations might result in a detectable transcriptional impact, while nonetheless impacting other post-translational molecular processes that are not captured routinely in high-throughput molecular profiling strategies. However, our motivation is to develop a framework that can rely on currently available genome-scale molecular profiling approaches that capture the multiscale molecular complexity of cancer to decode the functional impact of mutational events while explicitly accounting for co-occurring cis−/trans-regulatory molecular aberrations in each tumor sample. We first motivate the theoretical development of the SYSMut algorithm based on a hierarchical Bayesian regression framework, followed by establishing the robustness of SYSMut through computational benchmarking on simulated data that closely mimics actual PanCancer molecular profiling data. We then showcase SYSMut’s improved performance as compared to state-of-the-art integrative approaches by analyzing multiomics data derived from the cancer genome atlas (TCGA) PanCancer dataset [25], containing over 8000 tumor samples spanning 29 solid tumor types. SYSMut identified both well-known driver genes as well as rare mutational events that modulate key downstream transcriptional programs that were orthogonally validated using functional genomics assessments in cell line models. Finally, we highlight the translational utility of the SYSMut framework by identifying a subnetwork of rarely Mut genes involved in lipid metabolism that are associated with poorer clinical outcomes in head and neck squamous cell (HNSC) cancers and differential sensitivity to drugs targeting the lipid metabolism pathway.
Methods
SYSMut is designed to decode the impact of somatic mutations in a given gene on its downstream transcriptional target genes (TG) after accounting for likely confounding cis- and trans-regulatory factors that influence the expression of these TG. Accordingly, SYSMut is structured as a framework of interoperating modules that systematically integrate genome-scale multiomics profiles of cancer tissues with gene regulatory interaction data to identify Mut genes that significantly impact downstream transcriptional programs (Figure 1B–E; Supplementary Materials and Methods).
Module 1: Integrating gene regulatory roadmaps with multiomics measurements
We first build a genome-scale transcriptional influence network that captures the regulatory roadmaps underlying gene transcription by integrating signaling networks and transcription factor network information from multiple publicly available databases (Supplementary Materials and Methods; Supplementary Table S1). The directed transcriptional influence network of SYSMut was derived using highly curated signaling networks and publicly available transcription factor target gene information and includes direct transcriptional targets, in addition, to close indirect transcriptional regulation via complex formation, abstracts, families and/or a single post-translational modification event, resulting in a total of 120,655 transcriptional influences spanning 18 651 unique nodes (Figure S1 and Table S1). Next, for each Mut gene, which henceforth is denoted as a gene-of-interest (GI), Module 1 (Figure 1B) traverses the previously defined directed transcriptional influence network to identify all of the downstream transcriptional TG potentially impacted by GI, while also capturing all of the known trans-regulators of each of the TGs denoted henceforth as parent genes (PG) (Figure S1). In addition, Module 1 also incorporates known cis-regulatory influences, including DNAMeth and somatic copy-number alterations (sCNA) overlapping the gene’s coding and/or promoter regions. Module 1 then independently processes and normalizes each of the multiomics data streams of RNA sequencing (RNASeq), DNAMeth and sCNA along with genome-scale somatic mutation calls to enable downstream integrative analyses.
Module 2: Hierarchical Bayesian regression model
SYSMut Module 2 (Figure 1C) learns multiple hierarchical regression functions that model the expression levels of the set of transcriptional TG by accounting for both their cis-regulatory factors (i.e. DNAMeth and sCNA status) as well as their trans-regulatory factors (i.e. gene expression levels of all upstream regulators including the Mut GI). SYSMut model deploys cancer samples that harbor nonsynonymous mutations (Mut) (Supplementary Materials and Methods) in a GI with samples that are wild type (Wt) for that GI and all its connected genes including TGs and other trans-regulators (PGs) to learn a hierarchical Bayesian regression function Equation (1) that models the expression level of the GI-associated TGs using as input both the trans-regulators (mRNA expression of GI and other trans-regulators, PG), as well as cis-regulators (sCNA and DNAMeth) of each TG:
 |
(1) |
 .
.
 denotes the gene expression levels of the transcriptional TG, and
  corresponds to the Wt and Mut clusters. For the sake of simplicity, the Mut cluster consists of samples harboring nonsynonymous mutations in the corresponding GI, but in a general case,
  denotes a vector of
  clusters that can include a variety of mutation categories, such as Wt, synonymous, missense, nonsense and frame-shift mutations.
 denotes the expression level of a
 denotes expression levels of the other upstream trans-regulator genes
  of
of  except GI.
 , and
, and  denote
  and DNAMeth data of the
  , and
, and  denotes a set of cluster-specific parameter
  of cluster i of the
  . These parameters represent mutation effect
  on each TG. For the case of two clusters, namely Wt versus Mut,
  denotes posterior averages of the Wt and Mut cluster of the
 denotes a vector of the estimated parameters of the other upstream trans-regulator genes
  of
of  except GI.
 and
and  denote the estimated parameters for sCNA and DNAMeth data of each
  , respectively, and
  , is the vector of cluster-specific intercepts.
The objective is to estimate the optimal intracluster parameter,  , and intercluster parameters
  ,
, ,
,  and provide the best prediction power via minimizing the mean-squared error between the predicted and observed expression levels of the TG. Of note, the parameter inference is marginalized over the cluster-specific parameter,
  (Supplementary Materials and Methods).
Module 3: Quantification of mutation impact per TG
To determine the modulatory role of Mut GI on the expression of the downstream TGs, the earlier discussed regression model is applied to n1 Wt and n2 Mut samples (Figure 1D, Supplementary Figure S2A). SYSMut provides a functioning bank, where each function corresponds to a specific TG and this function bank represents all cis/trans-regulatory alterations. In fact, the prediction process provides the conditional posterior distribution for the expression level of the TG. The maximum a-posteriori (MAP) method is used to obtain the expected gene expression levels and parameter values.
As depicted in Figure S3A and B, the hierarchical Bayesian regression model estimates intercluster parameters  ,
,  ,
,  and intracluster parameters
  , where the difference between the posterior distribution of the cluster-specific parameter
  represents the impact of GI to the specific TG. The Bhattacharyya distance
  between the two posterior distributions
  and
and  represents the impact of mutations in GI on its regulatory influence on the downstream TG, with higher
  corresponding to larger impact (Figure S2C).
Given that the parameter estimates and the resulting Bhattacharyya distance,  . may be sensitive to measurement noise and other technical artifacts related to the molecular profiling platforms employed in a given cohort of samples, SYSMut next defines a null distribution of D, as a control, using the samples that do not harbor any mutations in GI. Specifically, as shown in Figure S2B, SYSMut identifies tumor samples that are Wt for GI as well as all TGs of the Mut GI and their related PG. These ‘clean Wt’ samples are then randomly split into two subclusters whose relative sizes are proportional to the sizes of the number of Wt and Mut samples employed during the estimation of
  . SYSMut, then repeats the estimation of cluster-specific parameters
  thus calculating the Bhattacharyya distance corresponding to a no-impact scenario. This process is then repeated for K-multiple random splits of the Wt samples thus generating a null distribution of Bhattacharyya distances
  . SYSMut then assesses whether
  is significantly greater than
  (Figure 1D, and Figure S2B and C) thus determining the statistical significance of the transcriptional impact of the Mut GI on the specific
Module 4: Network-based summarization of mutational impact of GI
To determine the level of mutational impact of a GI on each of its downstream TGs, SYSMut, Module 4 (Figure 1E), next assesses the statistical significance of transcriptional impact using a network randomization strategy. After assessing the log-likelihood of impact status for each transcriptional TG of a Mut GI, SYSMut then replaces the target gene and its upstream trans-regulatory network with a random TG and its associated trans-regulatory network. SYSMut then assesses the log-likelihood of impact status for a total N independent random trials of the replaced TGs, aiming to generate a null distribution of impact. The statistical difference in a TG’s log-likelihood of impact and the null distribution of log-likelihoods of random TGs indicates the impact score, corresponding to the mutation impact level of a GI to its downstream TG.
Additionally, to determine the overall impact of mutations in a GI, SYSMut, Module 4 (Figure 1E), summarizes the mutational impact of the GI across all its TGs by estimating the fraction of TGs whose transcriptional patterns were significantly impacted by mutations in GI. SYSMut additionally generates a null distribution of the fraction of random TGs impacted by mutations in a given GI. However, GIs whose observed fraction of target genes impacted were significantly (P < 0.05) higher than the null distribution were deemed to be functionally significant (Figure S3). The GI-level impact score, which is the average of GI to TGs impact scores, is used to rank the Mut genes, where higher scores correspond to higher mutational impact.
Results
Computational benchmarking of SYSMut
To assess the effectiveness of SYSMut in identifying mutations with significant functional impact, we performed extensive computational benchmarking experiments using simulated data. Accordingly, we applied SYSMut on a large set of simulated mutation, gene expression, sCNA and DNAMeth data generated using the model described in Equation (1) and designed to mimic real-world multiomic profiles of cancer. Taken together, we performed simulation-based benchmarking of SYSMut’s performance to detect the low-, medium- or high impact of mutations in GI on downstream transcriptional TG expression. The simulation studies were designed to evaluate SYSMut performance across a variety of conditions, including the number of samples (100, 300, 500 and 700) available for training the model, mutation rates of GI (0.5%, 1%, 2% and 5%) and a number of trans-regulators of TG (5, 10, 50, 100) that could confound the impact mutation assessment. The AUC curves related to the aforementioned simulation experiments (Figure 2A–C), confirm the model’s ability to identify rare mutations with significant downstream impact even when the sample size is low (N = 100), the mutation rate of the GI is low (<1%) and the number of potential trans-regulatory confounders for a given TG is high (>100). Importantly, these simulation studies also reveal the importance of SYSMut’s approach to explicitly account for cis−/trans-regulatory factors that modulate TG expression levels, thus ensuring robust detection of the downstream transcriptional impact of mutations in GI (Figure 2C). Our simulation studies, therefore, reveal a key advantage of SYSMut as compared to algorithms such as Xseq [20] whose estimates are liable to be confounded by such cis−/trans-regulatory factors.
Figure 2.

Computational benchmarking of SYSMut using simulation and PanCancer datasets. (A–C) Simulation-based benchmarking of the performance of SYSMut in detecting low-, medium- and high-mutational impacts of the GI across conditions, including (a) Number of samples available for training the model; (b) mutation rates and (c) number of trans-regulatory confounders. Note the significant performance degradation in mutational impact detection when the trans-regulatory confounders are not considered in the model (dashed line). (D) Example of SYSMut-based quantification of the functional impact of Mut genes in HNSC. The scatter plot denotes the fraction of impacted target genes associated with each indicated GI (Y-axis), plotted against the GI’s mutation rate (X-axis). The horizontal dashed line denotes the threshold of statistical significance (P < 0.05). Shown in purple are Mut genes with significant functional impact identified by SYSMut, with red nodes denoting previously identified driver genes in HNSC. (E) The spider plot indicates the percentage of previously identified driver genes within each of the 29 cancer types whose impact was recapitulated by SYSMut, Hit’nDrive, Xseq and Moonlight. Cancers where SYSMut detected impact in <75% of the previously identified driver genes were due to either low sample size ( ) or very low number of driver genes (
 ). (F) Bar graph indicates the mean ± SD of the fraction of PanSoftware driver genes detected by each of the algorithms (SYSMut, Hit’nDrive, Xseq and Moonlight) across cancer types. (G) Bar graph indicates the mean ± SD of the number of genes identified as significant by each of the algorithms across cancer types. (H) Bar graphs (left) denote the percentage of Mut genes with significant transcriptional impact identified by SYSMut across cancers. Also shown in right, are the distributions of mutation rates of genes whose mutations were identified by SYSMut as exhibiting significant downstream impact.
Application of SYSMut to interrogate mutational significance in a PanCancer cohort of solid tumors
Given the success of the earlier discussed simulation studies, we next assessed for SYSMut’s ability to detect the downstream transcriptional impact of mutations in the challenging setting of multiomics molecular profiling data derived from admixed primary tumor tissues. Accordingly, we applied SYSMut to analyze multiomics molecular profiles obtained from the PanCancer Atlas project [26], which included a total of ~8000 solid tumor samples spanning 29 distinct cancer types (Table S2). We first selected high-confidence somatic mutations per tumor sample identified using paired analysis of tumor and matched-normal whole-exome sequencing data (Supplementary Materials and Methods). We then employed SYSMut to integrate somatic mutation calls with sCNA, DNAMeth and RNASeq profiles per tumor sample, thus estimating the impact of a GI on its downstream TGs (as an example, Table S3), and the fraction of target genes whose expression levels were significantly impacted by mutations in their respective GIs within each of 29 cancer types (Figure S4). As a control, we performed SYSMut-based impact assessments of mutations in each GI on a set of random TGs with similar numbers of trans-regulatory confounders (Supplementary Figure S3D and E), thus generating a null distribution of the fraction of TGs impacted by mutations in a given GI. Mutations in GIs that resulted in significantly (P < 0.05) higher fractions of impacted TGs as compared to the null distribution were deemed to be functionally significant (Figure S3F), thus resulting in the identification of functionally significant Mut GIs in each of the 29 distinct cancer types within the PanCancer dataset, thus detecting the impact of mutations in tumor suppressor genes such as TP53, as well as gain-of-function mutations in oncogenes such as KRAS (Figure 2D and Figure S4). Strikingly, SYSMut was able to successfully classify as functionally significant nearly all of the predicted cancer driver genes previously identified by integrating 26 distinct computational approaches applied to the PanCancer cohort (Figure 2E) [24]. Indeed, SYSMut’s sensitivity in identifying previously discovered cancer driver genes far exceeded state-of-the-art methods, such as Hit’nDrive [27], Moonlight [23] and Xseq [20], across cancers (Figure 2E and F, Table S4; Supplementary Materials and Methods). The few instances where SYSMut did not detect the significant functional impact of a previously predicted driver gene were either due to insufficient sample size or the lack of sufficient information regarding downstream transcriptional targets based on the current transcriptional influence network (Figure 2E). Importantly, this increased sensitivity (Figure 2E and F) was achieved despite SYSMut classifying a lower number of Mut genes as being functionally significant as compared to the other methodologies (Figure 2G). In fact, SYSMut identified an average of 7% of the Mut genes with a variety of mutation rates as functionally significant (Figure 2H and Table S5).
We next evaluated whether the Mut genes (GIs) that were deemed by SYSMut as functionally clustered within specific molecular subnetworks. We clustered GIs based on overlaps in their target gene identities, with GIs sharing ~70 – 100% of their target genes in the transcriptional influence network being clustered together (Table S6; Supplementary Materials and Methods). The resulting clusters were then ranked based on the number of cancer types in which their respective GIs were deemed by SYSMut to harbor functionally significant mutations (Figure 3A). As expected, the top-ranked clusters included GIs related to pathways and cellular processes known to be deregulated in cancer, including cell cycle, DNA repair, TP53, transforming growth factor-β -β and nuclear factor-kappa B (Figure 3A).
Figure 3.

SYSMut-based discovery of gene subnetworks harboring mutations with significant functional impact across cancers. (A) Violin plots denote the joint-mutation rate (Y-axis) of subnetworks of genes identified by SYSMut as harboring mutations with significant downstream transcriptional impact across cancer types. Bar graphs in dark red (top) denote the number of cancer types where SYSMut identified mutations in the subnetwork as exhibiting significant impact on downstream transcriptional programs. Note that SYSMut identified the lipid metabolism subnetwork as exhibiting significant mutational impact across the most number of cancer types. (B) Lipid metabolism gene subnetwork detailing the convergent transcriptional impact of mutations in GIs (green hexagons) across cancer types in the PanCancer dataset. The size of the TG nodes (circles) corresponds to the number of cancer types where the TG was deemed as being impacted by mutation in the GIs. Red TG nodes (circles) are transcriptional targets uniquely impacted by GIs within this subnetwork, whereas pink TG nodes are also impacted by other previously identified cancer driver genes. Directionality of the connection is indicated by arrows and the thickness of the arrows indicates the number of cancers where SYSMut identified a mutational impact of GI on the TG. The color of the arrow corresponds to the number of cancer types where SYSMut detected an impact of mutations in GI on the corresponding TG (black, corresponds to ≥4 cancer types, whereas light gray corresponds to <4 cancer types). (C) Lolli plot showing somatic mutations in the PanCancer dataset across the length of the amino-acid sequences for each of the GIs in the lipid metabolism network. Note the broad distribution of mutations throughout the length of the amino-acid sequences for each of the GIs in this network, a pattern suggestive of loss of function as opposed to activating mutations. (D) Horizontal bar plots indicating the impact of mutations on a transcriptional readout of lipid metabolism in the Cancer Cell Line Encyclopedia. Gray bars (left) indicate average lipid metabolism index across all cell lines in the cancer type or lineage. Bars on the right detail increased (blue) or decreased (red) lipid metabolism in cell lines harboring mutations in the lipid metabolism network as compared to non-Mut cell lines within each lineage. Stars indicate lineages where SYSMut detected significant transcriptional impact of mutations in the lipid metabolism network in cancers exhibiting at least 5% subnetwork mutation rate within the PanCancer dataset. ESCC, esophageal squamous cell carcinoma; LUAD Ade, NSCLC adenocarcinoma; LUAD Seq, NSCLC squamous; CSCC, cervical squamous cell carcinoma; BLCA, urothelial bladder carcinoma.
Interestingly, the cluster that exhibited significant impact across the highest number of distinct cancer types (Figure 3A) included TGS1, NCOA6, CHD9, MED1, HELZ2, TBL1XR1 and TBL1X1. Strikingly, >89% of the GIs in this cluster and their associated TGs belong to the lipid metabolism pathway [28] (Supplementary Table S7). We additionally evaluated mutations in these lipid metabolism genes using BoostDM [29], a method designed to identify specific driver mutations along the length of Mut genes. Interestingly, BoostDM identified specific mutations in two lipid metabolism genes (i.e. CHD9 and TBL1XR1), as likely drivers in specific cancer types that were also identified by SYSMut (BLCA, CESC, HNSC, ESCA and LIHC) (Supplementary Table S8), thus providing orthogonal support for SYSMut’s identification of mutations in these genes as likely functionally significant. For the other cancers including BRCA, KIRC, LUAD, LUSC, OV, READ, SKCM and STAD where BoostDM identified CHD9 and TBL1XR1 as driver genes, SYSMut was able to identify at least one of the five other genes TGS1, NCOA6, MED1, HELZ2 and TBL1X1 within the lipid metabolism network as harboring mutations with significant transcriptional impact (Supplementary Table S5).
SYSMut also identified multiple TGs to be significantly impacted by more than one Mut GI within the lipid metabolism cluster (Figure 3B), thus revealing how diverse mutational events can converge on a single cellular process. Importantly, none of these genes was identified as functionally significant by either the pan-software [24] or any of the other state-of-the-art methods that SYSMut was benchmarked against (Table S4). Next, to evaluate whether the nonsynonymous somatic mutations in each of the Mut genes within the lipid metabolism cluster were likely to be activating or inactivating events, we assessed for potential mutational hotspots along the length of the respective proteins within the PanCancer TCGA dataset. However, we found somatic mutations to be broadly distributed along the length of each of the proteins within the lipid metabolism network with no evidence of mutational hotspots (Figure 3C), thus suggesting that somatic mutations in these genes are more likely to be associated with loss of function as opposed to activating events. Consistent with this, an assessment of a predefined gene expression-based signature of lipid metabolic activity [28] in the CCLE dataset [30] revealed that cancer cell lines were more likely to exhibit decreased lipid metabolic activity when they harbored mutations in the lipid metabolism network (Figure 3D; Supplementary Materials and Methods).
Mutations in lipid metabolism network are associated with poorer outcomes in HNSC carcinoma
Given that SYSMut identified nonsynonymous somatic mutations in genes belonging to the lipid metabolism pathway as significantly impacting their downstream transcriptional targets across specific cancer types within the PanCancer TCGA dataset (Figure 3A), we proceeded to assess whether mutations in this pathway were associated with differential clinical outcomes in these specific cancer types (Figure S5). We observed a significant association between mutations in the lipid metabolism network and poorer disease-specific survival (DSS) only in HNSC but not in any of the other cancer types (P = 0.028; Figure 4A, Supplementary Figure S5). Given that human papillomavirus (HPV)-positivity is a known prognostic factor in HNSC [31, 32], we performed a subset analysis and found mutations in the lipid metabolism network to be significantly associated with poorer DSS even in HPV-negative HNSC (P = 0.0036, Figure 4B). Furthermore, the mutation rates of previously identified HNSC driver genes [24] were similar between HNSCs mutant or Wt for the lipid metabolism network (Figure S6). Strikingly, mutations in the lipid metabolism network were associated with poorer DSS in HPV-negative HNSC even after adjusting for clinical-pathological variables, such as stage and age (P = 0.0069, Figure 4B), as well as mutations in known HNSC driver genes (P = 0.0123) [24]. These findings, taken together with SYSMut’s assessment of the significant impact of mutations in the lipid metabolism network on downstream transcriptional targets (Figure 4B), suggest that genomic alterations targeting the lipid metabolism pathway are a functionally significant molecular mechanism in HNSC. We also note that lower lipid metabolism has been previously highlighted to be associated with poor prognosis in a subset of cancer types through a pan-cancer assessment of metabolic expression subtypes. While we found mutations in the lipid metabolism network associated with poorer outcomes in HNSC (Figure 4A), we also note that mutations are not the only way by which lipid metabolic activity may be modulated in cancers. A broader exploration of genomic, epigenetic, transcriptional and post-translational regulation of lipid metabolism is warranted in future studies to fully explore the role of lipid metabolism in modulating clinical outcomes across cancers.
Figure 4.

Impact of mutations in the lipid metabolism network in HNSC. (A and B) DSS in HNSC patients (A) or HPV-negative HNSC patients (B). Shown are Kaplan–Meier estimates of DSS for patients with tumors where one or more GIs in the lipid metabolism subnetwork are Mut (orange), as compared to their non-Mut (blue) counterparts. The statistical significance of differences in survival rates between Mut and non-Mut categories was determined using the LogRank test (LogRank P); also shown is the statistical significance estimated using the Wald test in a multivariable Cox regression model incorporating cancer stage and age (Adj. Cox P). (C) Lipid metabolism network detailing the convergent transcriptional impact of Mut GIs (green hexagon) in HNSC as identified by SYSMut. Red TG nodes are transcriptional targets uniquely impacted by GIs (green hexagons) in this subnetwork, whereas pink TG nodes are also impacted by other previously identified driver genes in HNSC. (D–G) SYSMut-based evaluation of the transcriptional impact of siRNA-based knockdown of MED1 and NCOA6 on their respective downstream target genes in distinct HNSC cell lines (BICR22 and CAL26). Shown are the distributions (magenta) of Bhattacharyya distances representing SYSMut’s assessments of the differential regulation of the downstream transcriptional targets of MED1/NCOA6 in HNSC cell lines treated with either siRNA targeting MED1 (siMED1) or NCOA6 (siNCOA6) as compared to nontargeting control (siSCRAM). Also shown, as an internal control, are the distributions of Bhattacharyya distances (light blue) representing SYSMut’s assessment of impact of random untargeted GIs on their respective TGs. (H and I) Depict the impact of MED1 and NCOA6 knockdown on target genes previously identified by SYSMut as being impacted by MED1/NCOA6 mutations in HNSC primary tumors (as shown in panel C). Individual stems denote the Bhattacharyya distance (Y-axis) corresponding to SYSMut’s assessment of the differential regulation of individual target genes (X-axis) upon MED1/NCOA6 knockdown in BICR22 (dark cyan) and CAL27 (yellow) HNSC cell lines. The box plots depict the distribution of Bhattacharya distances of randomly selected GIs on their respective TGs, thus serving as an internal control within each cell line model. TGs that are not expressed in a given cell line are denoted as NE.
The top two frequently Mut lipid metabolism-associated genes (MED1 and NCOA6) in HNSC did not exhibit any evidence of mutational hotspots (Figure S7), similar to our findings in the PanCancer context (Figure 3C), thus suggesting that nonsynonymous mutations in these genes are more likely to be inactivating events. We, therefore, performed siRNA-based knockdown of MED1 and NCOA6 in two distinct HNSC cell lines (BICR22 and CAL27) that do not harbor somatic mutations in the lipid metabolism network, to functionally test the impact of inactivation of these genes on downstream transcriptional targets. While we recognize that siRNA-based knockdown of the gene prevents us from modeling the impact of specific point mutations on protein function, we chose this as a conceptually reasonable strategy to assess the performance of the core methodology of SYSMut by focusing on the broader impact of gene disruption. Accordingly, we employed SYSMut to analyze the knockdown (siMED1 or siNCOA6) versus control (siSCRAM) RNASeq profiles in each cell line, followed by an assessment of the transcriptional impact on the transcriptional targets of the respective genes (Supplementary Materials and Methods). SYSMut revealed significant alterations in the regulatory influence of MED1 or NCOA6 on their respective TGs upon siRNA-based knockdown, as evidenced by significantly higher Bhattacharyya distances of their respective TGs as compared to the Bhattacharyya distances of TGs of random untargeted genes in both BICR22 and CAL27 cell line models (Figure 4D–G). SYSMut was indeed able to successfully recapitulate the previously detected mutational impacts of MED1 or NCOA6 on their respective TGs (Figure 4C) using the siRNA-based assessments in BICR22 or CAL27 cell lines (Figure 4H and I). These functional assessments in distinct HNSC cell line models provide strong support for SYSMut’s robustness in detecting the downstream transcriptional impact of mutations in genes even in molecular profiles derived from admixed primary tumor tissue samples.
HNSC cells harboring mutations in lipid metabolism network exhibit differential sensitivity to glucocorticoid receptor agonists
Given that SYSMut identified mutations in the lipid metabolism network as impacting downstream transcriptional programs and survival in HNSC, we evaluated whether mutations in this network were associated with decreased lipid metabolism in HNSC cell lines. Indeed, we found that mutations in genes belonging to the lipid metabolism network in HNSC cell lines were associated with significantly lower lipid metabolic activity (Figure 5A), a finding consistent with our position-based mutation assessments in primary tissues that also supported a likely inactivating function of mutations in these genes (Figure S7).
Figure 5.
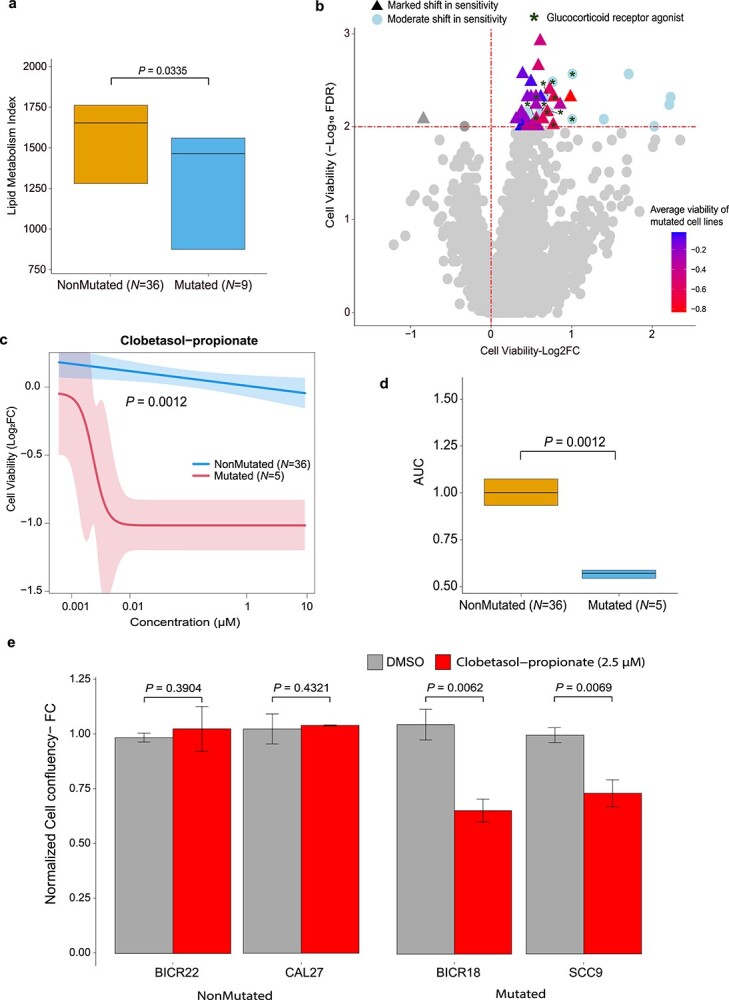
Differential drug sensitivity of HNSC cell lines harboring mutations in the lipid metabolism network as compared to their non-Mut counterparts. (A) Box plots detailing lipid metabolic activity in HNSC cell lines harboring mutations in the lipid metabolism network (Mut, N = 9) as compared to their non-Mut, (N = 36) counterparts. Statistical significance of differences in lipid metabolic activity was estimated using a Wilcoxon signed rank test. (B) Volcano plot depicting significant differential sensitivity between Mut and non-Mut HNSC cell lines across drugs in the PRISM primary screen. X-axis denotes the difference (log2fold-change) in average cell viability between Mut and non-Mut HNSC cell lines upon drug treatment, whereas the Y-axis denotes the statistical significance (−log10FDR) of the difference assessed using a Wilcoxon test. Points above the horizontal red-dashed line denote drugs inducing a significant shift (log10FDR < 0.01) in average cell viability between Mut and non-Mut HNSC cell lines. Drugs were additionally denoted as exhibiting marked (triangles) shift in sensitivity if the Mut cells exhibited, on average, lower cell viability on drug treatment as compared to DMSO control (indicated by negative log2 cell viability in the PRISM primary screen) while the non-Mut cells were nonresponsive (indicated by positive log2 cell viability values in the PRISM primary screen). GRA are highlighted with dark green stars. (C) Average clobetasol-proprionate dose–response curves for Mut and non-Mut (blue) HNSC cell lines derived from the PRISM secondary screen dataset. Y-axis denotes the difference in cell viability (Log2fold change) upon treatment with different doses (X-axis) of clobetasol-proprionate as compared to DMSO control. (D) Box plots detailing the comparison of area under the curve (AUC) estimates for clobetasol−propionate dose–response curves in Mut versus non-Mut HNSC cell lines obtained from the PRISM secondary screen dataset. Statistical significance was assessed using a Wilcoxon test. (E) IncuCyte-based cell growth assessments in Mut (SCC9, BICR18) and non-Mut (BICR22, CAL27) HNSC cells treated with clobetasol−propionate (2.5 μM) as compared to DMSO control treatment. Y-axis represents the average fold change in cell confluence values at the final time point (120 h for SCC9; 96 h for BICR22, CAL27 and BICR18) normalized to DMSO control, plotted as mean ± SD, obtained from at least three replicate experiments. The statistical significance of differences in normalized cell confluency between the respective test versus control groups were estimated using a Student t-test assuming unequal variances.
We next proceeded to orthogonally assess the functional significance of mutations in these genes by analyzing drug efficacy data published as part of the PRISM drug repurposing resource within the DepMap portal [33] (Supplementary Materials and Methods). Specifically, we ranked drugs in the PRISM primary screen based on whether HNSC cells harboring mutations in lipid metabolism exhibited significant differential sensitivity to the drug as compared to non-Mut HNSC counterparts. Interestingly, the top-ranked drugs within the PRISM primary screen that exhibited differential sensitivity between Mut versus non-Mut HNSC cell lines were significantly enriched for glucocorticoid receptor agonists (GRA) (P < 1.5 x 10⁻¹³; Figure 5B and Table S9). Indeed, HNSC cell lines harboring mutations in the lipid metabolism network were more likely to exhibit markedly higher sensitivity to GRA as compared to their non-Mut counterparts (Figure 5B). Given that the primary PRISM screen employed a single-drug concentration (2.5 μM) across all drugs, we analyzed the PRISM secondary screen dataset within DepMap that assesses cell viability for a subset of drugs (N = 1448) and cell lines across doses ranging from 0.0006 μM to 10 μM. Here too, we found clobetasol-propionate, a GRA, as exhibiting the strongest differential sensitivity between Mut and non-Mut HNSC cell lines (P = 0.0013; Figure 5C and D and Table S10). Given the known role of the glucocorticoid receptor in regulating cellular lipid metabolism [34–36], we performed an in-house validation study to test whether clobetasol-propionate differentially impacts the growth (Supplementary Materials and Methods) of distinct HNSC cell lines that are either Mut (BICR18, SCC9) or non-Mut (BICR22, CAL27). Of note, neither of the Mut cell lines was included in the secondary PRISM screens, thus enabling us to additionally test for the generality of our initial findings. Strikingly, and consistent with our findings in the PRISM drug screen, we observed that the Mut HNSC cell lines exhibited a significant reduction in cell growth as compared to DMSO control, while the non-Mut cell lines were unresponsive to the drug (Figure 5E). Taken together, these findings strongly support SYSMut’s assessment that mutations in the lipid metabolism network exhibit significant functional impact in HNSC (Figures 3 and 4).
Discussion
Individual tumors typically harbor multiple genomic aberrations in addition to alterations spanning the epigenomic and transcriptomic scales, thus posing a significant challenge to distinguish functionally significant mutations from the background of passenger events [9]. In addressing this challenge, SYSMut decodes the functional significance of somatic mutations in admixed cancer tissue samples.
Computational benchmarking using simulated data demonstrated the robustness of SYSMut in decoding the impact of mutations on downstream transcriptional deregulation even in the presence of co-occurring transcriptional and genomic aberrations similar to real-world tumor molecular profiles. Additionally, our application of SYSMut to analyze the impact of mutations in a PanCancer multiomics dataset [25] recapitulated the vast majority of previously identified cancer driver genes [24] across cancer types, while additionally enabling prioritization of a relatively small fraction (<5%) of rarely Mut genes that exhibit significant transcriptional impact within each cancer type. Importantly, SYSMut models the transcriptional impact of Mut genes by accounting for co-occurring molecular aberrations within each tumor sample, thus uniquely enabling it to decode the tissue-specific functional significance of rare mutational events.
SYSMut’s specific predictions of downstream transcriptional impact assessments were orthogonally validated using genetic manipulation studies in cancer cell line models (Figure 4D–I and Figure S8), thus further supporting the robustness and utility of this framework. The translational utility of SYSMut is evidenced by identifying a lipidogenic subnetwork as being functionally significant in HNSC. This is supported by our findings that HNSC cells harboring mutations in the lipid metabolism network are more likely to exhibit reduced lipid metabolic activity and are sensitive to GRA. While glucocorticoid receptor signaling is known to play a tumor-suppressive role in a subset of cancers [37–39], this is the first study to show that GRA can suppress the growth of HNSC cells harboring mutations in the lipid metabolism pathway. However, further investigation is warranted to explore the precise molecular mechanism underlying this differential sensitivity to GRA and whether targeting this signaling axis might benefit a subset of HNSC patients.
SYSMut can be easily extended to assess for the differential impact of multiple categories of mutations (missense, frame-shift indels, inframe indels, nonsense, splice-site, etc.) in a given gene, or mutations in different functional domains of a given protein. Conversely, SYSMut can also be employed to assess for functional synergies by defining subgroups of tumors characterized by combinations of mutational events across genes. Notably, SYSMut provides complementary information to methods such as BoostDM that are specifically designed to identify driver mutations in genes in specific cancer types. As such, SYSMut could also be employed to assess for the transcriptional impact of specific driver mutations in genes identified by approaches, such as BoostDM.
One limitation of SYSMut is that it is only able to assess the functional impact of mutations in genes represented within the transcriptional influence network. However, the completeness and accuracy of the underlying signaling networks will continue to improve, thus expanding SYSMut’s capabilities. Furthermore, while SYSMut currently only captures the downstream transcriptional impact of mutations we anticipate future versions of SYSMut to also incorporate phosphoproteomic measurements thus enabling assessments of the impact of mutations on downstream signaling networks. In addition, the time and computational complexity of SYSMut are highly dependent on the number of deployed cancer samples and the number of downstream transcriptional TG of a GI.
In conclusion, we propose SYSMut as a robust, flexible and scalable systems biology approach that can reveal the functional significance of the growing number of rare mutational events identified by large-scale cancer sequencing initiatives. Our study highlights the utility of combining regulatory network connectivity with multiomics data to unravel rare but functionally significant mutations in cancer thus allowing for the discovery of novel therapeutic targets in this complex disease.
Supplementary Material
Author Biographies
Sirvan Khalighi is a postdoctoral fellow, at the Case Comprehensive Cancer Center (CCCC) of Case Western Reserve University (CWRU), His research interest Include computational biology and artificial intelligence.
Peronne Joseph is a molecular biology research assistant at CCCC of CWRU.
Deepak Babu is a postdoctoral research associate at CCCC of CWRU. His research interest includes pharmacogenomics in cancer therapy.
Salendra Singh is a computational biology research assistant at CCCC of CWRU.
Thomas LaFramboise is an associate professor of genetics and genome sciences and biostatistics at CCCC of CWRU.
Kishore Guda is an associate professor with a clinical training in veterinary medicine (DVM) at CCCC of CWRU.
Vinay Varadan is an executive director at the department of genome and biomarker sciences, Merck Research Laboratories, and an adjunct assistant professor at CCCC of CWRU.
Contributor Information
Sirvan Khalighi, Division of General Medical Sciences-Oncology, Case Comprehensive Cancer Center; Department of Genetics and genome Sciences.
Peronne Joseph, Division of General Medical Sciences-Oncology, Case Comprehensive Cancer Center.
Deepak Babu, Division of General Medical Sciences-Oncology, Case Comprehensive Cancer Center.
Salendra Singh, Division of General Medical Sciences-Oncology, Case Comprehensive Cancer Center.
Thomas LaFramboise, Department of Genetics and genome Sciences.
Kishore Guda, Division of General Medical Sciences-Oncology, Case Comprehensive Cancer Center; Digestive Health Research Institute; Department of Pathology, Case Western Reserve University School of Medicine, Cleveland, OH-44106 U.S.A.
Vinay Varadan, Division of General Medical Sciences-Oncology, Case Comprehensive Cancer Center.
Funding
This research was supported by PHS awards: T32 CA094186 (S. Khalighi), K25 DK115904 (V. Varadan), P30 CA043703 (V. Varadan), P20 CA233216 (V. Varadan). U54 CA163060 (K. Guda, V. Varadan), Case GI SPORE P50 CA150964 (K. Guda, V. Varadan), DeGregorio Family Foundation (K. Guda), R21 CA248138 (T. LaFramboise), R01 CA217992 (T. LaFramboise), R01 LM013067 (T. LaFramboise).
Data Availability
SYSMut implementation, intermediate results and the related tutorials are available at https://github.com/skhalighicase/SYSMut. The Supplementary Tables are also available at https://github.com/skhalighicase/SYS-Mut/blob/main/SYSMt_SupplTables.xlsx. The details of other software packages, bioinformatics tools, and data used in this study are provided in the (Supplementary Materials and Methods).
References
- 1. Stratton MR, Campbell PJ, Futreal PA. The cancer genome. Nature 2009;458:719–24. [DOI] [PMC free article] [PubMed] [Google Scholar]
- 2. Lawrence MS, Stojanov P, Polak P, et al. Mutational heterogeneity in cancer and the search for new cancer-associated genes. Nature 2013;499:214–8. [DOI] [PMC free article] [PubMed] [Google Scholar]
- 3. Kumar S, Warrell J, Li S, et al. Passenger mutations in more than 2,500 cancer genomes: overall molecular functional impact and consequences. Cell 2020;180:915, e16–27. [DOI] [PMC free article] [PubMed] [Google Scholar]
- 4. Hong DS, Fakih MG, Strickler JH, et al. KRAS G12C inhibition with Sotorasib in advanced solid Tumors. N Engl J Med 2020;383:1207–17. [DOI] [PMC free article] [PubMed] [Google Scholar]
- 5. Oh DY, Bang YJ. HER2-targeted therapies—a role beyond breast cancer. Nat Rev Clin Oncol 2019;17:33–48. [DOI] [PubMed] [Google Scholar]
- 6. Awad M, Liu S, Rybkin I, et al. Acquired resistance to KRASG12C inhibition in cancer. Mass Med Soc 2021;384:2382–93. [DOI] [PMC free article] [PubMed] [Google Scholar]
- 7. Hunter FW, Barker HR, Lipert B, et al. Mechanisms of resistance to trastuzumab emtansine (T-DM1) in HER2-positive breast cancer. Br J Cancer 2019;122:603–12. [DOI] [PMC free article] [PubMed] [Google Scholar]
- 8. Zhao Y, Murciano-Goroff YR, Xue JY, et al. Diverse alterations associated with resistance to KRAS(G12C) inhibition. Nat 2021;2021:1–5. [DOI] [PMC free article] [PubMed] [Google Scholar]
- 9. Khalighi S, Singh S, Varadan V. Untangling a complex web: computational analyses of tumor molecular profiles to decode driver mechanisms. J Genet Genom 2020;47(10):595–609. 10.1016/j.jgg.2020.11.001. [DOI] [PMC free article] [PubMed] [Google Scholar]
- 10. Sjoblom T, Jones S, Wood LD, et al. The consensus coding sequences of human breast and colorectal cancers. Science (80-) 2006;314:268–74. [DOI] [PubMed] [Google Scholar]
- 11. Raphael BJ, Dobson JR, Oesper L, et al. Identifying driver mutations in sequenced cancer genomes: computational approaches to enable precision medicine. Genome Med 2014;6:1–17. [DOI] [PMC free article] [PubMed] [Google Scholar]
- 12. Dees ND, Zhang Q, Kandoth C, et al. MuSiC: identifying mutational significance in cancer genomes. Genome Res 2012;22:1589–98. [DOI] [PMC free article] [PubMed] [Google Scholar]
- 13. Han Y, Yang J, Qian X, et al. DriverML: a machine learning algorithm for identifying driver genes in cancer sequencing studies. Nucleic Acids Res 2019;47:e45–5. [DOI] [PMC free article] [PubMed] [Google Scholar]
- 14. Vandin F, Upfal E, Raphael BJ. Algorithms for detecting significantly mutated pathways in cancer. J Comput Biol 2011;18:507–22. [DOI] [PubMed] [Google Scholar]
- 15. Leiserson MDM, Vandin F, Wu HT, et al. Pan-cancer network analysis identifies combinations of rare somatic mutations across pathways and protein complexes. Nat Genet 2015;47:106–14. [DOI] [PMC free article] [PubMed] [Google Scholar]
- 16. Jia P, Zhao Z. VarWalker: personalized mutation network analysis of putative cancer genes from next-generation sequencing data. Radivojac P (ed.). PLoS Comput Biol 2014;10:e1003460. [DOI] [PMC free article] [PubMed] [Google Scholar]
- 17. Ciriello G, Cerami E, Sander C, et al. Mutual exclusivity analysis identifies oncogenic network modules. Genome Res 2012;22:398–406. [DOI] [PMC free article] [PubMed] [Google Scholar]
- 18. Akavia UD, Litvin O, Kim J, et al. An integrated approach to uncover drivers of cancer. Cell 2010;143:1005–17. [DOI] [PMC free article] [PubMed] [Google Scholar]
- 19. Paull EOEO, Carlin DEDE, Niepel M, et al. Discovering causal pathways linking genomic events to transcriptional states using tied diffusion through interacting events (TieDIE). Bioinformatics 2013;29:2757–64. [DOI] [PMC free article] [PubMed] [Google Scholar]
- 20. Ding J, McConechy MK, Horlings HM, et al. Systematic analysis of somatic mutations impacting gene expression in 12 tumour types. Nat Commun 2015;6:8554. 10.1038/ncomms9554. [DOI] [PMC free article] [PubMed] [Google Scholar]
- 21. Bashashati A, Haffari G, Ding J, et al. DriverNet: uncovering the impact of somatic driver mutations on transcriptional networks in cancer. Genome Biol 2012;13:R124. [DOI] [PMC free article] [PubMed] [Google Scholar]
- 22. Alvarez MJ, Chen JC, Califano A. DIGGIT: a Bioconductor package to infer genetic variants driving cellular phenotypes. Bioinformatics 2015;31:4032–4. [DOI] [PMC free article] [PubMed] [Google Scholar]
- 23. Colaprico A, Olsen C, Bailey MH, et al. Interpreting pathways to discover cancer driver genes with moonlight. Nat Commun 2020;11:69. [DOI] [PMC free article] [PubMed] [Google Scholar]
- 24. Bailey MH, Tokheim C, Porta-Pardo E, et al. Comprehensive characterization of cancer driver genes and mutations. Cell 2018;173:371–385.e18. [DOI] [PMC free article] [PubMed] [Google Scholar]
- 25. Tomczak K, Czerwińska P, Wiznerowicz M. The cancer genome atlas (TCGA): an immeasurable source of knowledge. Contemp Oncol (Pozn) 2015;19:68–77. [DOI] [PMC free article] [PubMed] [Google Scholar]
- 26. Hoadley KA, Yau C, Hinoue T, et al. Cell-of-origin patterns dominate the molecular classification of 10,000 tumors from 33 types of cancer. Cell 2018;173:291–304.e6. [DOI] [PMC free article] [PubMed] [Google Scholar]
- 27. Shrestha R, Wang K, Yeung J, et al. HIT’nDRIVE: patient-specific multidriver gene prioritization for precision oncology. Genome Res 2017;27:1573–88. [DOI] [PMC free article] [PubMed] [Google Scholar]
- 28. Peng X, Chen Z, Farshidfar F, et al. Molecular characterization and clinical relevance of metabolic expression subtypes in human cancers. Cell Rep 2018;23:255–269.e4. [DOI] [PMC free article] [PubMed] [Google Scholar]
- 29. Muiños F, Martínez-Jiménez F, Pich O, et al. In silico saturation mutagenesis of cancer genes. Nat ure 2021;596:428–32. [DOI] [PubMed] [Google Scholar]
- 30. Ghandi M, Huang FW, Jané-Valbuena J, et al. Next-generation characterization of the cancer cell line Encyclopedia. Nature 2019;569:503–8. [DOI] [PMC free article] [PubMed] [Google Scholar]
- 31. Lawrence MS, Sougnez C, Lichtenstein L, et al. Comprehensive genomic characterization of head and neck squamous cell carcinomas. Nature 2015;517:576–82. [DOI] [PMC free article] [PubMed] [Google Scholar]
- 32. Leemans CR, Snijders PJF, Brakenhoff RH. The molecular landscape of head and neck cancer. Nat Rev Cancer 2018;18:269–82. [DOI] [PubMed] [Google Scholar]
- 33. Corsello SM, Nagari RT, Spangler RD, et al. Discovering the anticancer potential of non-oncology drugs by systematic viability profiling. Nat Cancer 2020;1:235–48. [DOI] [PMC free article] [PubMed] [Google Scholar]
- 34. Wang J-C, Gray NE, Kuo T, et al. Regulation of triglyceride metabolism by glucocorticoid receptor. Cell Biosci 2012;2:19. [DOI] [PMC free article] [PubMed] [Google Scholar]
- 35. Præstholm SM, Correia CM, Grøntved L. Multifaceted control of GR Signaling and its impact on hepatic transcriptional networks and metabolism. Front Endocrinol (Lausanne) 2020;11:572981. [DOI] [PMC free article] [PubMed] [Google Scholar]
- 36. de Guia RM, Herzig S. How do glucocorticoids regulate lipid metabolism? Adv Exp Med Biol 2015;872:127–44. [DOI] [PubMed] [Google Scholar]
- 37. Schlossmacher G, Stevens A, White A. Glucocorticoid receptor-mediated apoptosis: mechanisms of resistance in cancer cells. J Endocrinol 2011;211:17–25. [DOI] [PubMed] [Google Scholar]
- 38. Kassi E, Moutsatsou P. Glucocorticoid receptor signaling and prostate cancer. Cancer Lett 2011;302:1–10. [DOI] [PubMed] [Google Scholar]
- 39. Sundahl N, Clarisse D, Bracke M, et al. Selective glucocorticoid receptor-activating adjuvant therapy in cancer treatments. Onco Targets Ther 2016;3:188–202. [DOI] [PMC free article] [PubMed] [Google Scholar]
Associated Data
This section collects any data citations, data availability statements, or supplementary materials included in this article.
Supplementary Materials
Data Availability Statement
SYSMut implementation, intermediate results and the related tutorials are available at https://github.com/skhalighicase/SYSMut. The Supplementary Tables are also available at https://github.com/skhalighicase/SYS-Mut/blob/main/SYSMt_SupplTables.xlsx. The details of other software packages, bioinformatics tools, and data used in this study are provided in the (Supplementary Materials and Methods).