

Abstract
Objective
In electronic health record data, the exact time stamp of major health events, defined by significant physiologic or treatment changes, is often missing. We developed and externally validated a method that can accurately estimate these time stamps based on accurate time stamps of related data elements.
Materials and Methods
A novel convolution-based change detection methodology was developed and tested using data from the national deidentified clinical claims OptumLabs data warehouse, then externally validated on a single center dataset derived from the M Health Fairview system.
Results
We applied the methodology to estimate time to liver transplantation for waitlisted candidates. The median error between estimated date within the period of the actual true date was zero days, and median error was 92% and 84% of the transplants, in development and validation samples, respectively.
Discussion
The proposed method can accurately estimate missing time stamps. Successful external validation suggests that the proposed method does not need to be refit to each health system; thus, it can be applied even when training data at the health system is insufficient or unavailable. The proposed method was applied to liver transplantation but can be more generally applied to any missing event that is accompanied by multiple related events that have accurate time stamps.
Conclusion
Missing time stamps in electronic healthcare record data can be estimated using time stamps of related events. Since the model was developed on a nationally representative dataset, it could be successfully transferred to a local health system without substantial loss of accuracy.
Keywords: electronic health records; major health events; event estimates; method validation, liver transplantation
INTRODUCTION
The last decade has seen a widespread expansion of efforts to adopt artificial intelligence for decision support through machine learned models.1 Complex machine learning models with diagnostic performance that rivals humans’ are frequently proposed, such as models that can detect lung nodes and diabetic retinopathy2; however, these models often face challenges in being validated in a different health system, leading to a validation crisis.3,4 Previous results demonstrate that models built on a nationally representative patient sample can be transferred to local health systems.5 Unfortunately, nationally representative electronic healthcare record (EHR) datasets are rare because they require harmonizing data elements across health systems, which is costly,6 time-consuming, and for some data elements simply not possible.7 National EHR data provides exceptional richness, sample sizes, and granularity not found in national registry data, which is disease-specific.8 However, accurate time stamps, including the onset date of diseases, the initiation of interventions, or the accurate date–time of major health events are often missing. This is particularly concerning because study designs often critically depend on accurate date–time information, and valid conclusions are difficult to reach without a solid study design.
In this manuscript, we propose a machine learning-based solution to infer such missing dates. At a high level, major health events are often accompanied by related events with accurate time stamps, allowing us to narrow the date–time of the major event. This is fundamental to studying trajectories where events can be modeled, and disease progression can be compared to target specific interventions and improve patient’s outcomes. For example, the onset date–time of intraoperative complications are often recorded as the discharge (billing) date but there are laboratory tests, results, and treatments with known and accurate time stamps that imply the onset date of the complication. Additionally, many major events have a cascade of complications leading to that event, a set of interventions (labs, medications, procedures) performed during the event, followed by a period of improvement in labs, and/or other outcomes measures. Again, these data elements collectively imply the date–time of the major health event in question.
As a demonstration of the proposed algorithm, we apply it to estimating the date of liver transplantation (LT). We chose LT because of its high importance and because it provides an excellent illustration of the proposed methodology. LT is considered the ultimate hope for patients with end-stage liver disease with no alternative therapeutic approach. The US has registered patients that require a LT since 1988, and every year more and more patients are added to these waiting lists, with cost estimated at $4.9 billion in 2014.9 This need is forecasted to increase 81% in the next 20 years. Also, gold standard dates are available from the United Network for Organ Sharing (UNOS) to evaluate our method and provide a valid solution.
This application is illustrative of the proposed methodology. In a large, nationally representative clinical claims data warehouse of over 200 million patient lives with multiple conditions, the exact date of LT date was missing for approximately 14 000 out of 16 000 patients that met inclusion criteria for LT. Multiple events, all coded in the EHR with specific time stamps, occur around LT that help narrow the possible date range of the transplant. Preoperative indicators include increases in the model for end-stage liver disease (MELDNa), disease complications, and procedures to alleviate liver decompensation; intraoperative indicators include anesthesia events; and postoperative indicators postoperative complications, immunosuppressive medications, posttransplant care, and overall health improvement. Although none of these events by themselves can indicate the transplant date with sufficient accuracy, we will demonstrate that a model comprised of combinations of these events achieves very high accuracy.
The proposed approach allows for the use of nationally representative datasets from multiple health systems even when the data harmonization process may have resulted in missing dates for events that the study design heavily relies on; thus, providing the resources for the rigor and breadth of predictive analytics in healthcare. We also demonstrated that the model results, which were trained on a nationally representative dataset, can be replicated on other datasets without the need for retraining the model, making the methodology accessible to health systems with insufficient training data of their own. We demonstrated our method on the specific application of LT, but it has the potential of being more generally applied to any other major health event that occurs with a set of before and after signals, such as sepsis and stroke. However, its performance is likely suboptimal for conditions lacking a clear temporal nature.
OBJECTIVES
In this study, we develop and validate a method to estimate the time stamp that indicates when a major health event of interest took place. Specifically, previously, we developed the method to estimate the first date of LT based on data from a large, incomplete and heterogeneous dataset, the OptumLabs data warehouse (OLDW),10 where patients may have received no LT, combined liver and nonliver transplants, and repeated transplants.11 In this article, we extend the proposed study and externally validate the method in a single health system, M Health Fairview (FV), using the LT date from the national registry as the gold standard. The proposed method addresses the gap faced by investigators on using EHR to the top of its capabilities for personalized strategies and real-world applications.
MATERIALS AND METHODS
Data source and cohort selection
OptumLabs data warehouse
The OLDW contains deidentified clinical and claims data for over 200 million patient lives and was used for model development and testing. Relevant data include demographic information, diagnostic and procedure histories, laboratory test results, structured data (MELD score) extracted from clinical notes via natural language processing, medications, and administration data. In particular, indications of the transplant date are available from 3 distinct sources: claims data, coded hospital visit data, and procedure data.
Fairview health systems
For the validation, we use an external dataset from the University of Minnesota (UMN) clinical data repository (CDR) that includes EHR data from the 7 hospitals and over 40 clinics of the FV health system. It has patient encounter, demographic, medical diagnoses, billed procedures, laboratory results, medications, notes, and flowsheet measures for over 2.5 million patients.
Study design
We conducted a retrospective cohort study of patients who underwent LT between January 2006 and December 2019 at FV and from 2007 to June 2018 at OLDW. The cohort selection process and the machine learning-based method design are described in Figure 1.12 The transplant date in the FV cohort was ascertained from the FV transplant information system (TIS), a system that is not integrated into the EHR but reports to UNOS.
Figure 1.

Cohort selection and study design for a machine learning-based method to estimate health events. Legend for ML-Based solution: (a) Data from each patient in the training dataset were segmented into periods of 2 weeks, and (b) processed to yield features relevant for LT and whether LT occurred in the 2-week period in question. (c) A GEE was fitted and resulted in a logistic model for predicting the probability of LT for a given 2-week period. (d) The Logistic model was applied to the processed test and validation data to produce the probability for LT for a given test/validation split using standard procedure10 and during a particular 2-week period. (e) A step function was convolved with the probability for LT over time to determine the LT date.
Analysis
The proposed procedure to estimate LT date takes place in 4 consecutives steps: 1) variables and timeline selection, 2) a logistic regression model, 3) change point detection procedure, and 4) model validation. Details of each step follows.
Variables and timeline
The timeline is divided into nonoverlapping 2-week (calendar weeks) time periods. This is a decision based on the amount of data available—shorter periods allow for more granularity of the signal but less information overall to the logistic model—and to account for the series of clinical events that happen during and around the recovery period for this specific population. The following variables are computed for each patient in each 2-week period: (1) the number of liver transplant diagnoses as a percent of the total number of diagnosis; (2) the number of diagnoses related to aftercare following organ transplant or change and removal of surgical wound dressing; (3) the number of diagnoses indicating that the individual is awaiting organ transplant; (4) the number of diagnoses indicating complications of liver transplant; (5) the number of diagnoses related to preoperative examination; (6) the number of procedure records related to anesthesia; (7) the number of procedure records related to the administration of Tacrolimus (common immunosuppressive medication used in LT). We expect these variables to change significantly at the time of transplant.
Logistic regression model
Next, a logistic regression model was constructed to predict whether a 2-week period completely follows the event or not (ie, completely after the event or contains the event) (Figure 2). Since each patient contributes a varying number of observations, a generalized estimating equation (GEE) model was utilized. In this implementation, a GEE with no dependence structure—independence (Python statsmodel.api package)—was utilized instead of an autoregressive correlation structure, as the latter has been shown to produce suboptimal results9; however, this can be used in other applications.
Figure 2.
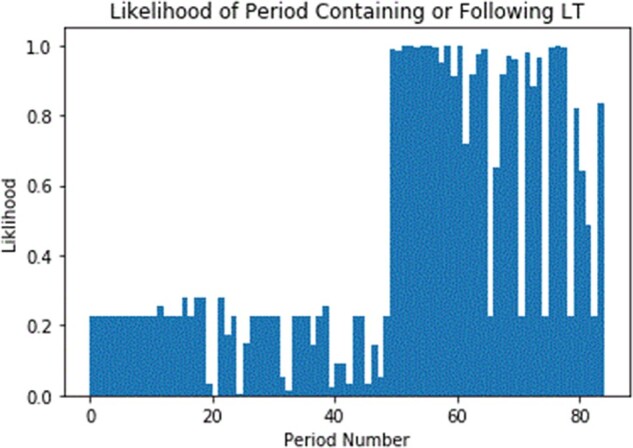
Predicted probabilities of an LT event.
Convolution of signal
Given a series of probabilities, 1 for each 2-week period, for an individual, we seek to identify the point at which the event was most likely to have occurred by convolving the series with a signal in the shape of a step function. A convolution is the integral part of the product of the 2 input functions, given the second is reversed and offset by some variable amount.13 Visually this can be interpreted as the area of overlap of 2 signals, as one is superimposed at different positions over the other. Formally stated, a discrete convolution is the sum of the element-wise product of 2 sequences for a given offset as shown in the following equation:
As an illustration, Figure 2 shows the probability of each 2-week period being completely before the event for a sample patient and Figure 3 overlays the convolved signal. The value of the convolution will be greatest at the point where the 2 signals overlap the most. We defined a peak to be a point at which the preceding and following points are both less than or equal to the point of interest.
Figure 3.
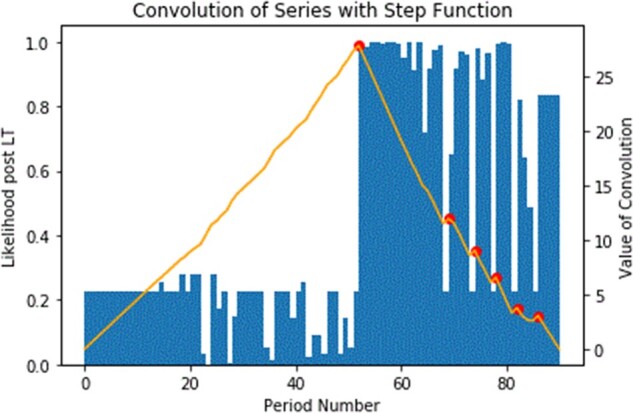
Convolution of predicted LT event probability with step function (yellow line with 1 peak and multiple peaks) over time.
Date selection within timeline
With a period identified as most likely to contain the event, we selected a specific date by choosing the first occurrence of some indicator of interest. In the case of LT, we selected the first date within the 2-week period where a patient received a diagnosis of liver transplantation. If such an indicator was not available, the last date of the 2-week period was selected. These selections are chosen to best fit the application.
Alternative methods
To demonstrate the validity of the proposed method, we compare with alternatives. We select simple applications as this is intended to be simple and easy to understand by clinicians and considering the overall goal of estimating the first date of LT, but not the subsequent ones, where usually demonstrated imputation methods have shown promising results. 1) First LT Diagnosis Date. The simplest alternative method is to simply take the first date where an individual has a diagnosis of LT and/or add further filters, such as a diagnosis of aftercare following organ transplant along with the LT diagnosis; 2) Convolved LT Diagnosis Date. To demonstrate the effectiveness of the GEE modeling, we consider an alternative method where we apply the convolution to the “LT diagnosis” variable without constructing a GEE model. Erroneous codes are a small portion of the patient's diagnosis history, but if the number of LT diagnoses is the larger number of the diagnoses data for that period, they are unlikely to be erroneous. Then a noticeable uptick in diagnosis would correlate with the event of interest; 3) Moving Average. The moving average over a 3-period (6-week) window is assigned to the center point of the window; Finally, 4) Change Point Detection. Compute the change in probability (of a 2-week period being after the event) over the endpoints of some window centered on the period of interest.
External validation on FV
The same methodology and models were applied to the external FV data without retraining. First, we selected the same timeline and computed the same variables. Second, we apply the GEE model developed from the OLDW data rather than train a new regression model using the FV data cohort. Users of the method may not be able to train the model, so we wanted to verify that a model built on 1 dataset can be easily applied elsewhere. Third, we apply the convolution of signals and select dates inside the period.
Gold standard for date of LT
In the FV cohort, date of LT is known and we use the date recorded in the UNOS national registry. In the OLDW cohort, a linkage to UNOS was not possible at the time of this writing, so validation was only performed on patients with known LT dates.
Evaluation metric
The Area Under the Curve (AUC) was used to evaluate the predictive performance of the GEE model. After the convolution of signal was applied, the average and median absolute error between the estimated and the true date of LT measured in days were calculated. The percent of patients whose date of LT was estimated with less than 1 week and less than 2 weeks of absolute error were calculated in both OLDW and FV data. A comparison between metrics from OLDW and FV was used to evaluate the transferability of the model to an external site.
The UMN Institutional Review Board approved the OLDW (#0000092), and FV and TIS (#00002613) studies. OLDW data management and analysis was performed within the OLDW sandbox using DBVisualizer Pro and Python 3. FV data management and analysis were performed using Python 3 inside Minnesota Supercomputing Institute.
RESULTS
Table 1 shows the descriptive of the OLDW and Fairview Health Systems (FHS) cohort included in this study.
Table 1.
Patient demographics, characteristics, and feature selection characteristics for the OLDW and FHS samples
| OLDW |
FHS | ||
|---|---|---|---|
| N = 1469 (True LT cohort) | N = 10 738 (non-LT cohort) | N = 788 | |
| N(%)/Median (IQR) | N(%)/Median (IQR) | N(%)/Median (IQR) | |
| Gender (Male) | 886 (60.31%) | 5761 (53.65%) | 540 (68.53%) |
| Race (Caucasian) | 1062 (72.29%) | 7022 (65.39%) | 599 (76.02%) |
| Age (years) | 56 (sd = 10.21) | 56 (sd = 11.83) | 55 (sd = 10.54) |
| Model for end-stage liver MELDNa | 14.36 (sd = 4.74) | 14.57 (sd = 6.00) | 24.35 (sd = 11.15) |
| Total number of diagnosesa | 1460 [878 − 1833] | 455 [167 − 1087] | 1312 [15 − 9140] |
| LT diagnosisa | 196 [87 − 323] | 15 [3 − 79] | 165 [1 − 1164] |
| After care diagnosisa | 15 [2 − 46] | 0 [0 − 8] | 26 [0 − 209] |
| Awaiting organ diagnosisa | 6 [1 − 24] | 0 [0 − 0] | 5 [0 − 73] |
| LT complication diagnosisa | 3 [0 − 14] | 0 [0 − 1] | 3 [0 − 246] |
| Preprocedure examination diagnosisa | 5 [1 − 16] | 0 [0 − 2] | 1 [0 − 65] |
| Anesthesia procedurea | 4[2 − 7] | 0[0 − 2] | 8 [0 − 92] |
| Immunosuppression usea | 42 [9 − 99] | 0 [0 − 9] | 22 [0 − 642] |
Abbreviations: FHS, Fairview Health Systems; IQR, interquartile range; LT, liver transplant; OLDW, OptumLabs data warehouse; sd, standard deviation.
Descriptive numbers represent median and interquartile ranges for documented records of the entire included sample.
Table 2 shows the coefficients, their standard errors, and P value for the GEE model developed in OLDW. Only statistically significant predictors are displayed. The “LT diagnosis” variable denotes the percentage of liver transplant diagnoses among all diagnoses during the 2-week period. This is mainly due to the fact that diagnoses are repeatedly documented in the EHR after the first occurrence and by several professionals every time they evaluate a patient; thus, the amount of LT diagnoses are highly correlated with higher encounters, and consequently, higher other diagnoses occurrences, and the pick has shown to occur at the time of LT due to the complexity of the procedure. The 3 main variables selected by content experts are “LT diagnosis,” “after care diagnosis” (whether or not a patient received after-transplant care), and “immunosuppression use,” which is common after transplant. These same coefficients were applied in the FV during the external validation. The AUC of the OLDW model on the internal (OLDW) hold out test set was .94, and it achieved an AUC of .86 on the external (FV) dataset (without retraining).
Table 2.
Generalized estimating equation results for the probabilities indicating the likelihood of liver transplant occurrence
| Coefficient | SE | P value | |
|---|---|---|---|
| Intercept | −1.22 | 0.05 | <.001 |
| LT diagnosis | 15.16 | 1.62 | <.001 |
| After care diagnosis | 2.78 | 0.20 | <.001 |
| Awaiting organ diagnosis | −0.46 | 0.06 | <.001 |
| LT complication diagnosis | 0.67 | 0.14 | <.001 |
| Preprocedure examination diagnosis | −0.16 | 0.03 | <.001 |
| Anesthesia procedure | 0.18 | 0.04 | <.001 |
| Immunosuppression use | 1.12 | 0.29 | <.001 |
Abbreviation: SE, Standard error.
The median error (the absolute difference between the predicted and true LT date in days) for the proposed method, in both the development and the validation cohort, was 0 days. The proposed method was able to estimate LT date within 1 week (resp. 2 weeks) error for 84% (resp. 92%) of the patients in the OLDW cohort; and for 76% (resp. 84%) in the external validation cohort. The performance in both the development and validation studies are shown in Table 3.
Table 3.
Performance evaluation metrics found in the OLDW development and FHS validation studies
| Median error [days] | Accuracy within 1 week [%] | Accuracy within 2 weeks [%] | |
|---|---|---|---|
| OLDW | 0 | 84 | 92 |
| FHS | 0 | 76 | 84 |
Abbreviations: FHS, Fairview Health Systems; OLDW, OptumLabs data warehouse.
Figures 2 and 3 present an illustration of how the method works. Figure 2 shows the estimated probability from the GEE for a sample patient. The horizontal axis corresponds to time, and each point represents a 2-week period. There are a total of 85 two-week periods covering 170 weeks. The vertical axis corresponds to the probability of a particular 2-week period containing (or being after) the transplant date. From the figure, we can identify that the transplant took place at around the 50th 2-week period with a significant jump in probability from around 20% to almost 100%. While the probability is almost 100%, it is worth pointing out that the maximal probability was reached at around the 75th 2-week period.
Figure 3 overlays the convolutional signal on top of the probabilities from Figure 2. The red dots represent peaks in the convolutional signal. The main (tallest) peak is at the correct 2-week period (about the 50th period). The blue color in the figure indicates the probabilities derived from the GEE for a specific patient, where a sharp jump around the week 60th from around 22% to 100% is observed; thus, making clear the LT date occurred at that point. The yellow line represents the convolution signal overlaying the probabilities, and the tallest pick is the correct 2-week period.
Alternative methods results
Table 4 shows a summary of the performances for the alternative methods tested.
Table 4.
Evaluation of the proposed method against alternatives
| Average Absolute error [days] | Median Error [days] | Accuracy within 1 week [%] | Accuracy within 2 weeks [%] | |
|---|---|---|---|---|
| Proposed method | 18 | 0 | 84 | 92 |
| First LT Diagnosis Date | 80 | 0 | 67 | 75 |
| Convolved LT Diagnosis Date | 123 | 17 | 19 | 45 |
| Moving Average | 270 | 70 | 4 | 19 |
| Change Point Detection | 131 | 13 | 34 | 55 |
Abbreviation: LT liver transplant.
First LT Diagnosis Date. Using the simplest method, where the date of LT is estimated as the date of the first occurrence of an LT diagnosis, the median error remains 0 days, similarly to the proposed method, but the average error increases to 80 days (from 18 days for the proposed method). The reason behind the increase is that nearly 20% of the individuals from the validation cohort (who had a known LT date) have diagnosis codes indicating liver transplant more than 30 days prior to the actual date of transplant. These errors may be due to an individual being transferred to another facility and requiring documentation as to the reason for the transfer; the actual transplant then occurred at a later date. Adding in further filters (eg, aftercare diagnosis along with LT diagnosis) also leads to difficulty, as there is less coverage for each of these additional indicators. About 15% of the validated subset did not have any diagnosis of aftercare.
Convolved LT Diagnosis Date. If we simply used the percent of LT diagnosis codes with our convolution method (without constructing the GEE model), the average error increases to 180 days and the median error to 15 days. The estimated date is typically after the actual date of transplant—likely due to the fact that, just after the transplant, patients have a series of new LT billing diagnoses related to complications as well as recovery from this major surgical procedure.
Moving Average. The average and median errors are 270 and 63 days, respectively. The date with peak probability of being the LT date appears several weeks after the actual date. This evaluation used a window size of 3 time periods. Expanding it to a window of 5 further increases the average absolute error to 277 days and the median error to 90 days.
Change Point Detection. Using simply change detection, while the method works well in some cases, it is susceptible to noise. Evaluating this method on the entire test set with window sizes of 3 and 5, we found average absolute errors of 131 and 98 days, respectively, and median errors of 12 and 24 days, respectively.
DISCUSSION
A successful machine learning-based method was developed for estimating the onset date of major health events in a large national clinical claims warehouse, and the model was externally validated in an independent health center. The method used the specific application of estimating the date of first occurrence of LT in patients with a single LT, combined liver and kidney transplant, and repeated LTs. We managed to estimate the date with a median error of 0 days and with 84% of the estimated dates falling within 1 week of the actual date.
Significance. The current emphasis on personalized approaches through predicting modeling, gives rise to the need for nationally representative large data warehouses aggregated from multiple health systems from multiple regions in the country. Harmonizing data elements from multiple health systems is costly, time-consuming, and differences in the definitions of data elements across the health systems cannot always be resolved. This leads to missing data elements or missing time stamps. Some time stamps, such as index dates, dates of interventions, and onset dates of complications and outcomes, are of ultimate importance in the study design and hence critically influence the validity of the study. Our work proposes and validates a machine learning method that can estimate these time stamps, specifically for LT, accurately.
The benefit of the proposed method goes beyond than just completing specific missing data elements in multisite datasets, which several imputation methods have been proven successful. Missing time stamps for the first occurrence of health events are common even in single-site EHR data. For instance, specific dates of diagnoses are mostly not available due to the structure of the EHR: diagnosis codes are dated to the discharge and/or admission date, as they are primarily used for billing. Similarly, during aggregation, data elements could be omitted due to lack of standards, interoperability, or to a lack of documentation. In the case of LT application, LT date was available only for 2000 out 16 000 patients who had any historical data.
Generalizability to other applications. While the exact date of health events may not be known from the EHR data, many related events with known exact dates can help narrow the possible date of the event. When extracting the exact date of the onset of complications, that information may be missing due to being associated with a diagnosis code; but laboratory orders and results as well as interventions procedures have dates recorded. Similarly, when the LT date procedure is not available due to data element standardization issues, perioperative activities, including medications and procedures, as well as complications and events indicative of a major surgery, have exact dates and help determine the LT date. The proposed method can be applicable to other health conditions beyond LT, specifically when estimating a missing event date that has related measurements and interventions with known dates. When applying this methodology to estimate the date for other diseases and conditions, the appropriate timeframe should be determined by the frequency of informative events around the event of interest.
Transferability of the model to other health systems. The study results showed that it is possible to build a model in an incomplete national dataset and successfully apply it to a single center dataset with minimal loss in performance. This is in accordance with previous studies that showed that even a complex machine learning model built on national datasets, such as OLDW, can be transferred to local healthcare systems. A modeling approach, in which a model is learned from a national cohort and is externally validated, produces a transferable model, allowing patients at smaller healthcare systems to benefit from precision medicine.5 Transferability is important because (i) it suggests that the model learned stable relationships that are not overly specific to a particular setting and (ii) a transferable model allows for a health system with insufficient amounts of data (or no data at all) to apply the proposed model and benefit from it. However, additional replications studies could add to this body of knowledge and show that the method works for other specific conditions as well.
Strength and limitations. An important strength of this study is the transferability and external validity of the method. Additionally, to our knowledge, this is the first study to develop a method to estimate major health event such as LT occurrence in longitudinal clinical data, and externally validate it with success. Applying convolution of probabilities derived from the GEE resulted in a model that performs better than the alternative methodology approaches in isolation. Poor documentation due to both provider data documentation and variation or missingness in the EHR data contributed to OLDW, a large portion of diagnosis and procedure codes are missing, may impact the performance of the algorithm. The algorithm relies on the difference between the pre- and post-LT codes density (number of codes per 2-week period). If the more complete data erase this difference, the algorithm’s performance will be adversely affected.
CONCLUSION
This study successfully developed and externally validated a method to estimate the time of major health events, specifically LT date. The method estimated the LT date with a median error of 0 days and 84% of the estimates fell within a 1-week window of the actual LT date. Alternative methods achieved worse performance with median errors of 2 weeks to 2 months and with only 4% to 67% of the estimates falling within a 1-week window.
FUNDING
This work was supported by the University of Minnesota Grant-in-Aid of Research, Artistry and Scholarship (GIA), grant number 212912.
AUTHOR CONTRIBUTIONS
LP and GS were responsible for all steps of the design and conduct of the proposed study, as well as guiding all steps from the start to the end. BS developed the study in OLDW, JZ validated in FHS, and SM oversaw the validation study. BS, JZ, and SM helped with writing the results, discussions, and implications. TP and JDS contributed to the clinical implications, provided content expertise related to liver transplantation during the design, and contributed to the discussion. All authors read and approved the final manuscript.
DATA AVAILABILITY STATEMENT
The OLDW data underlying the results of this study are third-party data owned by OptumLabs and contain sensitive patient information; therefore, the data is only available upon request. Interested researchers engaged in HIPAA-compliant research may contact [email protected] for data access requests. The OLDW data use requires researchers to pay for rights to use and access the data. The FHS data underlying this article cannot be shared publicly due to the privacy of individuals who authorized the use of their data for research. FHS data will be shared on reasonable request to the corresponding author following HIPAA standards for research. The source code used for the core is available under request to the corresponding author.
CONFLICT OF INTEREST STATEMENT
None declared.
REFERENCES
- 1.Yadav P, Steinbach M, Kumar V, Simon G.. Mining electronic health records (EHRs): A survey. ACM Comput Surv 2018; 50 (6): 1–40. [Google Scholar]
- 2.Ahmed Z, Mohamed K, Zeeshan S, Dong XQ.. Artificial intelligence with multi-functional machine learning platform development for better healthcare and precision medicine. Database (Oxford) 2020; January 1, 2020. doi: 10.1093/database/baaa010 [DOI] [PMC free article] [PubMed] [Google Scholar]
- 3.Kanwal F, Taylor TJ, Kramer JR, et al. Development, validation, and evaluation of a simple machine learning model to predict cirrhosis mortality. JAMA Netw Open 2020; 3 (11): e2023780. [DOI] [PMC free article] [PubMed] [Google Scholar]
- 4.Beam AL, Manrai AK, Ghassemi M.. Challenges to the reproducibility of machine learning models in health care. JAMA 2020; 323 (4): 305–6. [DOI] [PMC free article] [PubMed] [Google Scholar]
- 5.Kim E, Caraballo PJ, Castro MR, Pieczkiewicz DS, Simon GJ.. Towards more accessible precision medicine: building a more transferable machine learning model to support prognostic decisions for micro- and macrovascular complications of type 2 diabetes mellitus. J Med Syst 2019; 43 (7): 185. [DOI] [PubMed] [Google Scholar]
- 6.Casey JA, Schwartz BS, Stewart WF, Adler NE.. Using electronic health records for population health research: a review of methods and applications. Annu Rev Public Health 2016; 37 (1): 61–81. [DOI] [PMC free article] [PubMed] [Google Scholar]
- 7.Saulnier KM, Bujold D, Dyke SOM, et al. Benefits and barriers in the design of harmonized access agreements for international data sharing. Sci Data 2019; 6 (1): 297. [DOI] [PMC free article] [PubMed] [Google Scholar]
- 8.Cohen B, Vawdrey DK, Liu J, et al. Challenges associated with using large data sets for quality assessment and research in clinical settings. Policy Polit Nurs Pract 2015; 16 (3–4): 117–24. [DOI] [PMC free article] [PubMed] [Google Scholar]
- 9.Habka D, Mann D, Landes R, Soto-Gutierrez A.. Future economics of liver transplantation: a 20-year cost modeling forecast and the prospect of bioengineering autologous liver grafts. PLoS One 2015; 10 (7): e0131764. [DOI] [PMC free article] [PubMed] [Google Scholar]
- 10.OptumLabs. OptumLabs and OptumLabs Data Warehouse (OLDW) Descriptions and Citations. Cambridge, MA; 2019. Reproduced with permission from OptumLabs.
- 11.Pruinelli L, Stai B, Ma S, Pruett T, Simon GJ. A likelihood-based convolution approach to estimate event occurrences in large longitudinal incomplete clinical data. In: proceedings of the 2019 IEEE International Conference on Healthcare Informatics, ICHI 2019. 2019. doi:10.1109/ICHI.2019.8904622
- 12.Duda RO, Hart PE, Stork DG.. Pattern Classification. 2nd ed. New York, NY: Wiley; 2000. [Google Scholar]
- 13.Behl A, Bhatia A, Puri A.. Convolution and applications of convolution. IJIRT 2014; 1 (6): 2122–6. [Google Scholar]
Associated Data
This section collects any data citations, data availability statements, or supplementary materials included in this article.
Data Availability Statement
The OLDW data underlying the results of this study are third-party data owned by OptumLabs and contain sensitive patient information; therefore, the data is only available upon request. Interested researchers engaged in HIPAA-compliant research may contact [email protected] for data access requests. The OLDW data use requires researchers to pay for rights to use and access the data. The FHS data underlying this article cannot be shared publicly due to the privacy of individuals who authorized the use of their data for research. FHS data will be shared on reasonable request to the corresponding author following HIPAA standards for research. The source code used for the core is available under request to the corresponding author.