


How to Make an Interactive Infographic [+Templates]


Knowing how to make a flowchart is a valuable skill, regardless of your field or industry. If you’re intimidated by the thought of creating a flowchart from scratch, we’re here to help you out.
In this guide, we’ll walk you through the basic steps of designing a flowchart that helps you achieve your goals in the best possible way.
If you prefer watching to reading, check out this video, where one of my colleagues shows you how to make professional flowcharts and diagrams in just two minutes.
If you want to skip the tutorial and start creating your own flowchart, use our drag-and-drop flowchart maker to get started right away.
Here’s a short selection of 8 easy-to-edit flowchart templates you can edit, share and download with Visme. View more templates below:


A flowchart is a visual representation of a process, system or workflow. It uses a combination of symbols, shapes and arrows to illustrate the sequence of steps and decisions involved in accomplishing a task. Think of a flowchart as a roadmap that guides you from start to finish, showcasing the logical flow of actions and providing a clear overview of a process.
A flowchart shouldn't be confused with a timeline chart. These are two very different charts with distinctive purposes. They can complement each other, but they shouldn't be interchanged.
Much like bubble charts, scatter plots and graphs, flowcharts have versatile applications across various industries and disciplines. They are widely used for process analysis, project management and designing systems, providing a visual framework that enhances understanding.
I personally love flowcharts. I use them as a writing strategy tool. I made a master flowchart that I reuse whenever I write a new article. It starts with accepting the brief, reviewing the outline, doing research etc, until it ends at publication. I have this flowchart printed and on my office corkboard.
Why do I follow a flowchart to help me with my articles? Because when I make a repetitive process more efficient, it removes errors and bottlenecks.
The origin of flowcharts begins in the 1920s with Frank and Lillian Gilbreth, industrial engineers and efficiency experts looking for ways to visualize and improve complex industrial processes.
The term flowchart was first introduced as the flow process chart when Frank Gilbreth introduced it to the American Society of Mechanical Engineers (ASME).
Later on, in the 1930s, Allan H. Mogensen, an industrial engineer and consultant who studied The Gillbreths’ work, started teaching how to use process flow charts during a set of conferences called Work Simplification.
One of his students, Ben S. Graham, took the information to Procter & Gamble and other companies to help with their processes and improve efficiency.
The widespread adoption of flowcharts then accelerated with the rise of computer programming in the 1950s and 60s. Computer scientists and programmers quickly recognized the flowchart as a valuable tool for designing and documenting all sorts of processes in their work.
1920s: Frank and Lillian Gilbreth, industrial engineers, developed the first flowcharts, called flow process charts, to visualize and improve industrial processes.
1930s: Allan H. Mogensen, inspired by the Gilbreths’ work, began teaching process flowchart techniques at his Work Simplification conferences.
1940s: Ben S. Graham, a Mogensen student, brought flowchart methods to companies like Procter & Gamble to improve efficiency.
1950s–60s: The rise of computer programming popularized flowcharts as essential tools for designing and documenting processes.
Today, Flowcharts are widely used across industries like software development, business, and education, and tools like Visme and Microsoft Word make them accessible to everyone.
Flowcharts are made up of symbols and each one has a particular use.
These are the flowchart symbols available in Visme’s flowchart maker. Using the correct symbols will help your reader understand flows better and faster.
Made with Visme Infographic Maker
Flowcharts come in various types, each with its unique purpose and structure. Let's dive into the four main types of flowcharts you need to know. Additionally, I provide an example flowchart template for each type to enhance your understanding.
First, take a look at this table to get a quick overview.
For those following the story about the flowchart I use for writing articles, I used the process flowchart to take me from brief to publication clearly and easy to reference.
| Type of Flowchart | Description | Key use cases |
| Process Flowcharts | Visualizes the sequential steps of a specific process from start to finish | Manufacturing procedures, software algorithms, cooking recipes. |
| Swimlane Flowcharts | Maps out processes across different departments or roles, showing interactions and responsibilities. | Customer service workflows, cross-team project management, IT service processes. |
| Data Flowcharts | Tracks the movement and transformation of data through a system or organization. | Software system designs, database management, information processing systems. |
| Workflow Diagrams | Illustrates the sequence of tasks and activities required to complete a business process. | Business process optimization, document approval systems, HR recruitment processes |
This is one of the most commonly used flowcharts compared to the others. Process flowcharts or process flow diagrams depict step-by-step sequences of activities within a process, making it easy to understand the workflow. They are ideal for analyzing and optimizing processes, identifying bottlenecks and improving efficiency.
Swimlane flowcharts take process flowcharts to the next level by introducing swimlanes representing different departments, individuals or responsibilities. They provide a clear visual representation of handoffs and interactions, helping identify accountability, collaboration and areas of improvement.
Focused on the movement of data within a system or process, these flowcharts illustrate how data is processed, stored or transformed. They are widely used in software development, system analysis and data management to understand and optimize data flow.
Also known as deployment flowcharts, these diagrams showcase interactions between different entities in a system or process. They visualize the flow of tasks, decisions and events among individuals, departments or systems. Workflow diagrams help understand and improve coordination and communication between various components.
Read this article to learn more about the 15 most popular types of flowcharts and discover how each one can enhance your understanding of processes, optimize workflow, and improve decision-making.
Flowcharts are so versatile, you can use them regardless of what industry you’re in. Let’s take a look at different use cases for a number of industries, just to give you an idea.
Flowcharts are an essential tool for organizations to streamline communication and keep track of repetitive processes across various contents.
In the tech world, flowcharts serve as blueprints for visualizing complex system architectures and software workflows.
Educators can leverage flowcharts to break down complex concepts and create clear learning pathways.
Flowcharts help sales and marketing teams map customer experiences and optimize lead generation.
Business professionals use flowcharts to document processes and clarify organizational structures.
Manufacturers employ flowcharts to design, optimize and document intricate production processes.
Engineers rely on flowcharts to illustrate technical systems and document safety protocols.
There are several tools you can use to make flowcharts.
For instance, when I first started making flowcharts for my work processes, I used Microsoft Word, and it took me a while to figure out. I’ve expanded to Visme since then, though, and I’ll tell you why later.
But if you really want to create a flowchart using Microsoft Word, this is how to do it on the Microsoft Word Web app. If you’re using a downloadable version, you can use Smart Art instead.
Step #1: In an open document in the Word Web App, click Insert. In the Illustrations box, click Drawing.
Step #2: In the dialog, open the shapes panel and select a shape. For every new shape you add, click Insert and then Shapes.
Step #3: Add the lines connecting the shapes. The lines are inside the shapes panel, so the steps to find them are the same. Click on any line to drag it to one of its docking points.
Step #4: Customize the shapes and lines by clicking on the Shapes word next to Draw. Use the controls to change their appearance or change to another shape. Control the thickness of the lines.
Step #5: Add text boxes inside the shapes by clicking Insert, then Text. Add a text box on top of a shape. Customize the text by clicking on the Text word next to Shape.
Step #6: Click Save and Close on the top right of the dialog, and your flowchart will appear inside the document.
You can create visually appealing and easy-to-understand flowcharts using several tools, but with Visme, it’s just easier.
Go on, open Visme and follow these seven simple steps to create a flowchart with the help of endless design features to support your work.
I told you I’d tell you more about why I switched to Visme for my flowcharts. In this section, you’ll learn about so many of the features available in Visme that make it all worth it for me.
The best flowcharts are simple and clear, and effectively communicate each step of the process.
So, before knowing how to design a flowchart, you must determine why you’re creating one in the first place. This step applies regardless of what tool you’re using to make it.
Your flowchart can have various goals, such as:
When you know the purpose of your flowchart, it’s easier to choose the type of flowchart to create, pick the most relevant template, and know whether to focus more on design or function when making one.
Creating a flowchart from scratch can be intimidating. Luckily, you don’t have to.
Visme’s flowchart template library has hundreds of templates that can work as foundations for your own flowcharts. That said, you can very well create from scratch with Visme using the diagramming features in the toolbar.
In the dashboard, search for flowcharts and select a template created specifically for your field or industry. Customizing this template will take less time and effort.
When you find something you like, hover on it and click on Edit to start customizing it.

If you’ll be creating from scratch, start with a blank canvas and put your diagram together using pre-made flowchart content blocks or diagram shapes.
Shapes and symbols play a vital role in any flowchart. They define the components of your flowchart, and each symbol represents something unique.
Read our brief guide to flowchart symbols above to familiarize yourself with the most common shapes and symbols before continuing with this step.
After you’ve identified the purpose of your flowchart, it’s time to draw your diagram. The first thing you need to do here is add the symbols that represent all the components in your flowchart.
If you choose to start with a template, you’ll likely already have the shapes you need in the design. But if you want to change any or are starting from scratch, click on the Data tab on your left, and then select Diagrams.
You can also add blocks of pre-made flows with 3-4 shapes by navigating to the Basics tab and selecting Diagrams.
Pro-tip: Sketch out your flowchart on a piece of paper before proceeding to draw it on your computer. This will prevent you from pressing “undo” repeatedly, and help you create your flowchart faster and more efficiently. Personally, I like doing sketching the draft with a whiteboard and colored markers.If you’re making your flowchart in Visme, you can add flowchart symbols by clicking on the Data tab on your left, and then selecting Diagrams.

You can also add blocks of pre-made flows with 3-4 shapes by navigating over to the Basics tab and selecting Diagrams from there.

Once you’ve added some basic shapes, you can now connect them with lines and arrows. This leads us to the next step.
Once you’ve added all the different shapes you need, it’s time to connect each one with lines and arrows.
We recommend using arrows if you want to show a specific direction of your flow of information. For example, the flowchart example below visualizes how information is flowing in different directions with the help of arrows.

In Visme, there are various line and arrow designs to choose from if you want to add them manually. All of the lines and arrows are fully customizable, drag-and-drop, and easy to rearrange and move around.
Pro Tip: Another effective way to quickly create flowcharts with Visme is to group steps 2 and 3. Add a shape, click on it, and select one of the pre-made flows that extend out. If you want to change the new shape, just click on it, tap on Edit at the top, and change it to one that suits your needs.Keep doing this until your flowchart is ready!

In some cases, you may want to split paths and add decisions to your flowchart, such as adding two different paths based on Yes/No decisions.
This is useful for visualizing complex processes that require people to take different actions based on varying inputs and outputs.
For example, you may want your employees to shut down a system in case of a power outage. At the same time, you’d want them to keep the system turned on if there’s only minor electricity fluctuation.
In Visme, adding decisions and split paths is easy.
When you click on a shape to extend it, you can choose one of the pre-made split path blocks to extend your flowchart in two different directions.
If you want, you can add text next to each path, such as “Yes” or “No”. Just drag and drop the Text block from the Data → Diagrams tab in the left-hand panel, and edit it.
Suppose you want to educate your audience on diagnosing and resolving slow server issues. To do this, you must include checking both swap and CPU percentages, along with appropriate actions to take based on high and low values.
Here is a flowchart template that visualizes the process:
The next step is to customize your flowchart’s final appearance. Your flowchart’s design will depend on how you plan to use your diagram, where you’ll use it and who the audience is.
Visme’s “Shortcuts” feature makes it super easy for you to find everything you need to customize your flowchart template. By typing the forward slash "/" on your keyboard, a popup appears, providing quick access to a wide range of customization options.
From animations, shapes, and icons to special effects and data visualizations, you'll find almost everything Visme offers right at your fingertips.
With this time-saving feature, you can focus more on your content and ideas, knowing that the design aspect is simplified and optimized for maximum visual impact.
There are several ways to customize your flowchart’s appearance in Visme.
First, you may want to change the size, color, border, roundness and other characteristics of your shapes, symbols and lines.
You can do all of this in Visme by selecting the element in question, and clicking on Edit at the top to reveal the customization toolbar.
You can also change the font, font size, font color and font style of any text in your flowchart, such as the text inside shapes or next to the lines.

Resizing your shapes and lines is easy to do as well. Simply click on a shape and drag it using the controls on each side and corner.
Flowcharts don’t always need to be all text and shapes and no graphics. Sprinkle some visual fun into your flowchart by adding icons where possible.
For example, instead of using text that says “Yes” or “No”, you can add icons of green check marks and red X/cross marks.
You can also add icons in place of the actual shapes and symbols to visualize components. This is especially useful in system diagram flowcharts, where you can add icons of computers, cloud, firewalls, switches, routers and more.
Visme comes built-in with thousands of free vector icons — all fully customizable.
Just click on the Graphics tab, select Icons and sift through the categories manually, or type in your keyword at the top to find relevant options.

You can change the colors of the icons, resize them, replace them with one click and even upload your own icons to enhance your flowchart’s design.
Make your flowchart design stand out by adding an eye-catching header at the top. Headers are not only useful for making your flowchart look good, they’re great tools for communicating the title and purpose of your flowchart.
Create an effective flowchart header by using large and bold text, and even add a graphic like an image or illustration to emphasize on your topic.
In Visme, you can add a header to your flowchart by clicking on the Basics tab and selecting Header & Text. Browse through the options and drag what you like onto your flowchart.

You can also choose from pre-designed font pairs or customize the header that came with your Visme flowchart template.
If you want to add an image to your header, select the Photos tab, and browse through millions of free stock photos. You can also upload your own images from your computer.
Another way to decorate your flowchart header in Visme is to find a relevant illustration or icon in the Graphics tab and resizing it so it’s big enough to fit in the header. Play around with the design and take advantage of visuals to communicate your flowchart topic more effectively.
Add a background to your flowchart to make it stand out. You can add a solid color background or take things up a notch and add an image.

Whatever background you choose to go with, make sure it doesn’t distract readers from the actual flowchart. Your shapes, symbols and lines should be clearly visible at all times.
One way to do that is to add a color overlay to your background image to make the objects and text on top stand out in contrast. You can easily add color overlays to any images in Visme.
Take it a step further and utilize Visme's AI Image generator to effortlessly create various types of backgrounds. This powerful tool enables you to generate unique and eye-catching visuals, such as gradients, abstract patterns or even custom images.
By leveraging the AI Image generator, you can easily customize your flowchart's background to make it truly stand out and leave a lasting impression on your audience. Just type what you want and it will give you exactly what you're looking for.
Once your flowchart is ready, it’s time to download it or share it with your target audience.

In Visme, you have a range of download options for your flowchart, including high-quality PNG and JPG image formats for printing and sharing.
You can save your flowchart as a PDF document for a consistent layout in reports and presentations. Visme also offers interactive HTML5 files for embedding in websites, as well as SCORM and xAPI formats for integration with e-learning platforms. Additionally, you can download your flowchart as a PPTX file to use as a presentation slide.
Apart from downloads, Visme lets you publish your flowchart online with a unique URL or generate an embed code for seamless integration into web pages or projects. These features provide flexibility in sharing and distributing your flowcharts.
Flowcharts are excellent visual tools already, so what could possibly make them better? One word: interactivity.
When you add interactivity to your flowcharts interactive, it:
Now, let’s talk about how Visme can help you breach this hurdle.
With Visme’s array of interactive features and intuitive drag-and-drop functionality, you can effortlessly create an engaging and user-friendly flowchart.
Imagine you're creating a flow chart to explain a step-by-step process for using a software application. You can add clickable buttons to each step of the flowchart, allowing users to navigate directly to relevant sections of the application or access related resources.
For instance, you can create a button labeled "Settings" that, when clicked, takes the user to the settings page of the application.
Enhance the user experience by incorporating hover effects and animated transitions, ensuring a seamless journey through your flowchart.
For example, when moving from one phase to another in a flowchart depicting a project management workflow, you can utilize animated transitions to create a visually appealing and engaging transition effect.
Additionally, you can embed multimedia elements like videos, audio and interactive charts to convey complex concepts with clarity and impact.

Visme's collaboration features enable team members to work simultaneously on the same flowchart. Use it to brainstorm ideas, make edits, and provide feedback. Everyone involved can see changes happening in real time, and sync on timelines, fostering a cohesive and efficient workflow.
Additionally, Visme keeps a detailed revision history, allowing you to track changes and revert to previous versions if needed.
Invite your team members via email or a shareable link and collaborate seamlessly on creating captivating flowcharts.
Also, Visme's workflow management tool streamlines your design process by letting you assign tasks, set deadlines, and oversee progress. Easily manage your team's work in one place to deliver quality content on time.
Are you on the fence about which tool to use to create your own flowcharts?
Here’s a comparison chart to help you discern which tool is better for your needs.
As you can probably imagine, I'm impartial and prefer Visme over Microsoft Word. This is mostly because of the templates and the easy diagramming features that help me build beautiful flowcharts quickly.
| Visme | Microsoft Word | |
| Ease of use | Easy for beginners and powerful for professionals. | Moderate with a learning curve. |
| Features | Intuitive diagraming tool, hundreds of design features, hundreds of fonts, full customization options, integrations with other applications | Part of the Microsoft 365 umbrella, word processor, SmartArt flowchart maker, PDF maker. |
| Interactivity | Hyperlinks, hotspots, popups, embedded video or audio, animation, animated elements, timeline editor. | Hyperlinks and video embeds. |
| Download Options | HTML5, Live Link, PDF, JPG, PNG | PDF and Word document |
| Number of Templates | Hundreds of flowchart templates and thousands of templates in business and personal content types.. | No fully designed templates, just empty building blocks and shapes. |
| G2 Score | 4.6/5 | 4.7/5 |
| Pricing | Free plan. Pro plans start at $12.25 when you pay yearly. | Free plan for use only on web apps. $179.99 for downloadable version. $69.99 a year for Microsoft 365. |
| Team Collaboration | Online whiteboard available for real-time collaborative editing, dedicated design collaboration feature, and a workflow management tool. | Real-time collaboration is available with the Word for web version. |
Making a flowchart is an art, and if you know the basic rules you will do wonders. Below are some best practices to help you make any flowchart more effective and efficient.
I follow these every time I make a flowchart and it really helps to just tick these off as you go.
Looking for some flowchart templates to give you a head start?
In this section, I’ve compiled a number of professionally designed flowchart templates that are ready to use.
I chose these templates to show you a good variety of what’s available. There are many more where these came from, just look for them in Visme’s template gallery.
You can use these flowchart examples to accelerate your flowchart creation process. This is especially useful if you’re a beginner, want to save time or don’t want to deal with making a flowchart from scratch.
Click on the button below the template to start customizing using Visme’s flowchart generator.

Make an eye-catching server flowchart for your business with this basic network diagram template. You can also use it for other specific purposes, such as for visualizing a firewall system or an office network.
This ready-to-go flowchart template can be customized in Visme’s drag-and-drop editor. Change shapes, lines, text, colors, background and more.

This yes/no flowchart is a great way to train your customer service employees, such as sales reps, on how to respond to various customer queries and problems.
You can modify this ready-made flowchart with your own text, rearrange the shapes, and customize the design with your own brand colors and fonts.
If you need assistance writing your flowchart's text and description, use Visme’s AI Writer. This tool can generate, proofread, edit and even rephrase your flowchart text. All you need to do is provide the tool with the necessary information about your requirements, and it will do the work for you in seconds.

This project team flowchart is essentially an organizational chart that you can use to visualize your team structure.
You can customize this flowchart for any business, department or team, and it’s very helpful for understanding roles, responsibilities and who to report to. Replace the existing text, colors, shapes and more in the template with your own and you’re good to go.
If you want to maintain consistent branding, it's crucial to create a flowchart design that aligns with your organization's brand personality.
With Visme's brand wizard tool, you can easily achieve this level of consistency. Save your brand colors, brand fonts, and logo within the brand wizard, and apply them to your flowchart design in just a few clicks.
This ensures that your flowchart seamlessly reflects your brand's visual identity, reinforcing your brand image and professionalism.
Watch the tutorial video below to learn about saving your brand assets under the My Brand aread in Visme.
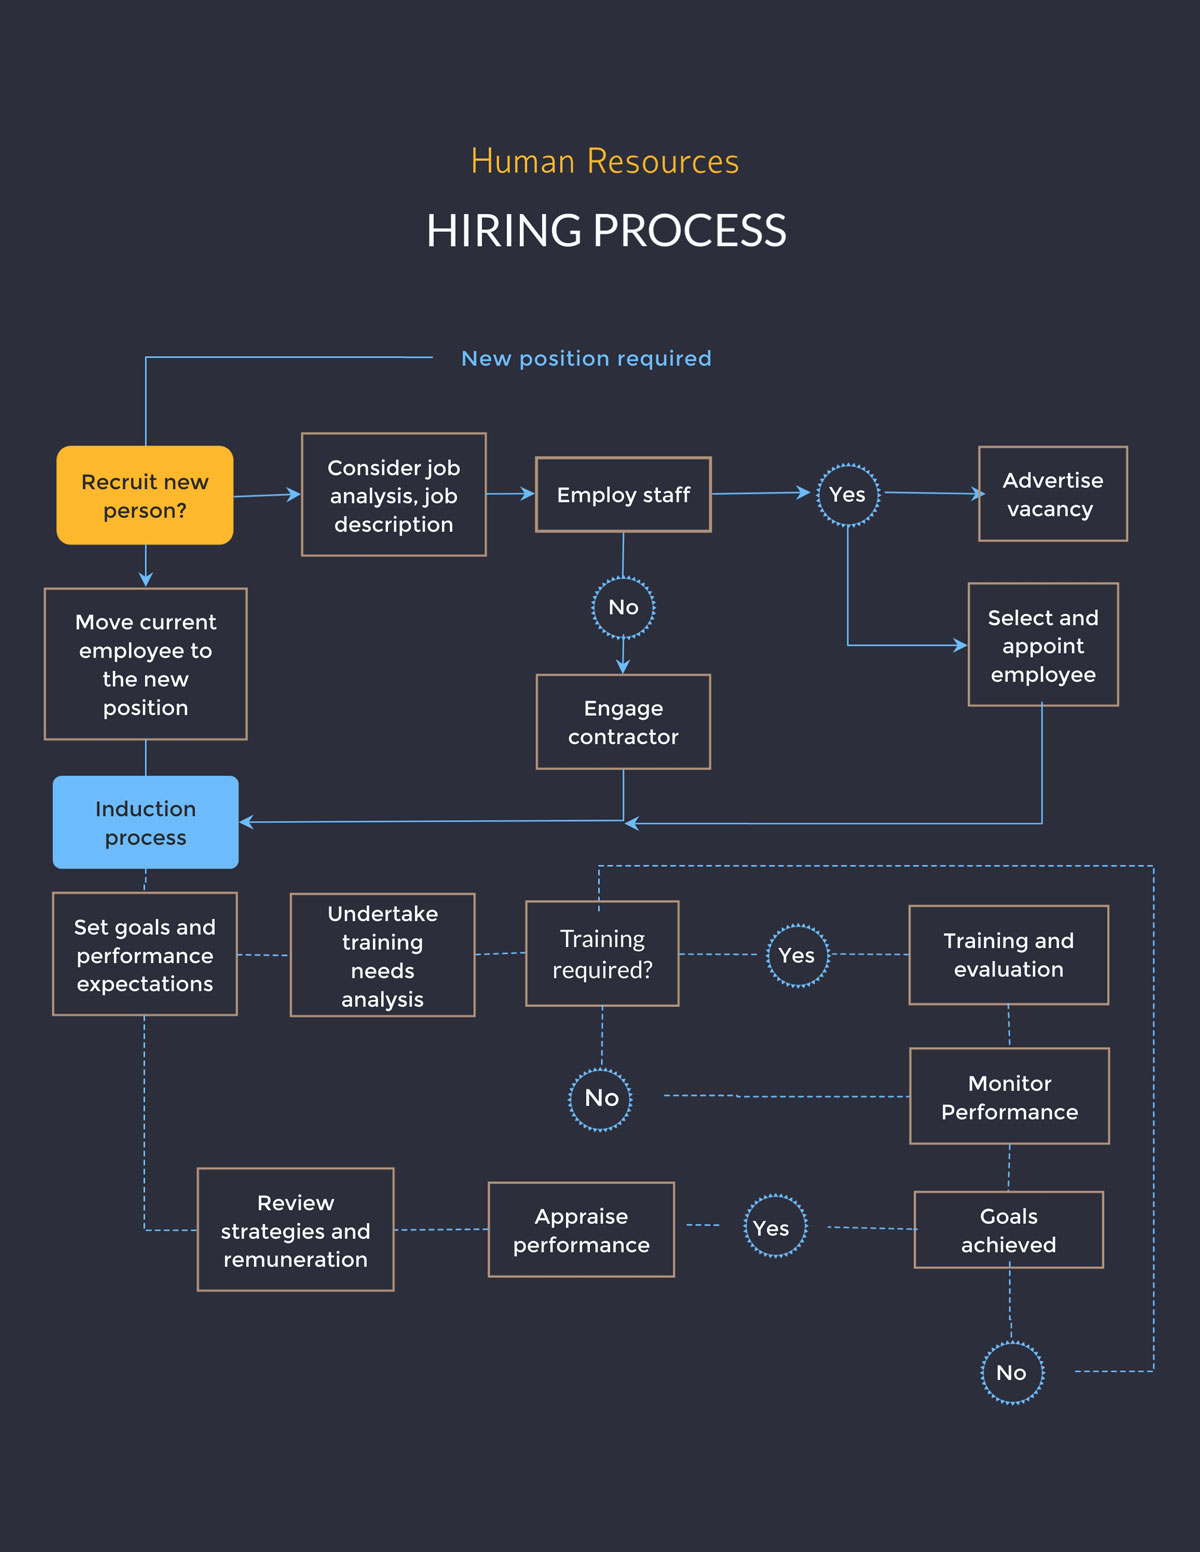
This hiring process flowchart is an asset for your human resources team and makes it easier to understand the entire recruiting process.
Feel free to customize this template according to your unique needs. For example, you may want to use it to visualize a production process or another HR process. Also, you can seamlessly create a process map to represent and improve any procedure visually.

This website rebranding flowchart can help you make decisions faster by mapping out the various factors that go into making a particular decision.
You can customize this template for any other use, such as for helping sales reps make better decisions, and even change the design so it’s more in line with your company’s branding.

This fun flowchart template is attractive and functional. You can use it to visualize decision-making for your business or personal use.
Modify this template for your own use by editing the colors, text, shapes, background and more. Download it in high-quality image or PDF format to use on its own or add to other projects, or share online using a link or embed code.
Take your flowchart to the next level with Visme's dynamic text animation features. With a selection of eight different animation styles, you can bring your flowchart to life and captivate your audience's attention.
By strategically applying text animations to key elements or labels within your flowchart, you can effectively highlight important information, guide the viewer's focus, and improve your flowchart's overall quality and impact.

Use this flowchart template to help your employees or customers solve technology problems, such as a slow server or an unresponsive application.
This is a great flowchart idea to place on your website's help page, and then if it doesn't solve the problem, users can get in touch for additional support.
The user-friendly editing tools in Visme are the best way to make a flowchart that aligns with your brand. You can shorten or extend it to fit your diagramming needs.

Explain the basics of circuits better with this block diagram template. You can also use it as a data flow diagram for any other purpose.
The best thing about this template is you can make changes in the text, colors and design easily. Download it once you’re done and add it to other projects like reports.
And if you're looking to create detailed reports, Visme can assist you with that. With Visme's AI report writer, you can streamline the report creation process. It helps you generate first drafts that you can further customize with your own colors, text and branding and ensure a professional look that suits your project's needs.

This how-to flowchart can help you explain the process of completing a task quickly and easily based on Yes or No decisions.
This particular template focuses on setting up social media channels, but you can modify it for any other topic, field or industry.
Use Visme's powerful analytics feature to track the performance of your flowchart and gain valuable insights into how users engage with the content. You will get access to the number of views, average time spent, unique visits, date/time of view, visitor IP, visitor location and more.
Utilize this information to evaluate user interactions, pinpoint areas that need improvement, and make informed decisions to enhance the efficiency of your flowcharts.

This bright and engaging flowchart template is all about planning a successful product launch day or event. It’s a great tool for keeping all the team members on the same page so everyone knows what to do and when.
You can keep this small business flowchart as is or modify everything — from the topic to text to colors to shapes and more.
In addition to the flowcharts, you can use decision trees for easy and logical decision making. Explore this comprehensive guide to learn more and get free decision tree templates.
The best flowchart maker under the Microsoft 365 umbrella is Visio. With Visio, you can create flowcharts easily with a drag-and-drop editor designed for fast diagram creation.
The easiest way to create a flowchart is with Visme. Select one of the professionally designed templates and customize it to suit your needs. You’ll have a finished flowchart in minutes, not hours.
This is how you create a flowchart in PowerPoint:
This is how you make a flowchart in Google Docs:
Now that you’re all prepped to create a flowchart and know the common symbols, it’s time to make your own.
Thankfully, making a flowchart is an easy process when you have Visme by your side.
Visme’s flowchart maker is a great alternative to Word, especially for beginners who want to create flowcharts quickly with minimum effort. Due to its ease of use and functionality, it is also an excellent Visio alternative.
Another benefit of using Visme is that you get access to professionally designed flowchart templates that are a treat to the eyes. Plus, templates for any business case you can imagine.
So, what are you waiting for? Sign up for Visme and start creating your flowchart today!
Design visual brand experiences for your business whether you are a seasoned designer or a total novice.
Try Visme for free


