Volume Order Blocks [BigBeluga]Volume Order Blocks is a powerful indicator that identifies significant order blocks based on price structure, helping traders spot key supply and demand zones. The tool leverages EMA crossovers to determine the formation of bullish and bearish order blocks while visualizing their associated volume and relative strength.
🔵 Key Features:
Order Block Detection via EMA Crossovers:
Plots bullish order blocks at recent lows when the short EMA crosses above the long EMA.
Plots bearish order blocks at recent highs when the short EMA crosses below the long EMA.
Uses customizable sensitivity through the “Sensitivity Detection” setting to fine-tune block formation.
Volume Collection and Visualization:
Calculates the total volume between the EMA crossover bar and the corresponding high (bearish OB) or low (bullish OB).
Displays the absolute volume amount next to each order block for clear volume insights.
Percentage Volume Distribution:
Shows the percentage distribution of volume among bullish or bearish order blocks.
100% represents the cumulative volume of all OBs in the same category (bullish or bearish).
Order Block Removal Conditions:
Bullish order blocks are removed when the price closes below the bottom of the block.
Bearish order blocks are removed when the price closes above the top of the block.
Helps maintain chart clarity by only displaying relevant and active levels.
Midline Feature:
Dashed midline inside each order block indicates the midpoint between the upper and lower boundaries.
Traders can toggle the midline on or off through the settings.
Shadow Trend:
Shadow Trend dynamically visualizes trend strength and direction by adapting its color intensity based on price movement.
🔵 Usage:
Supply & Demand Zones: Use bullish and bearish order blocks to identify key market reversal or continuation points.
Volume Strength Analysis: Compare volume percentages to gauge which order blocks hold stronger market significance.
Breakout Confirmation: Monitor block removal conditions for potential breakout signals beyond support or resistance zones.
Trend Reversals: Combine EMA crossovers with order block formation for early trend reversal detection.
Risk Management: Use OB boundaries as potential stop-loss or entry points.
Volume Order Blocks is an essential tool for traders seeking to incorporate volume-based supply and demand analysis into their trading strategy. By combining price action, volume data, and EMA crossovers, it offers a comprehensive view of market structure and potential turning points.
Chỉ báo và chiến lược

Trend Catcher SwiftEdgeTrend Catcher SwiftEdge
Overview
The Trend Catcher SwiftEdge is a simple yet effective tool designed to help traders identify potential trend directions using two Simple Moving Averages (SMAs). It plots two SMAs based on the high and low prices of the chart, visually highlights trend conditions, and provides buy/sell labels to assist with trade entries. This indicator is best used as part of a broader trading strategy and should not be relied upon as a standalone signal generator.
How It Works
Two SMAs: The indicator calculates two SMAs: one based on the lowest price (Low) and one based on the highest price (High) over a user-defined period (default: 20).
Dynamic Colors:
Green: When the price is above both SMAs (indicating a potential uptrend).
Red: When the price is below both SMAs (indicating a potential downtrend).
Purple: When the price is between the SMAs (indicating consolidation).
The SMAs and the background between them change color dynamically to reflect the current trend condition.
Buy/Sell Labels:
A "Buy" label appears when an entire candlestick (including its low) crosses above both SMAs, marking the start of a potential uptrend.
A "Sell" label appears when an entire candlestick (including its high) crosses below both SMAs, marking the start of a potential downtrend.
To reduce noise, only one label is shown per trend direction. The indicator resets when the price enters the consolidation zone (purple), allowing for a new signal when the next trend begins.
Settings
SMA Length: Adjust the period of the SMAs (default: 20). A longer period smooths the SMAs and focuses on larger trends, while a shorter period makes the indicator more sensitive to price changes.
How to Use
Add the indicator to your chart.
Look for "Buy" labels to consider potential long entries during uptrends (green zone).
Look for "Sell" labels to consider potential short entries during downtrends (red zone).
Use the purple consolidation zone to prepare for potential breakouts.
Always combine this indicator with other forms of analysis (e.g., support/resistance, volume, or other indicators) to confirm signals.
Important Notes
This indicator is a tool to assist with identifying trend directions and potential entry points. It does not guarantee profits and should be used as part of a comprehensive trading strategy.
False signals can occur, especially in choppy or ranging markets. Consider using additional filters or confirmations to improve reliability.
Backtest the indicator on your chosen market and timeframe to understand its behavior before using it in live trading.
Feedback
If you have suggestions or feedback, feel free to leave a comment. Happy trading!

Rev & Line - CoffeeKillerRev & Line - CoffeeKiller Indicator Guide
🔔 Warning: This Indicator Repaints 🔔 This indicator uses real-time calculations that may change based on future price action. As a result, signals (such as arrows, lines, or color changes) **can and will repaint** — meaning they may appear, disappear, or shift after a candle closes.
**Do not rely on this tool alone for live trading decisions.** Use with caution and always confirm with non-repainting tools or additional analysis.(This indicator is designed to show me the full length of the trend and because of this there can be a smaller movement inside of the trend movement)
Welcome traders! This guide will walk you through the Rev & Line indicator, a sophisticated technical analysis tool developed by CoffeeKiller that combines multiple methodologies to identify market pivots, trends, and potential reversal points.
Core Components
1. ZigZag Analysis
- Dynamic pivot detection using ATR (Average True Range)
- Customizable sensitivity through ATR Reversal Factor
- Color-coded trend lines (green for upward, red for downward)
- Optional vertical lines at pivot points
- Real-time pivot point analysis
2. Donchian Channel Integration
- Traditional upper, lower, and middle bands
- Customizable length and displacement
- Channel-based entry signals
- Dynamic market structure visualization
3. Marker Lines System
- Dynamic support/resistance level tracking
- Pivot-based reset mechanism
- Optional fill zones between markers
- Percentage position tracking within range
4. Signal Generation System
- Confluence between ZigZag pivots and Donchian channels
- Up/down arrow visualization
- Alert system
Main Features
ZigZag Settings
- ATR Reversal Factor: Controls pivot sensitivity (default 3.2)
- Customizable line appearance:
Width control (default: 3)
Color selection (green for uptrend, red for downtrend)
Vertical line options at pivot points
Maximum vertical lines display limit
- Hide repainted option for more reliable signals
Donchian Channel Configuration
- Optional channel visibility toggle
- Length parameter for lookback period (default: 20)
- Displace option for time offset
- Bubble offset for visual placement
Marker Lines System
- High/low/middle marker lines with step-line visualization
- Dotted line projections for future reference
- Pivot-based reset mechanism
- Color-coded percentage position display
Signal Generation
- Triangle markers for signals
- Combined ZigZag and Donchian confluence
- Alert system for notifications
Visual Elements
1. Pivot Lines
- Green: Upward price movements
- Red: Downward price movements
- Customizable line width
- Optional vertical pivot markers with style options:
Solid lines for confirmed pivots
Dashed lines for older pivots
Dotted lines for most recent pivots
2. Donchian Channels
- Upper band (red): Resistance level
- Lower band (green): Support level
- Middle band (yellow): Median price line
- Customizable display options
3. Marker Lines
- High marker line (magenta): Tracks highest open price
- Low marker line (cyan): Tracks lowest open price
- Middle marker line (blue): 50% level between high/low
- Dotted line extensions for future price projections
4. Position Tracking
- Percentage position display within marker range
- Real-time calculations from 0% to 100%
- Label system for visual reference
Trading Applications
1. Trend Following
- Enter on confirmed ZigZag pivot points
- Use Donchian channel boundaries as targets
- Trail stops using marker lines
- Monitor for confluence between systems
2. Counter-Trend Trading
- Trade bounces from marker lines
- Use pivot confirmation for entry timing
- Set stops based on recent pivot points
- Target the opposite marker line
3. Range Trading
- Use high/low marker lines to define range
- Trade bounces between upper and lower markers
- Consider middle marker for range midpoint
- Monitor percentage position within range
4. Breakout Trading
- Enter on breaks above/below marker lines
- Confirm with Donchian channel breakouts
- Use ZigZag pivot confirmations
- Wait for arrow signals for additional confirmation
Optimization Guide
1. ZigZag Parameters
- Higher ATR Factor: Less sensitive, major moves only
- Lower ATR Factor: More sensitive, catches minor moves
- Adjust line width for chart visibility
- Balance vertical line count for clarity
2. Donchian Channel Settings
- Longer length: Smoother channels, fewer false signals
- Shorter length: More responsive, but potentially noisier
- Displacement: Offset for historical reference
- Consider timeframe when setting parameters
3. Marker Line Configuration
- Enable/disable based on trading style
- Toggle middle line for additional reference
- Adjust colors for visual clarity
- Enable/disable labels as needed
4. Signal Generation
- Use "Hide repainted" option for more reliable signals
- Combine ZigZag and Donchian signals for confirmation
- Set alerts based on confirmed pivot points
- Balance sensitivity with reliability
Best Practices
1. Signal Confirmation
- Wait for confirmed pivot points
- Check for Donchian channel interactions
- Confirm with price action
- Look for arrow signals at pivot points
2. Risk Management
- Use recent pivot points for stop placement
- Consider marker line boundaries for targets
- Don't trade against strong trends
- Wait for clear confluence between systems
3. Setup Optimization
- Start with default settings
- Adjust based on timeframe
- Fine-tune ATR sensitivity
- Match settings to trading style
Advanced Features
1. Alert System
- Customizable arrow alerts
- Pivot point notifications
- Text message alerts with ticker information
- Once-per-bar frequency option
2. Pivot Detection Logic
The indicator uses a sophisticated state-based approach to detect pivots:
- State transitions between "uptrend," "downtrend," and "undefined"
- ATR-based reversal detection
- Minimum movement threshold for pivot confirmation
- Historical pivot tracking and labeling
3. Marker Line Reset Mechanism
- Marker lines reset based on pivot detection
- Dynamic support/resistance level adjustment
- Percentage position calculation within range
- Automatic updates as market structure changes
Remember:
- Combine multiple confirmation signals
- Use appropriate timeframe settings
- Monitor both ZigZag and Marker signals
- Pay attention to Donchian channel interactions
- Consider market volatility when trading
This indicator works best when:
- Used with proper risk management
- Combined with other technical tools
- Applied to appropriate timeframes
- Signals are confirmed by price action
**DISCLAIMER**: This indicator and its signals are intended solely for educational and informational purposes. They do not constitute financial advice. Trading involves significant risk of loss. Always conduct your own analysis and consult with financial professionals before making trading decisions.


Trapped Traders Order BlocksHow It Works
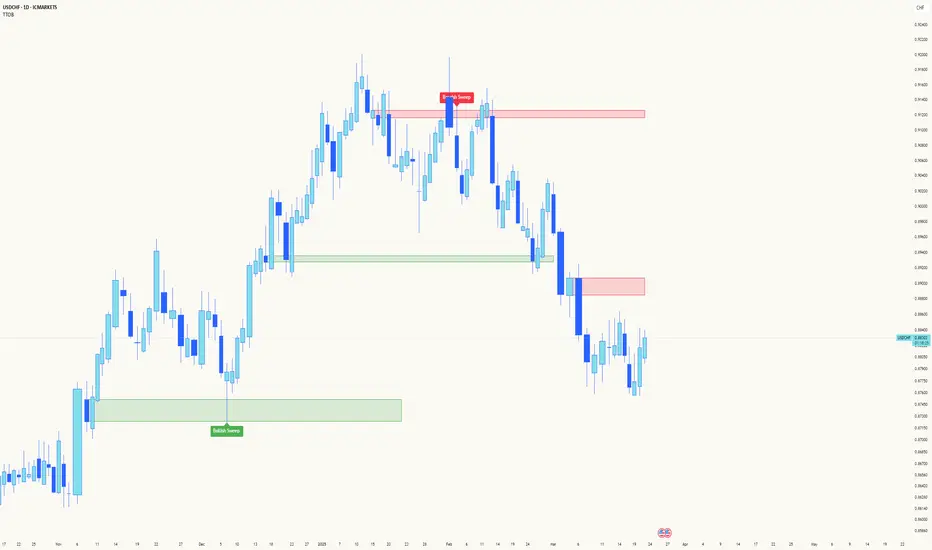
The Trapped Traders Order Blocks indicator identifies specific price action patterns that suggest large market participants ("big money") have been trapped in losing positions after significant price sweeps, creating potential opportunities for reversals. The indicator detects both "bullish trap blocks" (where bearish traders are trapped) and "bearish trap blocks" (where bullish traders are trapped). Here’s the step-by-step process for each:
Bullish Trap Block (Bears Trapped):
A bearish candle (Candle A) must sweep the high of the previous candle (Candle B), meaning its high exceeds the high of the prior candle.
This bearish candle must have a longer upper wick than its lower wick, indicating rejection of higher prices.
The candle must not be a doji (i.e., it must have a significant body, defined as the body being at least 10% of the candle's range).
The next candle (Candle C) must close above the body of the bearish candle (Candle A), suggesting that price has immediately moved against the bearish sweep, potentially trapping bearish traders who entered short positions expecting a downward move.
The body of the bearish candle (Candle A) is marked as a "bullish trap block." A box is drawn around this candle's body, and a label ("Bullish Trap") is placed below it.
Bearish Trap Block (Bulls Trapped):
A bullish candle (Candle A) must sweep the low of the previous candle (Candle B), meaning its low is below the low of the prior candle.
This bullish candle must have a longer lower wick than its upper wick, indicating rejection of lower prices.
The candle must not be a doji.
The next candle (Candle C) must close below the body of the bullish candle (Candle A), suggesting that price has immediately moved against the bullish sweep, potentially trapping bullish traders who entered long positions expecting an upward move.
The body of the bullish candle (Candle A) is marked as a "bearish trap block." A box is drawn around this candle's body, and a label ("Bearish Trap") is placed above it.
Dynamic Box Extension:
For both bullish and bearish trap blocks, the box extends dynamically to the current bar unless it exceeds a user-defined age (default is 52 bars), at which point it stops at the maximum age.
Sweep Detection:
Bullish Sweep (of any trap block, bullish or bearish):
The current candle's open is above the top of the box.
The low is below the top of the box.
The close is above the top of the box.
The lower wick is longer than the upper wick (indicating rejection of lower prices).
The close is above 50% of the candle's range (ensuring a strong bullish bias).
When a bullish sweep occurs, a label ("Bullish Sweep") is placed at the low of the candle, pointing upward, and an alert is triggered.
Bearish Sweep (of any trap block, bullish or bearish):
The current candle's open is below the bottom of the box.
The high is above the bottom of the box.
The close is below the bottom of the box.
The upper wick is longer than the lower wick (indicating rejection of higher prices).
The close is below 50% of the candle's range (ensuring a strong bearish bias).
When a bearish sweep occurs, a label ("Bearish Sweep") is placed at the high of the candle, pointing downward, and an alert is triggered.
When to Be Used
The Trapped Traders Order Blocks indicator is best used in the following scenarios:
Reversal Trading:
Use this indicator to identify potential reversal points in the market. Bullish trap blocks suggest that trapped bears may unwind their short positions, leading to a potential bullish move. Bearish trap blocks suggest that trapped bulls may unwind their long positions, leading to a potential bearish move.
Look for sweeps of these blocks as confirmation of a directional move. A bullish sweep indicates a potential upward move, while a bearish sweep indicates a potential downward move.
Range-Bound Markets:
In sideways or ranging markets, trapped blocks can highlight key levels where large players have been caught off-guard. These levels often act as support or resistance, and a sweep of the block can signal a breakout or continuation in the direction of the sweep.
Confluence with Other Indicators:
Combine the trapped blocks with other technical analysis tools, such as support/resistance levels, Fibonacci retracements, or volume analysis, to increase the probability of a successful trade. For example, a bullish trap block near a strong support level with a bullish sweep can provide a high-probability setup for a long position, while a bearish trap block near a strong resistance level with a bearish sweep can signal a short opportunity.
Timeframes:
The indicator is most effective on higher timeframes such as 1-day (1D), 1-week (1W), and 1-month (1M) charts. These timeframes are more likely to capture significant moves involving large market participants, reducing noise and false signals compared to lower timeframes. While it can be used on lower timeframes (e.g., 1-hour or 4-hour), the signals may be less reliable due to increased market noise.
Logic Behind It
The logic behind the Trapped Traders Order Blocks indicator is rooted in market psychology and the behavior of large market participants ("big money"). When a large sweep candle occurs where price spikes in one direction but then quickly reverses it often indicates that traders have entered positions in the direction of the sweep, expecting a continuation. However, if the price immediately moves against them, these traders are now trapped in losing positions.
Bullish Trap Block (Bears Trapped):
A large bearish sweep candle (spiking upward but closing lower) suggests that bearish traders (bears) have entered short positions at the top of the move, expecting a downward continuation. If the next candle closes above the bearish candle's body, these bears are trapped in losing positions.
The body of the bearish candle becomes a "bullish trap block" because the trapped bears are likely to have placed their stop-loss orders or break-even exit orders just above the high of the sweep candle or within the body of the candle. As price revisits this level in the future, these trapped traders may attempt to unwind their positions by buying back their shorts, which can drive the price higher. This unwinding process often attracts new buyers, leading to a potential bullish reversal or continuation.
The bullish sweep conditions (e.g., close > box top, longer lower wick, and close above 50% of the range) ensure that the price action at the block level shows strong bullish momentum and rejection of lower prices, confirming the potential for a move higher.
Bearish Trap Block (Bulls Trapped):
A large bullish sweep candle (spiking downward but closing higher) suggests that bullish traders (bulls) have entered long positions at the bottom of the move, expecting an upward continuation. If the next candle closes below the bullish candle's body, these bulls are trapped in losing positions.
The body of the bullish candle becomes a "bearish trap block" because the trapped bulls are likely to have placed their stop-loss orders or break-even exit orders just below the low of the sweep candle or within the body of the candle. As price revisits this level in the future, these trapped traders may attempt to unwind their positions by selling their longs, which can drive the price lower. This unwinding process often attracts new sellers, leading to a potential bearish reversal or continuation.
The bearish sweep conditions (e.g., close < box bottom, longer upper wick, and close below 50% of the range) ensure that the price action at the block level shows strong bearish momentum and rejection of higher prices, confirming the potential for a move lower.
Summary
Bullish Trap Block: Occurs when bears get trapped after a bearish sweep candle is immediately followed by a bullish candle, indicating a potential reversal as trapped bears may unwind their positions.
Bearish Trap Block: Occurs when bulls get trapped after a bullish sweep candle is immediately followed by a bearish candle, indicating a potential bearish reversal.
Use Case: Ideal for identifying reversal opportunities, especially in range-bound markets or at key support/resistance levels on higher timeframes like 1D, 1W, and 1M, and can be combined with other indicators for confluence.
Logic: Large sweep candles followed by an immediate reversal suggest that big money has been trapped, and these traders may unwind their positions at break-even in the near future, driving price in the opposite direction of their initial trade.
This indicator provides a visual and actionable way to identify these trapped trader scenarios, with customizable settings for box display, sweep visuals, and alerts to help traders capitalize on these opportunities, particularly on higher timeframes where the signals are most reliable.
Ralli Başlatan Bollinger BantlarıEN:
It displays the Bollinger Bands mentioned by Adem Ayan on X.
x.com/ademayan66/status/1901706968508637483
---
TR:
Adem Ayan'ın X'te bahsettiği bollinger bantlarının gösterimini yapar.
x.com/ademayan66/status/1901706968508637483

ULTIMATIVES BEAST (LSTM + XGBoost + GARCH + Trend & Momentum)
🧠 THE BEAST – Autonomous Multi-Layer AI for Real-Time Trade Decisions
🔓 Unleash THE BEAST.
This is not an indicator.
This is an autonomous trading intelligence system – built to make decisions like a professional trader, but without emotion, hesitation, or fatigue.
THE BEAST is aware of its environment.
It doesn’t just calculate signals – it understands setups. It questions momentum. It evaluates risk. It adapts its aggression. It even warns you when it’s unsure.
💡 Think of BEAST as your own embedded AI analyst, running 24/7, evaluating every candle, every pattern, and every micro-shift in the market landscape.
🧠 What makes BEAST unique?
✅ Multi-layer AI Architecture:
CNN + LSTM + Wavelet Analysis + Volatility Clustering + GCN Correlation + Confidence Evaluation + Adaptive Threshold Logic.
This is not scripted logic – this is algorithmic intelligence.
✅ It Thinks Like a Trader:
It combines technical pattern structure with contextual awareness (volatility, trend health, risk/reward alignment).
It filters noise. It ignores setups when the risk outweighs the opportunity.
✅ It Doubts Itself – On Purpose:
BEAST monitors its own confidence in real time.
If it triggers a trade despite missing ideal alignment – it tells you directly:
⚠️ “Entry despite internal hesitation.”
✅ Dynamic Risk Logic:
The system tracks trend clusters, adjusts SuperTrend, evaluates ADX momentum, and even tightens or loosens EntryThresholds based on market strength.
✅ Live Diagnostics Table:
You see everything – confidence %, setup state, entry score, mismatch status, and more.
Nothing is hidden. BEAST explains its every move.
✅ Confirmed Entries Only:
With barstate.isconfirmed, BEAST acts only on closed candles – avoiding flickers or false alerts.
✅ Intelligent Silence:
BEAST doesn’t trigger just because conditions are “close.”
It waits. It stalks. It strikes when conviction crosses the line.
🧪 Core Engine Components:
🧠 LSTM Pattern Layer – for historical structure learning
🎯 CNN Short-Term Classifier – to detect directional micro-setups
🌊 Wavelet Signal Forecast – to confirm or reject entry timing
🔗 GCN Correlation Check – detects inter-market alignment
⚖️ Confidence Score + Entry Mismatch Logic – tells you if BEAST truly believes
📊 Dynamic Entry Thresholds – based on ADX & volatility regimes
🚀 SuperTrend with Adaptive ATR – adjusts based on risk zone
🔍 Setup Status: READY | WAITING | NEUTRAL – full signal context at a glance
⚠️ Mismatch Warning System – when BEAST enters against its own internal logic
📈 How to Use BEAST:
Apply it to any 1H chart (crypto, stocks, FX, indices)
Choose a correlated market for GCN (e.g., COINBASE:BTCUSD)
Monitor the table – trust only ✅ READY entries (unless you trade with beast-like instinct)
Use the Entry Mismatch Warning to gauge grey-zone trades
Let BEAST observe, wait, and strike for you
Don’t trade harder. Trade smarter – with the beast by your side
🔥 Final Words:
“BEAST doesn’t chase markets. It stalks them.”
It doesn’t react emotionally.
It doesn’t repaint.
It doesn’t guess.
It thinks. It doubts. It adapts. It acts.

Smart Liquidity Wave [The_lurker]"Smart Liquidity Wave" هو مؤشر تحليلي متطور يهدف لتحديد نقاط الدخول والخروج المثلى بناءً على تحليل السيولة، قوة الاتجاه، وإشارات السوق المفلترة. يتميز المؤشر بقدرته على تصنيف الأدوات المالية إلى أربع فئات سيولة (ضعيفة، متوسطة، عالية، عالية جدًا)، مع تطبيق شروط مخصصة لكل فئة تعتمد على تحليل الموجات السعرية، الفلاتر المتعددة، ومؤشر ADX.
فكرة المؤشر
الفكرة الأساسية هي الجمع بين قياس السيولة اليومية الثابتة وتحليل ديناميكي للسعر باستخدام فلاتر متقدمة لتوليد إشارات دقيقة. المؤشر يركز على تصفية الضوضاء في السوق من خلال طبقات متعددة من التحليل، مما يجعله أداة ذكية تتكيف مع الأدوات المالية المختلفة بناءً على مستوى سيولتها.
طريقة عمل المؤشر
1- قياس السيولة:
يتم حساب السيولة باستخدام متوسط حجم التداول على مدى 14 يومًا مضروبًا في سعر الإغلاق، ويتم ذلك دائمًا على الإطار الزمني اليومي لضمان ثبات القيمة بغض النظر عن الإطار الزمني المستخدم في الرسم البياني.
يتم تصنيف السيولة إلى:
ضعيفة: أقل من 5 ملايين (قابل للتعديل).
متوسطة: من 5 إلى 20 مليون.
عالية: من 20 إلى 50 مليون.
عالية جدًا: أكثر من 50 مليون.
هذا الثبات في القياس يضمن أن تصنيف السيولة لا يتغير مع تغير الإطار الزمني، مما يوفر أساسًا موثوقًا للإشارات.
2- تحليل الموجات السعرية:
يعتمد المؤشر على تحليل الموجات باستخدام متوسطات متحركة متعددة الأنواع (مثل SMA، EMA، WMA، HMA، وغيرها) يمكن للمستخدم اختيارها وتخصيص فتراتها ، يتم دمج هذا التحليل مع مؤشرات إضافية مثل RSI (مؤشر القوة النسبية) وMFI (مؤشر تدفق الأموال) بوزن محدد (40% للموجات، 30% لكل من RSI وMFI) للحصول على تقييم شامل للاتجاه.
3- الفلاتر وطريقة عملها:
المؤشر يستخدم نظام فلاتر متعدد الطبقات لتصفية الإشارات وتقليل الضوضاء، وهي من أبرز الجوانب المخفية التي تعزز دقته:
الفلتر الرئيسي (Main Filter):
يعمل على تنعيم التغيرات السعرية السريعة باستخدام معادلة رياضية تعتمد على تحليل الإشارات (Signal Processing).
يتم تطبيقه على السعر لاستخراج الاتجاهات الأساسية بعيدًا عن التقلبات العشوائية، مع فترة زمنية قابلة للتعديل (افتراضي: 30).
يستخدم تقنية مشابهة للفلاتر عالية التردد (High-Pass Filter) للتركيز على الحركات الكبيرة.
الفلتر الفرعي (Sub Filter):
يعمل كطبقة ثانية للتصفية، مع فترة أقصر (افتراضي: 12)، لضبط الإشارات بدقة أكبر.
يستخدم معادلات تعتمد على الترددات المنخفضة للتأكد من أن الإشارات الناتجة تعكس تغيرات حقيقية وليست مجرد ضوضاء.
إشارة الزناد (Signal Trigger):
يتم تطبيق متوسط متحرك على نتائج الفلتر الرئيسي لتوليد خط إشارة (Signal Line) يُقارن مع عتبات محددة للدخول والخروج.
يمكن تعديل فترة الزناد (افتراضي: 3 للدخول، 5 للخروج) لتسريع أو تبطيء الإشارات.
الفلتر المربع (Square Filter):
خاصية مخفية تُفعّل افتراضيًا تعزز دقة الفلاتر عن طريق تضييق نطاق التذبذبات المسموح بها، مما يقلل من الإشارات العشوائية في الأسواق المتقلبة.
4- تصفية الإشارات باستخدام ADX:
يتم استخدام مؤشر ADX كفلتر نهائي للتأكد من قوة الاتجاه قبل إصدار الإشارة:
ضعيفة ومتوسطة: دخول عندما يكون ADX فوق 40، خروج فوق 50.
عالية: دخول فوق 40، خروج فوق 55.
عالية جدًا: دخول فوق 35، خروج فوق 38.
هذه العتبات قابلة للتعديل، مما يسمح بتكييف المؤشر مع استراتيجيات مختلفة.
5- توليد الإشارات:
الدخول: يتم إصدار إشارة شراء عندما تنخفض خطوط الإشارة إلى ما دون عتبة محددة (مثل -9) مع تحقق شروط الفلاتر، السيولة، وADX.
الخروج: يتم إصدار إشارة بيع عندما ترتفع الخطوط فوق عتبة (مثل 109 أو 106 حسب الفئة) مع تحقق الشروط الأخرى.
تُعرض الإشارات بألوان مميزة (أزرق للدخول، برتقالي للضعيفة والمتوسطة، أحمر للعالية والعالية جدًا) وبثلاثة أحجام (صغير، متوسط، كبير).
6- عرض النتائج:
يظهر مستوى السيولة الحالي في جدول في أعلى يمين الرسم البياني، مما يتيح للمستخدم معرفة فئة الأصل بسهولة.
7- دعم التنبيهات:
تنبيهات فورية لكل فئة سيولة، مما يسهل التداول الآلي أو اليدوي.
%%%%% الجوانب المخفية في الكود %%%%%
معادلات الفلاتر المتقدمة: يستخدم المؤشر معادلات رياضية معقدة مستوحاة من معالجة الإشارات لتنعيم البيانات واستخراج الاتجاهات، مما يجعله أكثر دقة من المؤشرات التقليدية.
التكيف التلقائي: النظام يضبط نفسه داخليًا بناءً على التغيرات في السعر والحجم، مع عوامل تصحيح مخفية (مثل معامل التنعيم في الفلاتر) للحفاظ على الاستقرار.
التوزيع الموزون: الدمج بين الموجات، RSI، وMFI يتم بأوزان محددة (40%، 30%، 30%) لضمان توازن التحليل، وهي تفاصيل غير ظاهرة مباشرة للمستخدم لكنها تؤثر على النتائج.
الفلتر المربع: خيار مخفي يتم تفعيله افتراضيًا لتضييق نطاق الإشارات، مما يقلل من التشتت في الأسواق ذات التقلبات العالية.
مميزات المؤشر
1- فلاتر متعددة الطبقات: تضمن تصفية الضوضاء وإنتاج إشارات موثوقة فقط.
2- ثبات السيولة: قياس السيولة اليومي يجعل التصنيف متسقًا عبر الإطارات الزمنية.
3- تخصيص شامل: يمكن تعديل حدود السيولة، عتبات ADX، فترات الفلاتر، وأنواع المتوسطات المتحركة.
4- إشارات مرئية واضحة: تصميم بصري يسهل التفسير مع تنبيهات فورية.
5- تقليل الإشارات الخاطئة: الجمع بين الفلاتر وADX يعزز الدقة ويقلل من التشتت.
إخلاء المسؤولية
لا يُقصد بالمعلومات والمنشورات أن تكون، أو تشكل، أي نصيحة مالية أو استثمارية أو تجارية أو أنواع أخرى من النصائح أو التوصيات المقدمة أو المعتمدة من TradingView.
#### **What is the Smart Liquidity Wave Indicator?**
"Smart Liquidity Wave" is an advanced analytical indicator designed to identify optimal entry and exit points based on liquidity analysis, trend strength, and filtered market signals. It stands out with its ability to categorize financial instruments into four liquidity levels (Weak, Medium, High, Very High), applying customized conditions for each category based on price wave analysis, multi-layered filters, and the ADX (Average Directional Index).
#### **Concept of the Indicator**
The core idea is to combine a stable daily liquidity measurement with dynamic price analysis using sophisticated filters to generate precise signals. The indicator focuses on eliminating market noise through multiple analytical layers, making it an intelligent tool that adapts to various financial instruments based on their liquidity levels.
#### **How the Indicator Works**
1. **Liquidity Measurement:**
- Liquidity is calculated using the 14-day average trading volume multiplied by the closing price, always based on the daily timeframe to ensure value consistency regardless of the chart’s timeframe.
- Liquidity is classified as:
- **Weak:** Less than 5 million (adjustable).
- **Medium:** 5 to 20 million.
- **High:** 20 to 50 million.
- **Very High:** Over 50 million.
- This consistency in measurement ensures that liquidity classification remains unchanged across different timeframes, providing a reliable foundation for signals.
2. **Price Wave Analysis:**
- The indicator relies on wave analysis using various types of moving averages (e.g., SMA, EMA, WMA, HMA, etc.), which users can select and customize in terms of periods.
- This analysis is integrated with additional indicators like RSI (Relative Strength Index) and MFI (Money Flow Index), weighted specifically (40% waves, 30% RSI, 30% MFI) to provide a comprehensive trend assessment.
3. **Filters and Their Functionality:**
- The indicator employs a multi-layered filtering system to refine signals and reduce noise, a key hidden feature that enhances its accuracy:
- **Main Filter:**
- Smooths rapid price fluctuations using a mathematical equation rooted in signal processing techniques.
- Applied to price data to extract core trends away from random volatility, with an adjustable period (default: 30).
- Utilizes a technique similar to high-pass filters to focus on significant movements.
- **Sub Filter:**
- Acts as a secondary filtering layer with a shorter period (default: 12) for finer signal tuning.
- Employs low-frequency-based equations to ensure resulting signals reflect genuine changes rather than mere noise.
- **Signal Trigger:**
- Applies a moving average to the main filter’s output to generate a signal line, compared against predefined entry and exit thresholds.
- Trigger period is adjustable (default: 3 for entry, 5 for exit) to speed up or slow down signals.
- **Square Filter:**
- A hidden feature activated by default, enhancing filter precision by narrowing the range of permissible oscillations, reducing random signals in volatile markets.
4. **Signal Filtering with ADX:**
- ADX is used as a final filter to confirm trend strength before issuing signals:
- **Weak and Medium:** Entry when ADX exceeds 40, exit above 50.
- **High:** Entry above 40, exit above 55.
- **Very High:** Entry above 35, exit above 38.
- These thresholds are adjustable, allowing the indicator to adapt to different trading strategies.
5. **Signal Generation:**
- **Entry:** A buy signal is triggered when signal lines drop below a specific threshold (e.g., -9) and conditions for filters, liquidity, and ADX are met.
- **Exit:** A sell signal is issued when signal lines rise above a threshold (e.g., 109 or 106, depending on the category) with all conditions satisfied.
- Signals are displayed in distinct colors (blue for entry, orange for Weak/Medium, red for High/Very High) and three sizes (small, medium, large).
6. **Result Display:**
- The current liquidity level is shown in a table at the top-right of the chart, enabling users to easily identify the asset’s category.
7. **Alert Support:**
- Instant alerts are provided for each liquidity category, facilitating both automated and manual trading.
#### **Hidden Aspects in the Code**
- **Advanced Filter Equations:** The indicator uses complex mathematical formulas inspired by signal processing to smooth data and extract trends, making it more precise than traditional indicators.
- **Automatic Adaptation:** The system internally adjusts based on price and volume changes, with hidden correction factors (e.g., smoothing coefficients in filters) to maintain stability.
- **Weighted Distribution:** The integration of waves, RSI, and MFI uses fixed weights (40%, 30%, 30%) for balanced analysis, a detail not directly visible but impactful on results.
- **Square Filter:** A hidden option, enabled by default, narrows signal range to minimize dispersion in high-volatility markets.
#### **Indicator Features**
1. **Multi-Layered Filters:** Ensures noise reduction and delivers only reliable signals.
2. **Liquidity Stability:** Daily liquidity measurement keeps classification consistent across timeframes.
3. **Comprehensive Customization:** Allows adjustments to liquidity thresholds, ADX levels, filter periods, and moving average types.
4. **Clear Visual Signals:** User-friendly design with easy-to-read visuals and instant alerts.
5. **Reduced False Signals:** Combining filters and ADX enhances accuracy and minimizes clutter.
#### **Disclaimer**
The information and publications are not intended to be, nor do they constitute, financial, investment, trading, or other types of advice or recommendations provided or endorsed by TradingView.


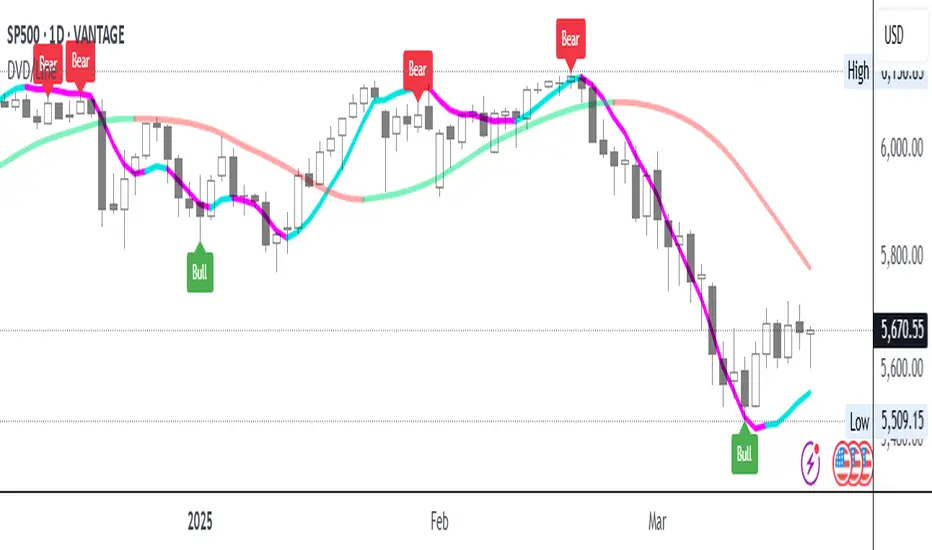
Dual Volume Divergence LineDual Volume Divergence Line (DVD/Line)
🔹 Overview
The Dual Volume Divergence Line (DVD/Line) is a custom Pine Script™ indicator designed to identify potential trend reversals and continuations by analyzing volume and price divergences. This script is inspired by the original concept of the Dual Volume Divergence Index (DVDI) by DonovanWall and has been modified and enhanced by keremertem. Special thanks to DonovanWall for the original concept. The indicator combines volume-based calculations with price action to generate signals for bullish and bearish divergences, both normal and hidden. Below is a detailed breakdown of its components and functionality.
🔹 Key Features of the DVD/Line Indicator
1. Dual Volume Divergence Calculation:
- The indicator calculates two primary volume-based indices: the Positive Volume Index (PVI) and the Negative Volume Index (NVI).
- PVI measures the impact of volume on price when the price increases, while NVI measures the impact when the price decreases.
- These indices are used to detect divergences between volume and price, which can signal potential reversals or continuations.
2. Customizable Inputs:
- DVD Sampling Period: Adjusts the sensitivity of the indicator by controlling the lookback period for calculating the volume-weighted moving averages (VWMA) of PVI and NVI.
- Band Width: Defines the range for calculating the upper and lower bands, which act as dynamic support and resistance levels.
- Source: Allows users to select the price source (e.g., `hlc3`, `close`, etc.) for calculations.
3. Volume-Weighted Moving Averages (VWMA):
- Instead of using traditional moving averages, the script employs VWMA to smooth the PVI and NVI signals. This ensures that the indicator is more responsive to changes in volume.
4. Upper and Lower Bands:
- The upper and lower bands are calculated using the Root Mean Square (RMS) of the highest and lowest values of the DVD line over a user-defined period. These bands help identify overbought and oversold conditions.
5. Divergence Detection:
- The script identifies four types of divergences:
- Normal Bullish Divergence: Occurs when price makes a lower low, but the DVD line makes a higher low.
- Hidden Bullish Divergence: Occurs when price makes a higher low, but the DVD line makes a lower low.
- Normal Bearish Divergence: Occurs when price makes a higher high, but the DVD line makes a lower high.
- Hidden Bearish Divergence: Occurs when price makes a lower high, but the DVD line makes a higher high.
- These divergences are visually highlighted on the chart using labels.
6. Customizable Divergence Selection:
- Users can choose between two types of divergence calculations:
- DVDI: Based on the raw divergence values.
- DVD Line: Based on the smoothed DVD line.
7. Visual Enhancements:
- The DVD line is plotted with a color-coded scheme: blue when the DVD line is above its signal line (bullish) and pink when it is below (bearish).
- The upper and lower bands are displayed as step lines, making it easier to identify key levels.
🔹 How the Indicator Works
1. Volume-Based Calculations:
- The script starts by calculating the PVI and NVI based on the selected price source and volume data.
- PVI increases when the price rises, while NVI decreases when the price falls. These indices are then smoothed using VWMA to generate signals.
2. DVD Line Calculation:
- The DVD line is derived by combining the divergences of PVI and NVI. It is further smoothed using a Weighted Moving Average (WMA) and a linear regression line for trend analysis.
3. Divergence Detection:
- The script identifies pivot points in the DVD line and compares them with price action to detect divergences.
- Normal divergences indicate potential reversals, while hidden divergences suggest trend continuations.
4. Dynamic Bands:
- The upper and lower bands are calculated using RMS, which provides a more accurate representation of volatility compared to standard deviation or fixed-width bands.
5. Labeling:
- Divergences are labeled directly on the chart with clear text and color coding:
🟢 Bullish Divergence: Green label with "Bull".
🟩 Bearish Divergence: Red label with "Bear".
🔴 Hidden Bullish Divergence: Lime label with "hid.".
🟧 Hidden Bearish Divergence: Orange label with "hid.".
🔹 Unique Aspects of This Script
1. Volume-Weighted Smoothing:
- Unlike traditional divergence indicators that rely on simple moving averages, this script uses VWMA and WMA to ensure that volume plays a significant role in signal generation.
2. Dynamic Bands with RMS:
- The use of RMS for calculating bands provides a more adaptive and accurate representation of market conditions, especially in volatile markets.
3. Flexible Divergence Selection:
- Users can choose between raw divergence values (DVDI) or smoothed values (DVD Line), allowing for greater customization based on trading style.
4. Comprehensive Divergence Detection:
- The script detects both normal and hidden divergences, providing a complete picture of potential trend reversals and continuations.
5. User-Friendly Visuals:
- The color-coded DVD line and cross-style bands make it easy to interpret the indicator at a glance.
🔹 How to Use the Indicator
1. Trend Identification:
- Use the Middle Band and its color to identify the current trend. A green line suggests bullish momentum, while a red line indicates bearish momentum. Additionally, a bullish momentum may be indicated when the DVD line crosses up, and a bearish momentum may be indicated when it crosses down the Middle Band.
2. Divergence Trading:
- Look for divergences between the DVD line and price action. Normal divergences can be used for counter-trend trades, while hidden divergences can confirm trend continuations.
3. Band Breakouts:
- Monitor the upper and lower bands for potential breakout or reversal signals. A break above the upper band may indicate overbought conditions, while a break below the lower band may suggest oversold conditions.
4. Customization:
- Adjust the sampling period and band width to suit different timeframes and trading strategies. Shorter periods are more sensitive, while longer periods provide smoother signals.
🔹 Conclusion
The Dual Volume Divergence Line (DVD/Line) is a powerful and versatile indicator that combines volume analysis with price action to generate actionable trading signals. Its unique use of volume-weighted smoothing, dynamic bands, and comprehensive divergence detection sets it apart from traditional divergence indicators. Whether you're a day trader or a long-term investor, this tool can help you identify high-probability trading opportunities with greater accuracy and confidence.
📌 Disclaimer: This script is for educational purposes only and does not constitute financial advice. Always conduct your own analysis before making trading decisions.
RSI-Wick Confirm SMA ProI recognized after trading reversals for two years that alerts can help you reduce screen time. Normal RSI and VIX signals are almost useless because they produce to much noise and false signals. Pro Traders always wait for the market to confirm the reversal anyway. This indicator alerts you when the market rejects with a wick (adjust your own Wick-Strength) and the VIX (Volatility) or RSI signal a reversal. You can use this indicator as entry and exit strategy or for trading a top or bottom supply and demand zone which may form. Use Lux Algo Swing Failure Pattern in conjunction with each other. In addition this indicator gives you a setup when the price is gaping/touching and crossing either the 50SMA or 200SMA. I wrote another On-Chart-Indicator using Machine Learning Momentum (giving only one Signal) for additional market sentiment confirmation. I just trade from a Laptop and try to avoid indicators below or above the chart.

Standard Deviation SMA RSI | mad_tiger_slayerOverview of the Script
The Standard Deviation SMA RSI is a custom TradingView indicator that enhances the Relative Strength Index (RSI) by incorporating a Simple Moving Average (SMA) and Standard Deviation bands . This approach smooths RSI calculations while factoring in volatility to provide clearer trend signals . Additionally, the indicator includes overbought and oversold thresholds, trend-coded RSI signals , and dynamic volatility bands for improved market analysis. This indicator is designed for swing traders and long-term investors looking to capture high-probability trend shifts.
How Do Traders Use the Standard Deviation SMA RSI?
In the provided chart image, the indicator is displayed on a price chart. Each visual component serves a distinct function in identifying trend conditions and volatility levels .
INTENDED USES
⚠️ NOT INTENDED FOR SCALPING
With the smoothing nature of the SMA-based RSI , this indicator is not designed for low-timeframe scalping. It works best on timeframes above 1-hour , with optimal performance in 12-hour, daily, and higher timeframes.
📈 TREND-FOLLOWING & MEAN REVERSION
The Standard Deviation SMA RSI functions as both a trend-following and mean-reverting indicator:
Trend-Following: Identifies strong, sustained trends using RSI signals and SMA confirmation.
Mean Reversion: Detects overbought/oversold conditions based on standard deviation bands and RSI thresholds .
A VISUAL REPRESENTATION OF INTENDED USES
RSI Line (Green/Pink/Gray): The RSI line dynamically changes color based on trend conditions .
Green RSI → Strong uptrend, RSI above the uptrend threshold.
Pink RSI → Downtrend, RSI below the downtrend threshold.
Gray RSI → Neutral state or consolidation.
If the SMA of RSI is above Long Threshold , the market is in a bullish trend.
If it’s below Short Threshold, bearish conditions prevail.
Threshold Lines (Teal/Purple):
Green Line → Long Entry Threshold
Red Line → Short Entry Threshold
Standard Deviation Bands:
Upper Band → Measures bullish volatility expansion
Lower Band → Measures bearish volatility expansion
Colored Candles: Price candles adjust color based on RSI conditions , visually aligning price action with market trends.
Indicator's Primary Elements
Input Parameters
The script includes several configurable settings, allowing users to tailor the indicator to different market environments:
RSI Length: Controls the number of periods for RSI calculations.
SMA Length: Defines the period for the SMA applied to RSI , creating a smoothed trend line.
Standard Deviation Period: Determines the length for volatility calculations.
Overbought and Oversold Levels:
Can be adjusted to customize sensitivity.
Standard Deviation SMA RSI Calculation
The SMA-based RSI smooths fluctuations while the standard deviation bands measure price volatility.
Upper and Lower Bands: Calculated by adding/subtracting standard deviation to/from the SMA-based RSI.
Trend Signal Calculation:
RSI is compared to uptrend and downtrend thresholds to determine buy/sell conditions.
Long and Short Conditions
Buy and sell conditions are determined by RSI relative to key thresholds :
Bullish Signal: RSI above long threshold & SMA confirms trend .
Bearish Signal: RSI below short threshold & SMA confirms downtrend .
Reversals: RSI entering overbought/oversold areas suggests possible trend reversals.
Conclusion
The Standard Deviation SMA RSI is a powerful trend-following and mean-reverting tool , offering enhanced insights into RSI movements, volatility, and market strength . By combining SMA smoothing, standard deviation bands, and dynamic thresholds , traders can better identify trend confirmations, reversals, and overextended conditions .
✅ Customizable settings allow traders to optimize sensitivity.
✅ Works best on high timeframes (12H, Daily, Weekly).
✅ Ideal for swing traders and long-term investors.

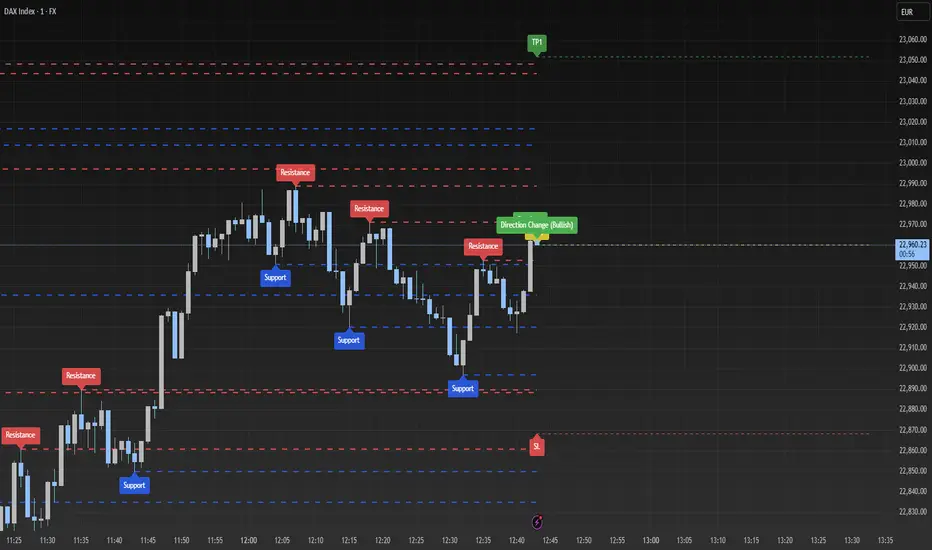
Breakout Support & Resistance SwiftEdgeBreakout Support & Resistance
The Breakout is a technical analysis tool designed to identify breakout opportunities in the market by detecting price movements through support and resistance levels. It plots potential entry points, stop-loss (SL), and take-profit (TP) levels based on user-defined percentages, helping traders visualize breakout setups on their charts.
How It Works
Support and Resistance Detection: The indicator uses pivot points to identify support and resistance levels over a user-defined lookback period.
Breakout Identification: A breakout is confirmed when the price crosses above a resistance level (bullish) or below a support level (bearish) and remains there for a specified number of bars.
Entry, SL, and TP Levels: Upon a confirmed breakout, the indicator sets an entry point at the closing price and calculates SL, TP1, and TP2 levels based on user-defined percentages.
Directional Filtering: To avoid conflicting signals, the indicator filters breakouts based on the current trade direction. A new entry in the opposite direction is only set if the price moves a user-defined percentage away from the previous entry or if the previous trade hits its SL, TP1, or TP2.
Visuals: The indicator plots support and resistance lines, breakout labels, and entry/SL/TP levels on the chart. Users can choose to display only the latest entry or up to 5 recent entries.
Features
Customizable Settings: Adjust the lookback period for pivot points, breakout confirmation bars, SL/TP percentages, and more.
Directional Change Control: A direction change is indicated when the price moves significantly in the opposite direction, helping to manage trend reversals.
Multiple Entry Display: Option to show up to 5 recent entries for tracking multiple breakouts.
Alerts: Receive alerts when a breakout is confirmed, including entry, SL, TP1, and TP2 levels.
Settings
Pivot Lookback Length: Number of bars to look back for identifying support and resistance levels (default: 5).
Breakout Confirmation Bars: Number of bars the price must stay above/below the level to confirm a breakout (default: 2).
Take Profit 1 (%): First take-profit level as a percentage above/below the entry (default: 2.0%).
Take Profit 2 (%): Second take-profit level as a percentage above/below the entry (default: 4.0%).
Stop Loss (%): Stop-loss level as a percentage below/above the entry (default: 1.0%).
Show Multiple Entries: Toggle to display up to 5 recent entries or only the latest (default: false).
Direction Change Threshold (%): Percentage the price must move away from the entry to allow a direction change (default: 2.0%).
How to Use
Add the Breakout Scanner to your chart.
Adjust the settings to match your trading style (e.g., tweak the pivot lookback or SL/TP percentages).
Watch for breakout labels ("Breakout") on the chart, indicating a confirmed breakout.
Use the plotted entry, SL, TP1, and TP2 levels to plan your trades.
Enable alerts to be notified of new breakouts in real-time.
Notes
This indicator is designed to assist with identifying breakout opportunities and does not guarantee specific results. Always combine it with other analysis and risk management techniques.
The direction change feature helps filter breakouts in the opposite direction, but significant price movements may still trigger a new entry in the opposite direction.
For best results, test the indicator on a demo account to understand its behavior in your preferred market and timeframe.
HILo Ema Squeeze BandsThis indicator combines uses ema to identify price squeeze before a big move.
The ema gets initialised at new high low. It used 3 ema's lengths. For result use x, 2x ,4x ie 50, 100, 200 or 100,200,400 and so on . On more volatile asset use a higher settings like 100,200,400. The inner band is divided into 4 zones, which can give support resistance. As you use it you will become aware of subtle information that it can give at times. Like you may be able to find steps at which prices move, when the market is trending
Just like in Bollinger bands, in a trending market the price stays within sd=1 and sd=2 so does in the inner band the price will remain in band1 and band2. But Bollinger band cannot print steps this indicator shows steps

XoogsoXoogso BB+RSI Bounce Indicator
The popular Xoogso Strategy, now available as an indicator with reliable alert capabilities.
Why This Upgrade Matters
The original Xoogso Strategy has been converted to an indicator format to solve alert reliability issues. TradingView strategies often fail to consistently deliver webhook alerts, while indicators provide dependable signal delivery to external systems and trading bots.
Core Features Preserved
✅ Identifies high-probability bounce opportunities using BB(30,2) + RSI(14)
✅ Generates BUY signals only in true oversold conditions
✅ Triggers entry at next candle open after confirmation
✅ Maintains the proven entry logic that traders rely on
Visual Enhancements
- Clear "BUY" text labels replace triangles for better visibility
- Bollinger Band background coloring for easier trend visualization
- Streamlined display focused on actionable information
Bot Integration
This indicator is specifically optimized for webhook alerts, sending properly formatted JSON data that works seamlessly with trading bots and external systems.
Usage Notes
- Use with the same timeframes as the original strategy (1H+)
- Set up TradingView alerts with webhook URLs pointing to your bot
- Keep your custom exit strategies based on personal risk tolerance
*This indicator solves the alert delivery problems of the strategy version while preserving all the trading logic that makes Xoogso effective for bounce trading.*

Reversal Trade Detector with potentialreversal trade indicator based on IDM and choch levels. Also tries to determine potential movement

Smart LineSmart Line Indicator
The Smart Line Indicator is an advanced trend-following tool designed to help traders identify market trends with improved accuracy and clarity. Built upon the traditional SuperTrend concept, it incorporates adaptive ATR-based calculations and customizable multipliers to reduce noise and enhance trend detection.
Key Features:
✅ Dynamic Trend Identification – Uses a smart calculation method to adjust to market volatility and detect strong trends.
✅ Buy & Sell Signals – Clearly displayed Buy (Green Arrow) and Sell (Red Arrow) signals help traders make better entry and exit decisions.
✅ Color-Coded Trend Lines – Green for uptrend, Red for downtrend, providing a visually intuitive way to track price movement.
✅ Noise Reduction – Helps eliminate false breakouts and minimizes whipsaws, making trend-following more reliable.
✅ Multi-Market Compatibility – Suitable for stocks, forex, commodities, and crypto trading across various timeframes.
The Smart Line Indicator is ideal for traders looking for a simple yet powerful way to track market trends, confirm breakouts, and improve trading precision.
Scripted by: Patange Rahul
Maintained by: Macrocosm Global

Internal Market StructureInternal Market Structure Indicator (Based on Bearish/Bullish Candle Patterns)
This custom market structure indicator is designed to help traders identify key shifts in market pressure based on bullish and bearish candle patterns. The indicator tracks consecutive bullish and bearish candles and identifies significant points where the price action suggests a potential reversal or continuation of the current market trend.
Key Features:
1. Bullish & Bearish Candle Recognition: The indicator monitors individual candles to determine if they are bullish (close > open) or bearish (close < open), and uses this information to track price direction over consecutive candles.
2. Consecutive Candle Tracking: It tracks consecutive bullish and bearish candles, giving insight into the strength of the prevailing trend. The number of consecutive candles can be adjusted to refine the analysis based on market conditions.
3. Engulfing Candle Detection: The indicator identifies Bullish and Bearish Engulfing signals when a reversal pattern is detected. These are plotted as triangle shapes on the chart:
-Bullish Engulfing: Indicates a potential reversal or continuation of an upward move, where a bullish candle fully engulfs the previous bearish candle.
-Bearish Engulfing: Indicates a potential reversal or continuation of a downward move, where a bearish candle fully engulfs the previous bullish candle.
4. Internal Shifts: The indicator also tracks Internal Shifts, which occur when the price closes beyond the highest or lowest levels of previous bullish or bearish sequences, signaling a potential trend change:
-Bullish Internal Shift: A shift indicating the market may be turning bullish.
-Bearish Internal Shift: A shift indicating the market may be turning bearish.
5. Alerts: Custom alerts are included to notify traders when any of the above conditions are met:
-Bullish Pressure Change Alert
-Bearish Pressure Change Alert
-Bullish Internal Shift Alert
-Bearish Internal Shift Alert
Plotting:
The indicator visually marks these key price levels with shapes on the chart:
-Green Triangle Up: Bullish Engulfment
-Red Triangle Down: Bearish Engulfment
-Blue Triangle Down: Bearish Internal Shift
-Orange Triangle Up: Bullish Internal Shift
Usage:
This indicator can be used to spot potential reversals, continuation patterns, and shifts in market sentiment. Traders can combine these signals with other technical indicators to form a more robust trading strategy.
By focusing on candle patterns and market structure, this indicator offers a clear, actionable framework for understanding market behavior and making more informed trading decisions.
*NOTE*
The polyline and horizontal trend lines drawn are not included in this indicator, but are there to show how this indicator can be used to illustrate the internal market structure of the given timeframe.

Long Upper & Lower Wick 5 minutes Long Upper & Lower Wick
A fast scalping indicator on a 5-minute timeframe.
The indicator relies on the long upper and lower wicks. The longer the wick, the better the reversal.

Reversal Matrix ProThis is the Zeiierman Machine Learning Momentum (MLMI) as On Chart Version. The original Zeiierman shows you Momentum weakness and strength over more candle periods. This On Chart Version gives you the opportunity to select your own look back period and you get only ONE signal. I find 200 and 40 works best. It eliminates a lot of noise of the original indicator and you can only focus on the chart, since I am a Chart Trader. I try to avoid indicators below and above the chart and trade only from a Laptop. Combine it with my two other indicators. I wrote one with RSI-Wick Reversal detection and Vix-Wick Reversal detection. All three in combination are very powerful. I am experienced and do reversal trading for almost two years now. Since I could not find any of those three indicators I wrote them myself - for the community. Good Luck.

RSI + Stochastic Reversal Strategy with Signals# RSI + Stochastic Reversal Trading Strategy with Signals
## Description
This strategy is designed to capture market reversals by combining two powerful oscillators: **RSI** (Relative Strength Index) and **Stochastic Oscillator**.
It works best in ranging or sideways markets and aims to enter trades when the market shows signs of overbought or oversold conditions, confirmed by a momentum crossover.
---
## Strategy Logic
- **Long Entry Conditions:**
- RSI is below the oversold threshold (default: 30)
- Stochastic %K crosses above %D (indicating a bullish reversal)
- **Short Entry Conditions:**
- RSI is above the overbought threshold (default: 70)
- Stochastic %K crosses below %D (indicating a bearish reversal)
- **Stop-Loss and Take-Profit:**
- Dynamically set as a percentage of the entry price
- Fully customizable through strategy settings
- **Visual Signals:**
- The strategy plots arrows and text labels on the chart whenever a long or short signal is generated
---
## Recommended Settings
| Parameter | Value |
|----------------------|----------------------------------------|
| RSI Length | 14 |
| RSI Oversold Level | 30 |
| RSI Overbought Level | 70 |
| Stochastic %K Length | 14 |
| Stochastic Smoothing | 3 |
| Stop-Loss | 0.5% of entry price |
| Take-Profit | 1.0% of entry price |
| Position Size | 10% of equity per trade (default) |
| Timeframes | 5m, 15m, 1H (scalping and intraday) |
| Best Assets | BTC, ETH, Gold, Forex major pairs |
---
## Indicators Used
- **RSI (Relative Strength Index)**: detects overbought/oversold conditions
- **Stochastic Oscillator (%K and %D)**: confirms reversal signals
---
## Best Market Conditions
- Sideways or ranging markets
- Assets showing frequent pullbacks and reversals
- Works well in crypto, forex, and metals
---
## Key Features
- Simple and clear long/short signals based on indicator confirmation
- Automatic stop-loss and take-profit management
- Visual arrows and labels on the chart for easy signal recognition
- Suitable for both beginner and advanced traders
---
## Optional Improvements
- Add trailing stop functionality for better risk management
- Combine with volume analysis for stronger confirmation
- Filter trades by major market sessions (e.g., London or New York open)
---
> ✅ Backtested on BTCUSDT and EUR/USD — consistent reversal signals and profitable when combined with proper money management.

Multi-Timeframe Momentum Tablebuymeacoffee.com/pixelblade
The Multi-Timeframe Momentum Table is a powerful and visually intuitive tool designed to help traders analyze momentum across multiple timeframes directly on their chart. It displays key momentum indicators—RSI, MACD Histogram, and Stochastic %K—for up to five user-selected timeframes in a clean, color-coded table. This indicator is perfect for traders who rely on multi-timeframe analysis to confirm trends, identify overbought/oversold conditions, and make informed trading decisions.
Key Features:
Multi-Timeframe Analysis:
Supports up to five timeframes (e.g., 1H, 4H, D, W, M).
Users can enable or disable specific timeframes to focus on their preferred analysis periods.
Three Momentum Indicators:
RSI (Relative Strength Index): Measures the speed and change of price movements.
MACD Histogram: Tracks the difference between the MACD line and the signal line.
Stochastic %K: Identifies overbought and oversold conditions.
Color-Coded Cells:
RSI and Stochastic cells are color-coded based on overbought/oversold levels:
Green: Bullish conditions (RSI > 70, Stochastic > 80).
Red: Bearish conditions (RSI < 30, Stochastic < 20).
Gray: Neutral conditions.
Clean and Professional Table Layout:
The table is positioned at the bottom-right corner of the chart for easy reference.
Headers are highlighted with a distinct color for better readability.
Dynamic Updates:
The table updates dynamically with the latest momentum values, ensuring traders always have access to real-time data.
Input Parameters:
Timeframes:
Users can select up to five timeframes (e.g., 1H, 4H, D, W, M) and choose which ones to display.
Indicator Settings:
RSI Length: Adjust the period for RSI calculation.
MACD Fast/Slow Length: Customize the MACD fast and slow moving averages.
MACD Signal Smoothing: Adjust the signal line smoothing period.
Stochastic %K/%D Length: Customize the Stochastic %K and %D periods.
Color Settings:
Users can customize the colors for bullish, bearish, and neutral conditions, as well as the table header.
How It Works:
Data Fetching:
The script fetches momentum data (RSI, MACD Histogram, Stochastic %K) for each selected timeframe using the request.security() function.
Table Creation:
A table is created on the last bar of the chart, displaying the momentum values for each timeframe.
The table is color-coded based on overbought/oversold levels for RSI and Stochastic.
Dynamic Updates:
The table updates dynamically as new data becomes available, ensuring traders always have access to the latest information.
Example Table Layout:
Timeframe RSI MACD Stoch
60 65.23 0.12 75.45
240 72.45 -0.05 82.10
D 58.12 0.08 68.90
How Traders Can Use It:
Trend Confirmation:
Use higher timeframe momentum (e.g., Daily or Weekly) to confirm the overall trend direction.
Use lower timeframe momentum (e.g., 1H or 4H) to identify entry and exit points.
Overbought/Oversold Conditions:
Identify potential reversal points when RSI or Stochastic is in overbought or oversold territory.
Divergence Detection:
Look for divergences between price and momentum indicators to spot potential trend reversals.
Risk Management:
Use the MACD Histogram to gauge the strength of the trend and manage risk accordingly.
Why Use This Indicator?:
Efficiency: Combines multiple timeframes and indicators into a single, easy-to-read table.
Flexibility: Customizable timeframes, indicator settings, and colors to suit individual trading styles.
Visual Clarity: Color-coded cells make it easy to interpret momentum conditions at a glance.
Real-Time Updates: Ensures traders always have access to the latest momentum data.

Fibonacci Forecast IndicatorThis indicator projects potential price movements into the future based on user-defined Fibonacci-period moving averages. By default, it calculates Simple Moving Averages (SMAs) for the 3, 5, 8, 13, and 21 bars (though you can customize these values). For each SMA, it measures the distance between the current closing price and that SMA, then extends the price forward by the same distance.
Key Features
1. Fibonacci MAs:
- Uses Fibonacci numbers (3, 5, 8, 13, 21) for SMA calculations by default.
- Fully customizable periods to fit different trading styles.
2. Forecast Projection:
- If the current price is above a given SMA, the forecast line extends higher (bullish bias).
- If the current price is below the SMA, the forecast line extends lower (bearish bias).
- Forecast lines are anchored at the current bar and project forward according to the same Fibonacci intervals.
3. Clean Visualization:
- Draws a series of connected line segments from the current bar’s close to each forecast point.
- This approach offers a clear, at-a-glance visual of potential future price paths.
How to Use
1. Add to Chart:
- Simply apply the indicator to any chart and timeframe.
- Adjust the Fibonacci periods and styling under the indicator settings.
2. Interpretation:
- Each forecast line shows where price could potentially head if the current momentum (distance from the SMA) continues.
- When multiple lines are consistently above (or below) the current price, it may reinforce a bullish (or bearish) outlook.
3. Customization:
- You can modify the number of forecast lines, their color, and line width in the inputs.
- Change or add your own Fibonacci periods to experiment with different intervals.
Notes and Best Practices
- Confirmation Tool: This indicator is best used alongside other forms of technical or fundamental analysis. It provides a “what-if” scenario based on current momentum, not a guaranteed prediction.
- Not Financial Advice: Past performance doesn’t guarantee future results. Always practice proper risk management and consider multiple indicators or market factors before making trading decisions.
Give it a try, and see if these Fibonacci-based projections help visualize where price may be headed in your trading strategy!
