Carson, California Submit your own pictures of this city and show them to the world
OSM Map
General Map
Google Map
MSN Map
OSM Map
General Map
Google Map
MSN Map
OSM Map
General Map
Google Map
MSN Map
OSM Map
General Map
Google Map
MSN Map
Please wait while loading the map...
Population in 2022: 92,388 (100% urban, 0% rural). Population change since 2000: +3.0%Males: 42,843 Females: 49,545
December 2024 cost of living index in Carson: 134.9 (high, U.S. average is 100) Percentage of residents living in poverty in 2023: 12.1%for White Non-Hispanic residents , 8.5% for Black residents , 10.5% for Hispanic or Latino residents , 4.9% for American Indian residents , 0.7% for Native Hawaiian and other Pacific Islander residents , 13.3% for other race residents , 6.8% for two or more races residents )
Profiles of local businesses
Business Search - 14 Million verified businesses
Data:
Median household income ($)
Median household income (% change since 2000)
Household income diversity
Ratio of average income to average house value (%)
Ratio of average income to average rent
Median household income ($) - White
Median household income ($) - Black or African American
Median household income ($) - Asian
Median household income ($) - Hispanic or Latino
Median household income ($) - American Indian and Alaska Native
Median household income ($) - Multirace
Median household income ($) - Other Race
Median household income for houses/condos with a mortgage ($)
Median household income for apartments without a mortgage ($)
Races - White alone (%)
Races - White alone (% change since 2000)
Races - Black alone (%)
Races - Black alone (% change since 2000)
Races - American Indian alone (%)
Races - American Indian alone (% change since 2000)
Races - Asian alone (%)
Races - Asian alone (% change since 2000)
Races - Hispanic (%)
Races - Hispanic (% change since 2000)
Races - Native Hawaiian and Other Pacific Islander alone (%)
Races - Native Hawaiian and Other Pacific Islander alone (% change since 2000)
Races - Two or more races (%)
Races - Two or more races (% change since 2000)
Races - Other race alone (%)
Races - Other race alone (% change since 2000)
Racial diversity
Unemployment (%)
Unemployment (% change since 2000)
Unemployment (%) - White
Unemployment (%) - Black or African American
Unemployment (%) - Asian
Unemployment (%) - Hispanic or Latino
Unemployment (%) - American Indian and Alaska Native
Unemployment (%) - Multirace
Unemployment (%) - Other Race
Population density (people per square mile)
Population - Males (%)
Population - Females (%)
Population - Males (%) - White
Population - Males (%) - Black or African American
Population - Males (%) - Asian
Population - Males (%) - Hispanic or Latino
Population - Males (%) - American Indian and Alaska Native
Population - Males (%) - Multirace
Population - Males (%) - Other Race
Population - Females (%) - White
Population - Females (%) - Black or African American
Population - Females (%) - Asian
Population - Females (%) - Hispanic or Latino
Population - Females (%) - American Indian and Alaska Native
Population - Females (%) - Multirace
Population - Females (%) - Other Race
Coronavirus confirmed cases (Mar 13, 2025)
Deaths caused by coronavirus (Mar 13, 2025)
Coronavirus confirmed cases (per 100k population) (Mar 13, 2025)
Deaths caused by coronavirus (per 100k population) (Mar 13, 2025)
Daily increase in number of cases (Mar 13, 2025)
Weekly increase in number of cases (Mar 13, 2025)
Cases doubled (in days) (Mar 13, 2025)
Hospitalized patients (Apr 18, 2022)
Negative test results (Apr 18, 2022)
Total test results (Apr 18, 2022)
COVID Vaccine doses distributed (per 100k population) (Sep 19, 2023)
COVID Vaccine doses administered (per 100k population) (Sep 19, 2023)
COVID Vaccine doses distributed (Sep 19, 2023)
COVID Vaccine doses administered (Sep 19, 2023)
Likely homosexual households (%)
Likely homosexual households (% change since 2000)
Likely homosexual households - Lesbian couples (%)
Likely homosexual households - Lesbian couples (% change since 2000)
Likely homosexual households - Gay men (%)
Likely homosexual households - Gay men (% change since 2000)
Cost of living index
Median gross rent ($)
Median contract rent ($)
Median monthly housing costs ($)
Median house or condo value ($)
Median house or condo value ($ change since 2000)
Mean house or condo value by units in structure - 1, detached ($)
Mean house or condo value by units in structure - 1, attached ($)
Mean house or condo value by units in structure - 2 ($)
Mean house or condo value by units in structure by units in structure - 3 or 4 ($)
Mean house or condo value by units in structure - 5 or more ($)
Mean house or condo value by units in structure - Boat, RV, van, etc. ($)
Mean house or condo value by units in structure - Mobile home ($)
Median house or condo value ($) - White
Median house or condo value ($) - Black or African American
Median house or condo value ($) - Asian
Median house or condo value ($) - Hispanic or Latino
Median house or condo value ($) - American Indian and Alaska Native
Median house or condo value ($) - Multirace
Median house or condo value ($) - Other Race
Median resident age
Resident age diversity
Median resident age - Males
Median resident age - Females
Median resident age - White
Median resident age - Black or African American
Median resident age - Asian
Median resident age - Hispanic or Latino
Median resident age - American Indian and Alaska Native
Median resident age - Multirace
Median resident age - Other Race
Median resident age - Males - White
Median resident age - Males - Black or African American
Median resident age - Males - Asian
Median resident age - Males - Hispanic or Latino
Median resident age - Males - American Indian and Alaska Native
Median resident age - Males - Multirace
Median resident age - Males - Other Race
Median resident age - Females - White
Median resident age - Females - Black or African American
Median resident age - Females - Asian
Median resident age - Females - Hispanic or Latino
Median resident age - Females - American Indian and Alaska Native
Median resident age - Females - Multirace
Median resident age - Females - Other Race
Commute - mean travel time to work (minutes)
Travel time to work - Less than 5 minutes (%)
Travel time to work - Less than 5 minutes (% change since 2000)
Travel time to work - 5 to 9 minutes (%)
Travel time to work - 5 to 9 minutes (% change since 2000)
Travel time to work - 10 to 19 minutes (%)
Travel time to work - 10 to 19 minutes (% change since 2000)
Travel time to work - 20 to 29 minutes (%)
Travel time to work - 20 to 29 minutes (% change since 2000)
Travel time to work - 30 to 39 minutes (%)
Travel time to work - 30 to 39 minutes (% change since 2000)
Travel time to work - 40 to 59 minutes (%)
Travel time to work - 40 to 59 minutes (% change since 2000)
Travel time to work - 60 to 89 minutes (%)
Travel time to work - 60 to 89 minutes (% change since 2000)
Travel time to work - 90 or more minutes (%)
Travel time to work - 90 or more minutes (% change since 2000)
Marital status - Never married (%)
Marital status - Now married (%)
Marital status - Separated (%)
Marital status - Widowed (%)
Marital status - Divorced (%)
Median family income ($)
Median family income (% change since 2000)
Median non-family income ($)
Median non-family income (% change since 2000)
Median per capita income ($)
Median per capita income (% change since 2000)
Median family income ($) - White
Median family income ($) - Black or African American
Median family income ($) - Asian
Median family income ($) - Hispanic or Latino
Median family income ($) - American Indian and Alaska Native
Median family income ($) - Multirace
Median family income ($) - Other Race
Median year house/condo built
Median year apartment built
Year house built - Built 2005 or later (%)
Year house built - Built 2000 to 2004 (%)
Year house built - Built 1990 to 1999 (%)
Year house built - Built 1980 to 1989 (%)
Year house built - Built 1970 to 1979 (%)
Year house built - Built 1960 to 1969 (%)
Year house built - Built 1950 to 1959 (%)
Year house built - Built 1940 to 1949 (%)
Year house built - Built 1939 or earlier (%)
Average household size
Household density (households per square mile)
Average household size - White
Average household size - Black or African American
Average household size - Asian
Average household size - Hispanic or Latino
Average household size - American Indian and Alaska Native
Average household size - Multirace
Average household size - Other Race
Occupied housing units (%)
Vacant housing units (%)
Owner occupied housing units (%)
Renter occupied housing units (%)
Vacancy status - For rent (%)
Vacancy status - For sale only (%)
Vacancy status - Rented or sold, not occupied (%)
Vacancy status - For seasonal, recreational, or occasional use (%)
Vacancy status - For migrant workers (%)
Vacancy status - Other vacant (%)
Residents with income below the poverty level (%)
Residents with income below 50% of the poverty level (%)
Children below poverty level (%)
Poor families by family type - Married-couple family (%)
Poor families by family type - Male, no wife present (%)
Poor families by family type - Female, no husband present (%)
Poverty status for native-born residents (%)
Poverty status for foreign-born residents (%)
Poverty among high school graduates not in families (%)
Poverty among people who did not graduate high school not in families (%)
Residents with income below the poverty level (%) - White
Residents with income below the poverty level (%) - Black or African American
Residents with income below the poverty level (%) - Asian
Residents with income below the poverty level (%) - Hispanic or Latino
Residents with income below the poverty level (%) - American Indian and Alaska Native
Residents with income below the poverty level (%) - Multirace
Residents with income below the poverty level (%) - Other Race
Air pollution - Air Quality Index (AQI)
Air pollution - CO
Air pollution - NO2
Air pollution - SO2
Air pollution - Ozone
Air pollution - PM10
Air pollution - PM25
Air pollution - Pb
Crime - Murders per 100,000 population
Crime - Rapes per 100,000 population
Crime - Robberies per 100,000 population
Crime - Assaults per 100,000 population
Crime - Burglaries per 100,000 population
Crime - Thefts per 100,000 population
Crime - Auto thefts per 100,000 population
Crime - Arson per 100,000 population
Crime - City-data.com crime index
Crime - Violent crime index
Crime - Property crime index
Crime - Murders per 100,000 population (5 year average)
Crime - Rapes per 100,000 population (5 year average)
Crime - Robberies per 100,000 population (5 year average)
Crime - Assaults per 100,000 population (5 year average)
Crime - Burglaries per 100,000 population (5 year average)
Crime - Thefts per 100,000 population (5 year average)
Crime - Auto thefts per 100,000 population (5 year average)
Crime - Arson per 100,000 population (5 year average)
Crime - City-data.com crime index (5 year average)
Crime - Violent crime index (5 year average)
Crime - Property crime index (5 year average)
1996 Presidential Elections Results (%) - Democratic Party (Clinton)
1996 Presidential Elections Results (%) - Republican Party (Dole)
1996 Presidential Elections Results (%) - Other
2000 Presidential Elections Results (%) - Democratic Party (Gore)
2000 Presidential Elections Results (%) - Republican Party (Bush)
2000 Presidential Elections Results (%) - Other
2004 Presidential Elections Results (%) - Democratic Party (Kerry)
2004 Presidential Elections Results (%) - Republican Party (Bush)
2004 Presidential Elections Results (%) - Other
2008 Presidential Elections Results (%) - Democratic Party (Obama)
2008 Presidential Elections Results (%) - Republican Party (McCain)
2008 Presidential Elections Results (%) - Other
2012 Presidential Elections Results (%) - Democratic Party (Obama)
2012 Presidential Elections Results (%) - Republican Party (Romney)
2012 Presidential Elections Results (%) - Other
2016 Presidential Elections Results (%) - Democratic Party (Clinton)
2016 Presidential Elections Results (%) - Republican Party (Trump)
2016 Presidential Elections Results (%) - Other
2020 Presidential Elections Results (%) - Democratic Party (Biden)
2020 Presidential Elections Results (%) - Republican Party (Trump)
2020 Presidential Elections Results (%) - Other
Ancestries Reported - Arab (%)
Ancestries Reported - Czech (%)
Ancestries Reported - Danish (%)
Ancestries Reported - Dutch (%)
Ancestries Reported - English (%)
Ancestries Reported - French (%)
Ancestries Reported - French Canadian (%)
Ancestries Reported - German (%)
Ancestries Reported - Greek (%)
Ancestries Reported - Hungarian (%)
Ancestries Reported - Irish (%)
Ancestries Reported - Italian (%)
Ancestries Reported - Lithuanian (%)
Ancestries Reported - Norwegian (%)
Ancestries Reported - Polish (%)
Ancestries Reported - Portuguese (%)
Ancestries Reported - Russian (%)
Ancestries Reported - Scotch-Irish (%)
Ancestries Reported - Scottish (%)
Ancestries Reported - Slovak (%)
Ancestries Reported - Subsaharan African (%)
Ancestries Reported - Swedish (%)
Ancestries Reported - Swiss (%)
Ancestries Reported - Ukrainian (%)
Ancestries Reported - United States (%)
Ancestries Reported - Welsh (%)
Ancestries Reported - West Indian (%)
Ancestries Reported - Other (%)
Educational Attainment - No schooling completed (%)
Educational Attainment - Less than high school (%)
Educational Attainment - High school or equivalent (%)
Educational Attainment - Less than 1 year of college (%)
Educational Attainment - 1 or more years of college (%)
Educational Attainment - Associate degree (%)
Educational Attainment - Bachelor's degree (%)
Educational Attainment - Master's degree (%)
Educational Attainment - Professional school degree (%)
Educational Attainment - Doctorate degree (%)
School Enrollment - Nursery, preschool (%)
School Enrollment - Kindergarten (%)
School Enrollment - Grade 1 to 4 (%)
School Enrollment - Grade 5 to 8 (%)
School Enrollment - Grade 9 to 12 (%)
School Enrollment - College undergrad (%)
School Enrollment - Graduate or professional (%)
School Enrollment - Not enrolled in school (%)
School enrollment - Public schools (%)
School enrollment - Private schools (%)
School enrollment - Not enrolled (%)
Median number of rooms in houses and condos
Median number of rooms in apartments
Housing units lacking complete plumbing facilities (%)
Housing units lacking complete kitchen facilities (%)
Density of houses
Urban houses (%)
Rural houses (%)
Households with people 60 years and over (%)
Households with people 65 years and over (%)
Households with people 75 years and over (%)
Households with one or more nonrelatives (%)
Households with no nonrelatives (%)
Population in households (%)
Family households (%)
Nonfamily households (%)
Population in families (%)
Family households with own children (%)
Median number of bedrooms in owner occupied houses
Mean number of bedrooms in owner occupied houses
Median number of bedrooms in renter occupied houses
Mean number of bedrooms in renter occupied houses
Median number of vehichles in owner occupied houses
Mean number of vehichles in owner occupied houses
Median number of vehichles in renter occupied houses
Mean number of vehichles in renter occupied houses
Mortgage status - with mortgage (%)
Mortgage status - with second mortgage (%)
Mortgage status - with home equity loan (%)
Mortgage status - with both second mortgage and home equity loan (%)
Mortgage status - without a mortgage (%)
Average family size
Average family size - White
Average family size - Black or African American
Average family size - Asian
Average family size - Hispanic or Latino
Average family size - American Indian and Alaska Native
Average family size - Multirace
Average family size - Other Race
Geographical mobility - Same house 1 year ago (%)
Geographical mobility - Moved within same county (%)
Geographical mobility - Moved from different county within same state (%)
Geographical mobility - Moved from different state (%)
Geographical mobility - Moved from abroad (%)
Place of birth - Born in state of residence (%)
Place of birth - Born in other state (%)
Place of birth - Native, outside of US (%)
Place of birth - Foreign born (%)
Housing units in structures - 1, detached (%)
Housing units in structures - 1, attached (%)
Housing units in structures - 2 (%)
Housing units in structures - 3 or 4 (%)
Housing units in structures - 5 to 9 (%)
Housing units in structures - 10 to 19 (%)
Housing units in structures - 20 to 49 (%)
Housing units in structures - 50 or more (%)
Housing units in structures - Mobile home (%)
Housing units in structures - Boat, RV, van, etc. (%)
House/condo owner moved in on average (years ago)
Renter moved in on average (years ago)
Year householder moved into unit - Moved in 1999 to March 2000 (%)
Year householder moved into unit - Moved in 1995 to 1998 (%)
Year householder moved into unit - Moved in 1990 to 1994 (%)
Year householder moved into unit - Moved in 1980 to 1989 (%)
Year householder moved into unit - Moved in 1970 to 1979 (%)
Year householder moved into unit - Moved in 1969 or earlier (%)
Means of transportation to work - Drove car alone (%)
Means of transportation to work - Carpooled (%)
Means of transportation to work - Public transportation (%)
Means of transportation to work - Bus or trolley bus (%)
Means of transportation to work - Streetcar or trolley car (%)
Means of transportation to work - Subway or elevated (%)
Means of transportation to work - Railroad (%)
Means of transportation to work - Ferryboat (%)
Means of transportation to work - Taxicab (%)
Means of transportation to work - Motorcycle (%)
Means of transportation to work - Bicycle (%)
Means of transportation to work - Walked (%)
Means of transportation to work - Other means (%)
Working at home (%)
Industry diversity
Most Common Industries - Agriculture, forestry, fishing and hunting, and mining (%)
Most Common Industries - Agriculture, forestry, fishing and hunting (%)
Most Common Industries - Mining, quarrying, and oil and gas extraction (%)
Most Common Industries - Construction (%)
Most Common Industries - Manufacturing (%)
Most Common Industries - Wholesale trade (%)
Most Common Industries - Retail trade (%)
Most Common Industries - Transportation and warehousing, and utilities (%)
Most Common Industries - Transportation and warehousing (%)
Most Common Industries - Utilities (%)
Most Common Industries - Information (%)
Most Common Industries - Finance and insurance, and real estate and rental and leasing (%)
Most Common Industries - Finance and insurance (%)
Most Common Industries - Real estate and rental and leasing (%)
Most Common Industries - Professional, scientific, and management, and administrative and waste management services (%)
Most Common Industries - Professional, scientific, and technical services (%)
Most Common Industries - Management of companies and enterprises (%)
Most Common Industries - Administrative and support and waste management services (%)
Most Common Industries - Educational services, and health care and social assistance (%)
Most Common Industries - Educational services (%)
Most Common Industries - Health care and social assistance (%)
Most Common Industries - Arts, entertainment, and recreation, and accommodation and food services (%)
Most Common Industries - Arts, entertainment, and recreation (%)
Most Common Industries - Accommodation and food services (%)
Most Common Industries - Other services, except public administration (%)
Most Common Industries - Public administration (%)
Occupation diversity
Most Common Occupations - Management, business, science, and arts occupations (%)
Most Common Occupations - Management, business, and financial occupations (%)
Most Common Occupations - Management occupations (%)
Most Common Occupations - Business and financial operations occupations (%)
Most Common Occupations - Computer, engineering, and science occupations (%)
Most Common Occupations - Computer and mathematical occupations (%)
Most Common Occupations - Architecture and engineering occupations (%)
Most Common Occupations - Life, physical, and social science occupations (%)
Most Common Occupations - Education, legal, community service, arts, and media occupations (%)
Most Common Occupations - Community and social service occupations (%)
Most Common Occupations - Legal occupations (%)
Most Common Occupations - Education, training, and library occupations (%)
Most Common Occupations - Arts, design, entertainment, sports, and media occupations (%)
Most Common Occupations - Healthcare practitioners and technical occupations (%)
Most Common Occupations - Health diagnosing and treating practitioners and other technical occupations (%)
Most Common Occupations - Health technologists and technicians (%)
Most Common Occupations - Service occupations (%)
Most Common Occupations - Healthcare support occupations (%)
Most Common Occupations - Protective service occupations (%)
Most Common Occupations - Fire fighting and prevention, and other protective service workers including supervisors (%)
Most Common Occupations - Law enforcement workers including supervisors (%)
Most Common Occupations - Food preparation and serving related occupations (%)
Most Common Occupations - Building and grounds cleaning and maintenance occupations (%)
Most Common Occupations - Personal care and service occupations (%)
Most Common Occupations - Sales and office occupations (%)
Most Common Occupations - Sales and related occupations (%)
Most Common Occupations - Office and administrative support occupations (%)
Most Common Occupations - Natural resources, construction, and maintenance occupations (%)
Most Common Occupations - Farming, fishing, and forestry occupations (%)
Most Common Occupations - Construction and extraction occupations (%)
Most Common Occupations - Installation, maintenance, and repair occupations (%)
Most Common Occupations - Production, transportation, and material moving occupations (%)
Most Common Occupations - Production occupations (%)
Most Common Occupations - Transportation occupations (%)
Most Common Occupations - Material moving occupations (%)
People in Group quarters - Institutionalized population (%)
People in Group quarters - Correctional institutions (%)
People in Group quarters - Federal prisons and detention centers (%)
People in Group quarters - Halfway houses (%)
People in Group quarters - Local jails and other confinement facilities (including police lockups) (%)
People in Group quarters - Military disciplinary barracks (%)
People in Group quarters - State prisons (%)
People in Group quarters - Other types of correctional institutions (%)
People in Group quarters - Nursing homes (%)
People in Group quarters - Hospitals/wards, hospices, and schools for the handicapped (%)
People in Group quarters - Hospitals/wards and hospices for chronically ill (%)
People in Group quarters - Hospices or homes for chronically ill (%)
People in Group quarters - Military hospitals or wards for chronically ill (%)
People in Group quarters - Other hospitals or wards for chronically ill (%)
People in Group quarters - Hospitals or wards for drug/alcohol abuse (%)
People in Group quarters - Mental (Psychiatric) hospitals or wards (%)
People in Group quarters - Schools, hospitals, or wards for the mentally retarded (%)
People in Group quarters - Schools, hospitals, or wards for the physically handicapped (%)
People in Group quarters - Institutions for the deaf (%)
People in Group quarters - Institutions for the blind (%)
People in Group quarters - Orthopedic wards and institutions for the physically handicapped (%)
People in Group quarters - Wards in general hospitals for patients who have no usual home elsewhere (%)
People in Group quarters - Wards in military hospitals for patients who have no usual home elsewhere (%)
People in Group quarters - Juvenile institutions (%)
People in Group quarters - Long-term care (%)
People in Group quarters - Homes for abused, dependent, and neglected children (%)
People in Group quarters - Residential treatment centers for emotionally disturbed children (%)
People in Group quarters - Training schools for juvenile delinquents (%)
People in Group quarters - Short-term care, detention or diagnostic centers for delinquent children (%)
People in Group quarters - Type of juvenile institution unknown (%)
People in Group quarters - Noninstitutionalized population (%)
People in Group quarters - College dormitories (includes college quarters off campus) (%)
People in Group quarters - Military quarters (%)
People in Group quarters - On base (%)
People in Group quarters - Barracks, unaccompanied personnel housing (UPH), (Enlisted/Officer), ;and similar group living quarters for military personnel (%)
People in Group quarters - Transient quarters for temporary residents (%)
People in Group quarters - Military ships (%)
People in Group quarters - Group homes (%)
People in Group quarters - Homes or halfway houses for drug/alcohol abuse (%)
People in Group quarters - Homes for the mentally ill (%)
People in Group quarters - Homes for the mentally retarded (%)
People in Group quarters - Homes for the physically handicapped (%)
People in Group quarters - Other group homes (%)
People in Group quarters - Religious group quarters (%)
People in Group quarters - Dormitories (%)
People in Group quarters - Agriculture workers' dormitories on farms (%)
People in Group quarters - Job Corps and vocational training facilities (%)
People in Group quarters - Other workers' dormitories (%)
People in Group quarters - Crews of maritime vessels (%)
People in Group quarters - Other nonhousehold living situations (%)
People in Group quarters - Other noninstitutional group quarters (%)
Residents speaking English at home (%)
Residents speaking English at home - Born in the United States (%)
Residents speaking English at home - Native, born elsewhere (%)
Residents speaking English at home - Foreign born (%)
Residents speaking Spanish at home (%)
Residents speaking Spanish at home - Born in the United States (%)
Residents speaking Spanish at home - Native, born elsewhere (%)
Residents speaking Spanish at home - Foreign born (%)
Residents speaking other language at home (%)
Residents speaking other language at home - Born in the United States (%)
Residents speaking other language at home - Native, born elsewhere (%)
Residents speaking other language at home - Foreign born (%)
Class of Workers - Employee of private company (%)
Class of Workers - Self-employed in own incorporated business (%)
Class of Workers - Private not-for-profit wage and salary workers (%)
Class of Workers - Local government workers (%)
Class of Workers - State government workers (%)
Class of Workers - Federal government workers (%)
Class of Workers - Self-employed workers in own not incorporated business and Unpaid family workers (%)
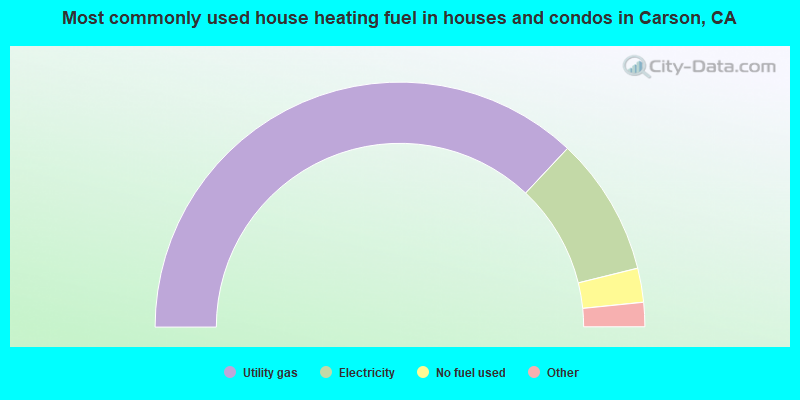
House heating fuel used in houses and condos - Utility gas (%)
House heating fuel used in houses and condos - Bottled, tank, or LP gas (%)
House heating fuel used in houses and condos - Electricity (%)
House heating fuel used in houses and condos - Fuel oil, kerosene, etc. (%)
House heating fuel used in houses and condos - Coal or coke (%)
House heating fuel used in houses and condos - Wood (%)
House heating fuel used in houses and condos - Solar energy (%)
House heating fuel used in houses and condos - Other fuel (%)
House heating fuel used in houses and condos - No fuel used (%)
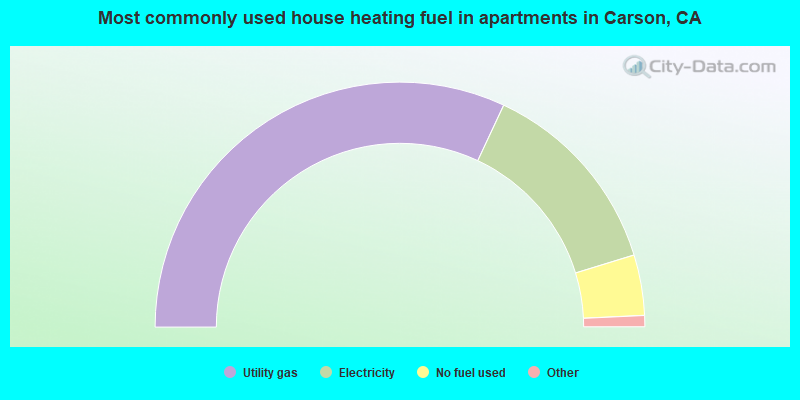
House heating fuel used in apartments - Utility gas (%)
House heating fuel used in apartments - Bottled, tank, or LP gas (%)
House heating fuel used in apartments - Electricity (%)
House heating fuel used in apartments - Fuel oil, kerosene, etc. (%)
House heating fuel used in apartments - Coal or coke (%)
House heating fuel used in apartments - Wood (%)
House heating fuel used in apartments - Solar energy (%)
House heating fuel used in apartments - Other fuel (%)
House heating fuel used in apartments - No fuel used (%)
Armed forces status - In Armed Forces (%)
Armed forces status - Civilian (%)
Armed forces status - Civilian - Veteran (%)
Armed forces status - Civilian - Nonveteran (%)
Read more: https://www.city-data.com/accidents/acc-Addison-Illinois.html
Fatal accidents locations in years 2005-2022
Fatal accidents locations in 2022
Fatal accidents locations in 2021
Fatal accidents locations in 2020
Fatal accidents locations in 2019
Fatal accidents locations in 2018
Fatal accidents locations in 2017
Fatal accidents locations in 2016
Fatal accidents locations in 2015
Fatal accidents locations in 2014
Fatal accidents locations in 2013
Fatal accidents locations in 2012
Fatal accidents locations in 2011
Fatal accidents locations in 2010
Fatal accidents locations in 2009
Fatal accidents locations in 2008
Fatal accidents locations in 2007
Fatal accidents locations in 2006
Fatal accidents locations in 2005
Alcohol use - People drinking some alcohol every month (%)
Alcohol use - People not drinking at all (%)
Alcohol use - Average days/month drinking alcohol
Alcohol use - Average drinks/week
Alcohol use - Average days/year people drink much
Audiometry - Average condition of hearing (%)
Audiometry - People that can hear a whisper from across a quiet room (%)
Audiometry - People that can hear normal voice from across a quiet room (%)
Audiometry - Ears ringing, roaring, buzzing (%)
Audiometry - Had a job exposure to loud noise (%)
Audiometry - Had off-work exposure to loud noise (%)
Blood Pressure & Cholesterol - Has high blood pressure (%)
Blood Pressure & Cholesterol - Checking blood pressure at home (%)
Blood Pressure & Cholesterol - Frequently checking blood cholesterol (%)
Blood Pressure & Cholesterol - Has high cholesterol level (%)
Consumer Behavior - Money monthly spent on food at supermarket/grocery store
Consumer Behavior - Money monthly spent on food at other stores
Consumer Behavior - Money monthly spent on eating out
Consumer Behavior - Money monthly spent on carryout/delivered foods
Consumer Behavior - Income spent on food at supermarket/grocery store (%)
Consumer Behavior - Income spent on food at other stores (%)
Consumer Behavior - Income spent on eating out (%)
Consumer Behavior - Income spent on carryout/delivered foods (%)
Current Health Status - General health condition (%)
Current Health Status - Blood donors (%)
Current Health Status - Has blood ever tested for HIV virus (%)
Current Health Status - Left-handed people (%)
Dermatology - People using sunscreen (%)
Diabetes - Diabetics (%)
Diabetes - Had a blood test for high blood sugar (%)
Diabetes - People taking insulin (%)
Diet Behavior & Nutrition - Diet health (%)
Diet Behavior & Nutrition - Milk product consumption (# of products/month)
Diet Behavior & Nutrition - Meals not home prepared (#/week)
Diet Behavior & Nutrition - Meals from fast food or pizza place (#/week)
Diet Behavior & Nutrition - Ready-to-eat foods (#/month)
Diet Behavior & Nutrition - Frozen meals/pizza (#/month)
Drug Use - People that ever used marijuana or hashish (%)
Drug Use - Ever used hard drugs (%)
Drug Use - Ever used any form of cocaine (%)
Drug Use - Ever used heroin (%)
Drug Use - Ever used methamphetamine (%)
Health Insurance - People covered by health insurance (%)
Kidney Conditions-Urology - Avg. # of times urinating at night
Medical Conditions - People with asthma (%)
Medical Conditions - People with anemia (%)
Medical Conditions - People with psoriasis (%)
Medical Conditions - People with overweight (%)
Medical Conditions - Elderly people having difficulties in thinking or remembering (%)
Medical Conditions - People who ever received blood transfusion (%)
Medical Conditions - People having trouble seeing even with glass/contacts (%)
Medical Conditions - People with arthritis (%)
Medical Conditions - People with gout (%)
Medical Conditions - People with congestive heart failure (%)
Medical Conditions - People with coronary heart disease (%)
Medical Conditions - People with angina pectoris (%)
Medical Conditions - People who ever had heart attack (%)
Medical Conditions - People who ever had stroke (%)
Medical Conditions - People with emphysema (%)
Medical Conditions - People with thyroid problem (%)
Medical Conditions - People with chronic bronchitis (%)
Medical Conditions - People with any liver condition (%)
Medical Conditions - People who ever had cancer or malignancy (%)
Mental Health - People who have little interest in doing things (%)
Mental Health - People feeling down, depressed, or hopeless (%)
Mental Health - People who have trouble sleeping or sleeping too much (%)
Mental Health - People feeling tired or having little energy (%)
Mental Health - People with poor appetite or overeating (%)
Mental Health - People feeling bad about themself (%)
Mental Health - People who have trouble concentrating on things (%)
Mental Health - People moving or speaking slowly or too fast (%)
Mental Health - People having thoughts they would be better off dead (%)
Oral Health - Average years since last visit a dentist
Oral Health - People embarrassed because of mouth (%)
Oral Health - People with gum disease (%)
Oral Health - General health of teeth and gums (%)
Oral Health - Average days a week using dental floss/device
Oral Health - Average days a week using mouthwash for dental problem
Oral Health - Average number of teeth
Pesticide Use - Households using pesticides to control insects (%)
Pesticide Use - Households using pesticides to kill weeds (%)
Physical Activity - People doing vigorous-intensity work activities (%)
Physical Activity - People doing moderate-intensity work activities (%)
Physical Activity - People walking or bicycling (%)
Physical Activity - People doing vigorous-intensity recreational activities (%)
Physical Activity - People doing moderate-intensity recreational activities (%)
Physical Activity - Average hours a day doing sedentary activities
Physical Activity - Average hours a day watching TV or videos
Physical Activity - Average hours a day using computer
Physical Functioning - People having limitations keeping them from working (%)
Physical Functioning - People limited in amount of work they can do (%)
Physical Functioning - People that need special equipment to walk (%)
Physical Functioning - People experiencing confusion/memory problems (%)
Physical Functioning - People requiring special healthcare equipment (%)
Prescription Medications - Average number of prescription medicines taking
Preventive Aspirin Use - Adults 40+ taking low-dose aspirin (%)
Reproductive Health - Vaginal deliveries (%)
Reproductive Health - Cesarean deliveries (%)
Reproductive Health - Deliveries resulted in a live birth (%)
Reproductive Health - Pregnancies resulted in a delivery (%)
Reproductive Health - Women breastfeeding newborns (%)
Reproductive Health - Women that had a hysterectomy (%)
Reproductive Health - Women that had both ovaries removed (%)
Reproductive Health - Women that have ever taken birth control pills (%)
Reproductive Health - Women taking birth control pills (%)
Reproductive Health - Women that have ever used Depo-Provera or injectables (%)
Reproductive Health - Women that have ever used female hormones (%)
Sexual Behavior - People 18+ that ever had sex (vaginal, anal, or oral) (%)
Sexual Behavior - Males 18+ that ever had vaginal sex with a woman (%)
Sexual Behavior - Males 18+ that ever performed oral sex on a woman (%)
Sexual Behavior - Males 18+ that ever had anal sex with a woman (%)
Sexual Behavior - Males 18+ that ever had any sex with a man (%)
Sexual Behavior - Females 18+ that ever had vaginal sex with a man (%)
Sexual Behavior - Females 18+ that ever performed oral sex on a man (%)
Sexual Behavior - Females 18+ that ever had anal sex with a man (%)
Sexual Behavior - Females 18+ that ever had any kind of sex with a woman (%)
Sexual Behavior - Average age people first had sex
Sexual Behavior - Average number of female sex partners in lifetime (males 18+)
Sexual Behavior - Average number of female vaginal sex partners in lifetime (males 18+)
Sexual Behavior - Average age people first performed oral sex on a woman (18+)
Sexual Behavior - Average number of woman performed oral sex on in lifetime (18+)
Sexual Behavior - Average number of male sex partners in lifetime (males 18+)
Sexual Behavior - Average number of male anal sex partners in lifetime (males 18+)
Sexual Behavior - Average age people first performed oral sex on a man (18+)
Sexual Behavior - Average number of male oral sex partners in lifetime (18+)
Sexual Behavior - People using protection when performing oral sex (%)
Sexual Behavior - Average number of times people have vaginal or anal sex a year
Sexual Behavior - People having sex without condom (%)
Sexual Behavior - Average number of male sex partners in lifetime (females 18+)
Sexual Behavior - Average number of male vaginal sex partners in lifetime (females 18+)
Sexual Behavior - Average number of female sex partners in lifetime (females 18+)
Sexual Behavior - Circumcised males 18+ (%)
Sleep Disorders - Average hours sleeping at night
Sleep Disorders - People that has trouble sleeping (%)
Smoking-Cigarette Use - People smoking cigarettes (%)
Taste & Smell - People 40+ having problems with smell (%)
Taste & Smell - People 40+ having problems with taste (%)
Taste & Smell - People 40+ that ever had wisdom teeth removed (%)
Taste & Smell - People 40+ that ever had tonsils teeth removed (%)
Taste & Smell - People 40+ that ever had a loss of consciousness because of a head injury (%)
Taste & Smell - People 40+ that ever had a broken nose or other serious injury to face or skull (%)
Taste & Smell - People 40+ that ever had two or more sinus infections (%)
Weight - Average height (inches)
Weight - Average weight (pounds)
Weight - Average BMI
Weight - People that are obese (%)
Weight - People that ever were obese (%)
Weight - People trying to lose weight (%)
According to our research of California and other state lists, there were 115 registered sex offenders living in Carson, California as of March 13, 2025 . The ratio of all residents to sex offenders in Carson is 807 to 1.The ratio of registered sex offenders to all residents in this city is near the state average.
The City-Data.com crime index weighs serious crimes and violent crimes more heavily. Higher means more crime, U.S. average is 240.7. It adjusts for the number of visitors and daily workers commuting into cities.
- means the value is smaller than the state average.
- means the value is about the same as the state average.
- means the value is bigger than the state average.
- means the value is much bigger than the state average.
Crime rate in Carson detailed stats: murders, rapes, robberies, assaults, burglaries, thefts, arson Officers per 1,000 residents here:
0.01California average:
1.98
Latest news from Carson, CA collected exclusively by city-data.com from local newspapers, TV, and radio stations
Ancestries: Nigerian (2.2%), African (1.3%), American (1.1%).
Current Local Time:
Land area: 18.8 square miles.
Population density: 4,903 people per square mile (average).
32,454 residents are foreign born (18.1% Asia , 13.7% Latin America ).
This city:
35.4%California:
26.7%
Median real estate property taxes paid for housing units with mortgages in 2023: $5,553 (0.8%)Median real estate property taxes paid for housing units with no mortgage in 2023: $2,662 (0.4%)
Nearest city with pop. 200,000+: Long Beach, CA
Nearest city with pop. 1,000,000+: Los Angeles, CA
Nearest cities:
Latitude: 33.84 N, Longitude: 118.26 W
Daytime population change due to commuting: +15,062 (+16.5%)Workers who live and work in this city: 8,124 (20.4%)
Area code commonly used in this area: 310
Property values in Carson, CA
Single-family new house construction building permits:
2023: 3 buildings , average cost: $128,6002022: 11 buildings , average cost: $149,1002021: 7 buildings , average cost: $189,0002020: 4 buildings , average cost: $113,4002019: 9 buildings , average cost: $130,9002018: 4 buildings , average cost: $123,8002017: 20 buildings , average cost: $306,7002016: 9 buildings , average cost: $218,1002015: 29 buildings , average cost: $427,7002014: 28 buildings , average cost: $423,5002013: 4 buildings , average cost: $240,1002003: 69 buildings , average cost: $122,0002002: 154 buildings , average cost: $121,9002001: 139 buildings , average cost: $122,2002000: 158 buildings , average cost: $120,9001999: 8 buildings , average cost: $149,3001998: 8 buildings , average cost: $166,5001997: 11 buildings , average cost: $120,600Unemployment in November 2024:
Population change in the 1990s: +5,515 (+6.5%).
Most common occupations in Carson, CA (%)
Both Males Females
Other management occupations, except farmers and farm managers (4.4%)
Registered nurses (4.3%)
Material recording, scheduling, dispatching, and distributing workers (4.3%)
Supervisors and other personal care and service workers, except child care workers (3.7%)
Health technologists and technicians (3.7%)
Building and grounds cleaning and maintenance occupations (3.6%)
Cooks and food preparation workers (3.4%)
Laborers and material movers, hand (5.0%)
Material recording, scheduling, dispatching, and distributing workers (4.7%)
Electrical equipment mechanics and other installation, maintenance, and repair workers, including supervisors (4.7%)
Other production occupations, including supervisors (4.5%)
Driver/sales workers and truck drivers (4.1%)
Cooks and food preparation workers (3.6%)
Other management occupations, except farmers and farm managers (3.5%)
Registered nurses (7.0%)
Health technologists and technicians (5.4%)
Other management occupations, except farmers and farm managers (5.2%)
Supervisors and other personal care and service workers, except child care workers (4.8%)
Information and record clerks, except customer service representatives (4.6%)
Building and grounds cleaning and maintenance occupations (4.1%)
Other office and administrative support workers, including supervisors (4.1%)
Earthquake activity:
Carson-area historical earthquake activity is significantly above California state average. It is 6765% greater than the overall U.S. average. On 7/21/1952 at 11:52:14, a magnitude 7.7 (7.7 UK, Class: Major, Intensity: VIII - XII) earthquake occurred 90.7 miles away from the city center, causing $50,000,000 total damage On 6/28/1992 at 11:57:34, a magnitude 7.6 (6.2 MB, 7.6 MS, 7.3 MW, Depth: 0.7 mi) earthquake occurred 101.9 miles away from Carson center, causing 3 deaths ( 1 shaking deaths, 2 other deaths) and 400 injuries, causing $100,000,000 total damage and $40,000,000 insured lossesOn 10/16/1999 at 09:46:44, a magnitude 7.4 (6.3 MB, 7.4 MS, 7.2 MW, 7.3 ML) earthquake occurred 114.4 miles away from Carson center On 11/4/1927 at 13:51:53, a magnitude 7.5 (7.5 UK) earthquake occurred 174.8 miles away from the city center On 1/17/1994 at 12:30:55, a magnitude 6.8 (6.4 MB, 6.8 MS, 6.7 MW, Depth: 11.4 mi, Class: Strong, Intensity: VII - IX) earthquake occurred 28.4 miles away from Carson center, causing 60 deaths ( 60 shaking deaths) and 7000 injuriesOn 4/21/1918 at 22:32:30, a magnitude 6.8 (6.8 UK) earthquake occurred 47.1 miles away from the city center Magnitude types: body-wave magnitude (MB), local magnitude (ML), surface-wave magnitude (MS), moment magnitude (MW) Natural disasters: The number of natural disasters in Los Angeles County (66) is a lot greater than the US average (19).Major Disasters (Presidential) Declared: 27Emergencies Declared: 3Fires: 39, Floods: 21, Winter Storms: 11, Mudslides: 10, Landslides: 9, Storms: 9, Earthquakes: 3, Winds: 3, Tornadoes: 2, Freeze: 1, Heavy Rain: 1, Hurricane: 1, Snow: 1, Other: 3 (Note: some incidents may be assigned to more than one category). Main business address for: LEINER HEALTH PRODUCTS INC PHARMACEUTICAL PREPARATIONS ).
Hospitals and medical centers in Carson: K AND S GROUP HOME # 2 (22008 RASHDALL AVE) K AND S GROUP HOME III, INC (1700 E 220TH STREET) LIN-ROS BEST HOME CARE #2 (254 E 228TH STREET) MVM HOME (607 EAST 228TH STREET) ROBILYN'S GUEST HOME (22237 CATSKILL AVENUE) CARSON ARTIFICIAL KIDNEY CENTER, LLC (1309 E. CARSON STREET)
CARSON-AVALON DIALYSIS CENTER (930 EAST DOMINGUEZ STREET, SUITE A)
FMC-CARSON (20710 S. LEAPWOOD AVENUE, SUITE F)
CHARITY HOME HEALTH SERVICES (500 CARSON PLZ DR STE 228)
VANTAGE HOME HEALTH CARE SERVICES, INC (20620 S LEAPWOOD AVENUE, SUITE N)
Amtrak stations near Carson: 7 miles: LONG BEACH (601 N. LONG BEACH BLVD.) - Bus Station Services: fully wheelchair accessible, public restrooms, public payphones, full-service food facilities, paid short-term parking, paid long-term parking, call for taxi service, public transit connection.
7 miles: SAN PEDRO (CATALINA TERMINAL, BERTH 95) - Bus Station Services: partially wheelchair accessible, enclosed waiting area, public restrooms, public payphones, snack bar, paid short-term parking, paid long-term parking, call for taxi service.
16 miles: LOS ANGELES (800 N. ALAMEDA ST.) Services: ticket office, fully wheelchair accessible, enclosed waiting area, public restrooms, public payphones, snack bar, free short-term parking, paid long-term parking, car rental agency, taxi stand, public transit connection.
Colleges/Universities in Carson: California State University-Dominguez Hills Full-time enrollment: 9,862; Location: 1000 E Victoria St; Public; Website: www.csudh.edu; Offers Master's degree )
RWM Fiber Optics Full-time enrollment: 92; Location: 16627 South Avalon Blvd Suite A; Private, for-profit; Website: www.rwmfiber.com)
InterCoast Colleges-Carson Full-time enrollment: 86; Location: One Civic Plaza-Ste 110; Private, for-profit; Website: www.intercoast.edu/locations/carson)
California Healing Arts College Full-time enrollment: 27; Location: 500 East Carson Plaza Drive, Suite 103; Private, for-profit; Website: www.chac.edu)
Other colleges/universities with over 2000 students near Carson:
El Camino College-Compton Center (about 4 miles; Compton, CA ; Full-time enrollment: 4,506)
Los Angeles Harbor College (about 5 miles; Wilmington, CA ; FT enrollment: 5,285)
Wyotech-Long Beach (about 5 miles; Long Beach, CA ; FT enrollment: 2,453)
El Camino Community College District (about 5 miles; Torrance, CA ; FT enrollment: 13,952)
Los Angeles Southwest College (about 7 miles; Los Angeles, CA ; FT enrollment: 3,247)
Long Beach City College (about 8 miles; Long Beach, CA ; FT enrollment: 15,602)
California State University-Long Beach (about 10 miles; Long Beach, CA ; FT enrollment: 28,287)
Public high schools in Carson: CARSON SENIOR HIGH Students: 2,476, Location: 22328 S. MAIN ST., Grades: 9-12)CALIFORNIA ACADEMY OF MATHEMATICS AND SCIENCE Students: 463, Location: 1000 E. VICTORIA ST., Grades: 9-12)MAGNOLIA SCIENCE ACADEMY 3 Students: 213, Location: 1254 E. HELMICK ST., Grades: 6-12, Charter school )EAGLE TREE CONTINUATION Students: 26, Location: 22628 S. MAIN ST., Grades: 9-12)ACADEMIES OF EDUCATION AND EMPOWERMENT AT CARSON H Location: 22328 S. MAIN ST., Grades: 9-12)
ACADEMY OF MEDICAL ARTS AT CARSON HIGH Location: 22328 S. MAIN ST., Grades: 9-12)
Private high school in Carson: CARSON CHRISTIAN SCHOOL Students: 67, Location: 21828 AVALON BLVD, Grades: KG-12)
Biggest public elementary/middle schools in Carson: STEPHEN M. WHITE MIDDLE Students: 1,745, Location: 22102 S. FIGUEROA ST., Grades: 6-8)ANDREW CARNEGIE MIDDLE Students: 1,421, Location: 21820 BONITA ST., Grades: 6-8)GLENN HAMMOND CURTISS MIDDLE Students: 949, Location: 1254 E. HELMICK ST., Grades: 6-8)CAROLDALE LEARNING COMMUNITY Students: 727, Location: 22424 CAROLDALE AVE., Grades: KG-8)CATSKILL AVENUE ELEMENTARY Students: 492, Location: 23536 CATSKILL AVE., Grades: KG-5)CARSON STREET ELEMENTARY Students: 458, Location: 161 E. CARSON ST., Grades: KG-5)DOLORES STREET ELEMENTARY Students: 441, Location: 22526 DOLORES ST., Grades: KG-5)DOMINGUEZ ELEMENTARY Students: 418, Location: 21250 SANTA FE AVE., Grades: KG-5)AMBLER AVENUE ELEMENTARY Students: 381, Location: 319 E. SHERMAN DR., Grades: KG-5)BONITA STREET ELEMENTARY Students: 380, Location: 21929 BONITA ST., Grades: KG-5)Private elementary/middle school in Carson: CARSON MONTESSORI ACADEMY Students: 63, Location: 812 E CARSON ST, Grades: PK-3)
See full list of schools located in Carson
Notable locations in Carson: (A) , Victoria Golf Course (B) , Dominguez Golf Course (C) , Victoria Park Branch County of Los Angeles Public Library (D) , Carson City Hall (E) , Carson Branch County of Los Angeles Public Library (F) , Americare Ambulance Service Station 2 (G) , British Petroleum Refinery Fire Department (H) , Carson Sheriffs Station (I) , Los Angeles County Fire Department Station 127 (J) , Los Angeles County Fire Department Station 116 (K) , Los Angeles County Fire Department Station 36 (L) , Los Angeles County Fire Department Station 10 (M) . Display/hide their locations on the map
Shopping Center: (1) . Display/hide its location on the map
Main business address in Carson: (A) . Display/hide its location on the map
Churches in Carson include: (A) , South Bay Abundant Life Church (B) , Carson Christian Church (C) , Carson Hope Chapel Foursquare Church (D) , Grace Orthodox Presbyterian Church (E) , Judson Baptist Church (F) , Keystone Assembly of God Church (G) , Pentecostal Church of God (H) , Rock of Salvation Church (I) . Display/hide their locations on the map
Cemetery: (1) . Display/hide its location on the map
Parks in Carson include: (1) , Scott Park (2) , Victoria Park (3) , Malloy Park (4) , Vernon Hemingway Memorial Park (5) , Calas Park (6) , Carriage Crest Park (7) , Del Amo Park (8) , Stevenson Park (9) . Display/hide their locations on the map
Hotel:
Court:
Birthplace of: Kia Stevens - Professional wrestler, Bob Whitfield - 2005 NFL player (New York Giants, born : Oct 18, 1971), Brian Wethers - Basketball player, Eric Johnson - 2005 NFL player (Arizona Cardinals, born : Apr 30, 1976), Kevin Burnett - 2005 NFL player (Dallas Cowboys, born : Dec 24, 1982), Rico Ramos - Boxer, Stanley Wilson - 2005 NFL player (Detroit Lions, born : Nov 5, 1982), Dashon Goldson - Football player, Horacio Ramírez - Baseball player, Jamelle Holieway - Football player.
Los Angeles County has a predicted average indoor radon screening level between 2 and 4 pCi/L (pico curies per liter) - Moderate Potential Average household size: This city:
3.6 peopleCalifornia:
2.9 people
Percentage of family households: This city:
81.5%Whole state:
68.7%
Percentage of households with unmarried partners: This city:
4.5%Whole state:
7.2%
Likely homosexual households (counted as self-reported same-sex unmarried-partner households)
Lesbian couples: 0.3% of all households Gay men: 0.3% of all households
People in group quarters in Carson in 2010:
571 people in college/university student housing
227 people in group homes intended for adults
202 people in residential treatment centers for adults
148 people in workers' group living quarters and job corps centers
54 people in group homes for juveniles (non-correctional)
49 people in nursing facilities/skilled-nursing facilities
22 people in other noninstitutional facilities
13 people in correctional residential facilities
11 people in correctional facilities intended for juveniles
4 people in mental (psychiatric) hospitals and psychiatric units in other hospitals
2 people in residential treatment centers for juveniles (non-correctional)
People in group quarters in Carson in 2000:
451 people in college dormitories (includes college quarters off campus)
315 people in other noninstitutional group quarters
236 people in nursing homes
54 people in other nonhousehold living situations
35 people in homes or halfway houses for drug/alcohol abuse
34 people in homes for the mentally ill
32 people in other group homes
31 people in homes for the mentally retarded
12 people in religious group quarters
6 people in homes for abused, dependent, and neglected children
4 people in homes for the physically handicapped
Banks with branches in Carson (2011 data):
JPMorgan Chase Bank, National Association: Carson Branch at 104 E. Sepulveda Blvd, branch established on 2003/02/03; Carson Branch at 20710 Avalon Boulevard, branch established on 2006/10/30. Info updated 2011/11/10: Bank assets: $1,811,678.0 mil, Deposits: $1,190,738.0 mil, headquarters in Columbus, OH, positive income , International Specialization, 5577 total offices , Holding Company: Jpmorgan Chase & Co.
Bank of America, National Association: Carson Branch at 180 East Carson Street, branch established on 1960/07/22; South Bay Pavilion Branch at 870 East Del Amo Boulevard, branch established on 1971/05/28. Info updated 2009/11/18: Bank assets: $1,451,969.3 mil, Deposits: $1,077,176.8 mil, headquarters in Charlotte, NC, positive income , 5782 total offices , Holding Company: Bank Of America Corporation
Wells Fargo Bank, National Association: Carson Branch at 18005 South Avalon Boulevard, branch established on 1981/12/14; Carson Town Center at 506 West Torrance Boulevard, branch established on 1997/09/09. Info updated 2011/04/05: Bank assets: $1,161,490.0 mil, Deposits: $905,653.0 mil, headquarters in Sioux Falls, SD, positive income , 6395 total offices , Holding Company: Wells Fargo & Company
U.S. Bank National Association: Carson Albertsons Branch at 200 E. Sepulveda Blvd, branch established on 2002/04/05. Info updated 2012/01/30: Bank assets: $330,470.8 mil, Deposits: $236,091.5 mil, headquarters in Cincinnati, OH, positive income , 3121 total offices , Holding Company: U.S. Bancorp
East West Bank: Carson St Branch at 510 West Carson Street, branch established on 1999/02/22. Info updated 2010/06/14: Bank assets: $21,962.4 mil, Deposits: $17,501.8 mil, headquarters in Pasadena, CA, positive income , Commercial Lending Specialization, 131 total offices , Holding Company: East West Bancorp, Inc.
Merchants Bank of California, National Association: Merchants Bank Of California, National Association at One Civic Plaza, Suite 100, branch established on 1989/03/31. Info updated 2010/05/25: Bank assets: $86.1 mil, Deposits: $65.3 mil, local headquarters , positive income , Commercial Lending Specialization, 1 total offices
For population 15 years and over in Carson:
Never married: 38.3%Now married: 45.0%Separated: 2.3%Widowed: 6.5%Divorced: 7.8% For population 25 years and over in Carson:
High school or higher: 84.3%Bachelor's degree or higher: 27.7%Graduate or professional degree: 8.0%Unemployed: 7.9%Mean travel time to work (commute): 21.4 minutes
Education Gini index (Inequality in education) Here:
13.6California average:
15.4
Religion statistics for Carson, CA (based on Los Angeles County data)
Religion Adherents Congregations Catholic 3,542,994 275 Evangelical Protestant 814,611 3,249 Other 451,594 1,023 Mainline Protestant 229,056 860 Black Protestant 112,338 290 Orthodox 63,517 76 None 4,604,495 -
Source: Clifford Grammich, Kirk Hadaway, Richard Houseal, Dale E.Jones, Alexei Krindatch, Richie Stanley and Richard H.Taylor. 2012. 2010 U.S.Religion Census: Religious Congregations & Membership Study. Association of Statisticians of American Religious Bodies. Jones, Dale E., et al. 2002. Congregations and Membership in the United States 2000. Nashville, TN: Glenmary Research Center. Graphs represent county-level data
Food Environment Statistics: Number of grocery stores : 2,084Here :
2.12 / 10,000 pop.California :
2.14 / 10,000 pop.
Number of supercenters and club stores : 32Here :
0.03 / 10,000 pop.California :
0.04 / 10,000 pop.
Number of convenience stores (no gas) : 567This county :
0.58 / 10,000 pop.State :
0.62 / 10,000 pop.
Number of convenience stores (with gas) : 1,206Los Angeles County :
1.23 / 10,000 pop.State :
1.49 / 10,000 pop.
Number of full-service restaurants : 7,008This county :
7.15 / 10,000 pop.State :
7.42 / 10,000 pop.
Adult diabetes rate : This county :
7.5%State :
7.3%
Adult obesity rate : Los Angeles County :
20.4%California :
21.3%
Low-income preschool obesity rate : Here :
18.6%California :
17.9%
Health and Nutrition: Healthy diet rate : Carson:
50.6%California:
49.4%
Average overall health of teeth and gums : This city:
48.3%California:
48.0%
People feeling badly about themselves : This city:
18.8%California:
20.2%
People not drinking alcohol at all : Carson:
14.5%California:
11.2%
Average hours sleeping at night : Overweight people : Carson:
30.5%California:
31.5%
General health condition : Here:
55.6%California:
56.4%
Average condition of hearing : More about Health and Nutrition of Carson, CA Residents
Local government employment and payroll (March 2022)
Function
Full-time employees
Monthly full-time payroll
Average yearly full-time wage
Part-time employees
Monthly part-time payroll
Other and Unallocable
117 $732,505 $75,129 19 $28,616 Parks and Recreation
55 $334,017 $72,876 226 $294,637 Financial Administration
40 $315,245 $94,574 2 $4,786 Streets and Highways
32 $207,939 $77,977 0 $0 Other Government Administration
31 $258,461 $100,049 8 $23,375 Housing and Community Development (Local)
16 $114,191 $85,643 0 $0 Transit
5 $37,446 $89,870 2 $8,316
Totals for Government
296 $1,999,803 $81,073 257 $359,730
Carson government finances - Expenditure in 2022 (per resident):
Construction - Regular Highways: $9,696,000 ($104.95)
General - Other: $363,000 ($3.93)Current Operations - Police Protection: $24,091,000 ($260.76)
General - Other: $21,922,000 ($237.28)Central Staff Services: $18,987,000 ($205.51)Regular Highways: $16,197,000 ($175.31)Parks and Recreation: $13,329,000 ($144.27)Housing and Community Development: $8,567,000 ($92.73)Protective Inspection and Regulation - Other: $4,177,000 ($45.21)Natural Resources - Other: $3,146,000 ($34.05)Transit Utilities: $2,903,000 ($31.42)Health - Other: $247,000 ($2.67)Solid Waste Management: $213,000 ($2.31)General - Interest on Debt: $7,750,000 ($83.89)
Carson government finances - Revenue in 2022 (per resident):
Charges - Other: $4,343,000 ($47.01)
Parks and Recreation: $1,030,000 ($11.15)Federal Intergovernmental - Other: $18,679,000 ($202.18)
Local Intergovernmental - Other: $3,697,000 ($40.02)
Miscellaneous - General Revenue - Other: $12,659,000 ($137.02)
Sale of Property: $7,370,000 ($79.77)Special Assessments: $3,441,000 ($37.25)Rents: $2,117,000 ($22.91)Fines and Forfeits: $1,545,000 ($16.72)Donations From Private Sources: $44,000 ($0.48)Revenue - Transit Utilities: $35,000 ($0.38)
State Intergovernmental - Other: $4,813,000 ($52.10)
Tax - General Sales and Gross Receipts: $40,077,000 ($433.79)
Other: $30,765,000 ($333.00)Public Utilities Sales: $24,543,000 ($265.65)Property: $17,479,000 ($189.19)Other License: $5,868,000 ($63.51)Occupation and Business License - Other: $2,922,000 ($31.63)Other Selective Sales: $2,026,000 ($21.93)Documentary and Stock Transfer: $632,000 ($6.84)
Carson government finances - Debt in 2022 (per resident):
Long Term Debt - Beginning Outstanding - Unspecified Public Purpose: $193,766,000 ($2097.31)
Outstanding Unspecified Public Purpose: $183,889,000 ($1990.40)Retired Unspecified Public Purpose: $9,877,000 ($106.91)
2.98% of this county's 2021 resident taxpayers lived in other counties in 2020 ($81,235 average adjusted gross income )
Here:
2.98%California average:
5.19%
0.01% of residents moved from foreign countries ($155 average AGI )Los Angeles County:
0.01%California average:
0.03%
Top counties from which taxpayers relocated into this county between 2020 and 2021:
4.68% of this county's 2020 resident taxpayers moved to other counties in 2021 ($97,324 average adjusted gross income )
Here:
4.68%California average:
6.14%
0.01% of residents moved to foreign countries ($196 average AGI )Los Angeles County:
0.01%California average:
0.02%
Top counties to which taxpayers relocated from this county between 2020 and 2021:
Businesses in Carson, CA
Name Count Name Count
24 Hour Fitness 1 Jack In The Box 6 7-Eleven 3 Jamba Juice 1 AT&T 1 Jones New York 1 Albertsons 2 Just Tires 1 AutoZone 1 KFC 3 Baskin-Robbins 2 Kmart 1 Big O Tires 1 Kroger 2 Blockbuster 1 Little Caesars Pizza 1 Burger King 1 MasterBrand Cabinets 10 CVS 2 McDonald's 4 Carl\s Jr. 3 Nike 4 Chevrolet 1 Nissan 1 Chuck E. Cheese's 1 Old Navy 1 Cinnabon 1 Panda Express 2 Circle K 1 Panera Bread 1 Clarion 1 Payless 2 Cold Stone Creamery 1 Penske 1 Curves 1 Pizza Hut 2 DHL 3 Popeyes 1 Decora Cabinetry 1 Quiznos 2 Dennys 1 RadioShack 1 Discount Tire 1 Sears 3 Domino's Pizza 2 Sprint Nextel 1 Econo Lodge 1 Staples 1 El Pollo Loco 1 Starbucks 8 Extended Stay America 1 Subway 6 FedEx 9 T-Mobile 4 Firestone Complete Auto Care 1 Taco Bell 2 GNC 2 Target 2 GameStop 2 Toyota 1 H&R Block 3 True Value 1 Hilton 1 UPS 11 Home Depot 1 Vans 1 Honda 1 Verizon Wireless 1 IKEA 1 Wendy's 1 JCPenney 1
Strongest AM radio stations in Carson:
KNX (1070 AM; 50 kW; LOS ANGELES, CA; Owner: INFINITY BROADCASTING OPERATIONS, INC.)
KFI (640 AM; 50 kW; LOS ANGELES, CA; Owner: CAPSTAR TX LIMITED PARTNERSHIP)
KFWB (980 AM; 50 kW; LOS ANGELES, CA; Owner: INFINITY BROADCASTING OPERATIONS, INC.)
KLAC (570 AM; 50 kW; LOS ANGELES, CA; Owner: AMFM RADIO LICENSES, L.L.C.)
KLTX (1390 AM; 5 kW; LONG BEACH, CA; Owner: HI-FAVOR BROADCASTING, LLC)
KMPC (1540 AM; 50 kW; LOS ANGELES, CA; Owner: ROSE CITY RADIO CORPORATION)
KTNQ (1020 AM; 50 kW; LOS ANGELES, CA; Owner: KTNQ-AM LICENSE CORP.)
KBLA (1580 AM; 50 kW; SANTA MONICA, CA)
KSPN (710 AM; 50 kW; LOS ANGELES, CA; Owner: KABC-AM RADIO, INC.)
KXTA (1150 AM; 50 kW; LOS ANGELES, CA; Owner: CITICASTERS LICENSES, L.P.)
KFRN (1280 AM; 1 kW; LONG BEACH, CA; Owner: FAMILY STATIONS, INC.)
KDIS (1110 AM; 50 kW; PASADENA, CA; Owner: ABC,INC.)
KXMX (1190 AM; 25 kW; ANAHEIM, CA; Owner: NEW INSPIRATION BROADCASTING COMPANY)
Strongest FM radio stations in Carson:
KBUE (105.5 FM; LONG BEACH, CA; Owner: LBI RADIO LICENSE CORP.)
KLAX-FM (97.9 FM; EAST LOS ANGELES, CA; Owner: KLAX LICENSING, INC.)
KKBT (100.3 FM; LOS ANGELES, CA; Owner: RADIO ONE LICENSES, LLC)
KZLA-FM (93.9 FM; LOS ANGELES, CA; Owner: EMMIS RADIO LICENSE CORPORATION)
KPWR (105.9 FM; LOS ANGELES, CA; Owner: EMMIS RADIO LICENSE CORPORATION)
KLSX (97.1 FM; LOS ANGELES, CA; Owner: INFINITY BROADCASTING OPERATIONS, INC.)
KUSC (91.5 FM; LOS ANGELES, CA; Owner: UNIVERSITY OF SOUTHERN CALIFORNIA)
KKLA-FM (99.5 FM; LOS ANGELES, CA; Owner: NEW INSPIRATION BROADCASTING CO., INC.)
KRTH-FM (101.1 FM; LOS ANGELES, CA; Owner: INFINITY BROADCASTING OPERATIONS, INC.)
KKJZ (88.1 FM; LONG BEACH, CA; Owner: CALIF. STATE UNIV LONG BEACH FOUND.)
KCBS-FM (93.1 FM; LOS ANGELES, CA; Owner: INFINITY BROADCASTING OPERATIONS, INC.)
KSCA (101.9 FM; GLENDALE, CA; Owner: HBC LICENSE CORPORATION)
KLOS (95.5 FM; LOS ANGELES, CA; Owner: KLOS-FM RADIO, INC.)
K212FA (90.3 FM; TEMPLE CITY, CA; Owner: EDUCATIONAL MEDIA FOUNDATION)
KOST (103.5 FM; LOS ANGELES, CA; Owner: CAPSTAR TX LIMITED PARTNERSHIP)
KZAB (93.5 FM; REDONDO BEACH, CA; Owner: KZAB LICENSING, INC.)
KLVE (107.5 FM; LOS ANGELES, CA; Owner: KLVE-FM LICENSE CORP.)
KIIS-FM (102.7 FM; LOS ANGELES, CA; Owner: CITICASTERS LICENSES, L.P.)
KPCC (89.3 FM; PASADENA, CA; Owner: PASADENA AREA COMMUNITY COLLEGE DISTRICT)
KHHT (92.3 FM; LOS ANGELES, CA; Owner: AMFM RADIO LICENSES, L.L.C.)
TV broadcast stations around Carson:
KTRO-LP (Channel 50; LANCASTER, CA; Owner: ROBERT D. ADELMAN)
KCBS-TV (Channel 2; LOS ANGELES, CA; Owner: CBS BROADCASTING INC.)
KTLA-TV (Channel 5; LOS ANGELES, CA; Owner: KTLA INC.)
KABC-TV (Channel 7; LOS ANGELES, CA; Owner: ABC HOLDING COMPANY, INC.)
KNBC (Channel 4; LOS ANGELES, CA; Owner: NBC SUBSIDIARY (KNBC-TV), INC.)
National Bridge Inventory (NBI) Statistics 74 Number of bridges1,073ft / 327m Total length $10,413,000 Total costs4,727,862 Total average daily traffic289,300 Total average daily truck traffic
New bridges - historical statistics
1 1910-1919 1 1920-1929 1 1930-1939 5 1950-1959 36 1960-1969 9 1970-1979 8 1980-1989 8 1990-1999 5 2000-2009
See full National Bridge Inventory statistics for Carson, CA
Home Mortgage Disclosure Act Aggregated Statistics For Year 2009(Based on 14 full and 4 partial tracts) A) FHA, FSA/RHS & VA B) Conventional C) Refinancings D) Home Improvement Loans E) Loans on Dwellings For 5+ Families F) Non-occupant Loans on G) Loans On Manufactured Number Average Value Number Average Value Number Average Value Number Average Value Number Average Value Number Average Value Number Average Value
LOANS ORIGINATED 398 $289,199 214 $216,630 868 $240,541 71 $135,981 0 $0 55 $190,733 18 $66,218 APPLICATIONS APPROVED, NOT ACCEPTED 48 $307,871 42 $190,017 151 $259,541 12 $47,749 0 $0 8 $197,382 8 $41,531 APPLICATIONS DENIED 100 $297,838 119 $185,116 654 $289,064 55 $103,086 0 $0 43 $213,580 48 $84,006 APPLICATIONS WITHDRAWN 63 $262,000 57 $238,054 286 $265,871 11 $191,645 1 $13,300,000 20 $177,164 1 $65,740 FILES CLOSED FOR INCOMPLETENESS 22 $272,929 17 $203,635 146 $283,685 5 $135,730 0 $0 15 $235,760 3 $72,000
Aggregated Statistics For Year 2008(Based on 14 full and 4 partial tracts) A) FHA, FSA/RHS & VA B) Conventional C) Refinancings D) Home Improvement Loans E) Loans on Dwellings For 5+ Families F) Non-occupant Loans on G) Loans On Manufactured Number Average Value Number Average Value Number Average Value Number Average Value Number Average Value Number Average Value Number Average Value
LOANS ORIGINATED 167 $314,437 286 $274,679 884 $272,550 125 $153,922 4 $2,571,560 100 $238,386 27 $86,430 APPLICATIONS APPROVED, NOT ACCEPTED 24 $300,350 99 $233,382 283 $296,109 37 $120,596 0 $0 22 $270,526 33 $91,928 APPLICATIONS DENIED 75 $318,147 219 $288,571 1,061 $328,711 194 $151,168 2 $324,750 77 $278,987 60 $81,500 APPLICATIONS WITHDRAWN 40 $294,462 91 $261,673 334 $304,653 36 $151,306 1 $3,860,000 24 $242,113 3 $52,707 FILES CLOSED FOR INCOMPLETENESS 13 $296,050 30 $350,497 125 $318,809 23 $198,697 0 $0 9 $220,164 0 $0
Aggregated Statistics For Year 2007(Based on 14 full and 4 partial tracts) A) FHA, FSA/RHS & VA B) Conventional C) Refinancings D) Home Improvement Loans E) Loans on Dwellings For 5+ Families F) Non-occupant Loans on G) Loans On Manufactured Number Average Value Number Average Value Number Average Value Number Average Value Number Average Value Number Average Value Number Average Value
LOANS ORIGINATED 3 $313,563 684 $288,144 2,549 $319,270 392 $212,533 8 $776,779 202 $307,696 57 $92,236 APPLICATIONS APPROVED, NOT ACCEPTED 1 $148,160 256 $281,564 694 $319,946 98 $192,851 0 $0 47 $329,861 46 $93,033 APPLICATIONS DENIED 1 $513,000 510 $309,654 1,986 $355,725 382 $177,784 0 $0 118 $312,461 73 $91,906 APPLICATIONS WITHDRAWN 0 $0 192 $320,495 837 $347,797 104 $197,488 2 $429,000 44 $280,498 1 $79,000 FILES CLOSED FOR INCOMPLETENESS 1 $102,860 83 $317,192 321 $369,620 21 $212,602 0 $0 16 $288,972 0 $0
Aggregated Statistics For Year 2006(Based on 14 full and 4 partial tracts) A) FHA, FSA/RHS & VA B) Conventional C) Refinancings D) Home Improvement Loans E) Loans on Dwellings For 5+ Families F) Non-occupant Loans on G) Loans On Manufactured Number Average Value Number Average Value Number Average Value Number Average Value Number Average Value Number Average Value Number Average Value
LOANS ORIGINATED 2 $258,500 1,584 $277,609 3,781 $315,842 594 $228,113 8 $856,936 344 $299,189 42 $73,327 APPLICATIONS APPROVED, NOT ACCEPTED 0 $0 372 $244,818 967 $303,270 131 $198,081 0 $0 101 $288,804 61 $71,350 APPLICATIONS DENIED 0 $0 796 $279,630 2,091 $328,510 414 $180,326 1 $500,000 150 $302,669 77 $74,329 APPLICATIONS WITHDRAWN 1 $145,000 442 $279,280 1,541 $327,791 187 $213,567 0 $0 111 $294,870 6 $155,500 FILES CLOSED FOR INCOMPLETENESS 0 $0 98 $299,941 332 $331,841 28 $232,899 1 $600,000 27 $323,025 1 $25,000
Aggregated Statistics For Year 2005(Based on 14 full and 4 partial tracts) A) FHA, FSA/RHS & VA B) Conventional C) Refinancings D) Home Improvement Loans E) Loans on Dwellings For 5+ Families F) Non-occupant Loans on G) Loans On Manufactured Number Average Value Number Average Value Number Average Value Number Average Value Number Average Value Number Average Value Number Average Value
LOANS ORIGINATED 1 $346,730 1,657 $248,343 4,590 $288,097 674 $203,422 9 $1,404,036 342 $259,940 49 $74,727 APPLICATIONS APPROVED, NOT ACCEPTED 0 $0 389 $221,497 928 $281,665 117 $177,502 0 $0 90 $252,953 71 $79,127 APPLICATIONS DENIED 1 $241,000 668 $247,071 2,303 $292,408 433 $165,705 1 $369,420 152 $286,814 92 $76,241 APPLICATIONS WITHDRAWN 1 $141,570 377 $264,044 2,000 $291,767 210 $198,357 0 $0 127 $257,124 10 $223,772 FILES CLOSED FOR INCOMPLETENESS 0 $0 82 $277,372 486 $292,329 40 $205,972 0 $0 20 $225,366 0 $0
Aggregated Statistics For Year 2004(Based on 14 full and 4 partial tracts) A) FHA, FSA/RHS & VA B) Conventional C) Refinancings D) Home Improvement Loans E) Loans on Dwellings For 5+ Families F) Non-occupant Loans on G) Loans On Manufactured Number Average Value Number Average Value Number Average Value Number Average Value Number Average Value Number Average Value Number Average Value
LOANS ORIGINATED 16 $208,319 1,971 $219,118 4,814 $233,649 575 $167,882 10 $745,000 359 $214,444 27 $56,766 APPLICATIONS APPROVED, NOT ACCEPTED 1 $349,010 426 $231,850 1,127 $231,272 107 $162,854 0 $0 108 $194,857 15 $64,483 APPLICATIONS DENIED 5 $194,586 644 $220,484 2,104 $230,858 410 $124,121 3 $495,667 162 $206,778 33 $66,247 APPLICATIONS WITHDRAWN 2 $223,685 433 $232,707 1,730 $233,321 136 $162,942 1 $210,000 89 $208,329 3 $73,000 FILES CLOSED FOR INCOMPLETENESS 3 $224,003 89 $229,070 459 $236,150 37 $90,696 0 $0 28 $216,021 0 $0
Aggregated Statistics For Year 2003(Based on 14 full and 4 partial tracts) A) FHA, FSA/RHS & VA B) Conventional C) Refinancings D) Home Improvement Loans E) Loans on Dwellings For 5+ Families F) Non-occupant Loans on Number Average Value Number Average Value Number Average Value Number Average Value Number Average Value Number Average Value
LOANS ORIGINATED 61 $217,146 1,516 $193,673 6,502 $183,686 145 $57,999 10 $1,039,281 400 $158,525 APPLICATIONS APPROVED, NOT ACCEPTED 6 $223,413 373 $184,241 1,152 $187,919 42 $61,481 2 $191,010 145 $178,966 APPLICATIONS DENIED 12 $206,412 464 $176,732 2,396 $188,560 203 $59,607 3 $271,667 163 $168,384 APPLICATIONS WITHDRAWN 8 $187,472 315 $206,161 1,598 $188,798 53 $64,777 0 $0 71 $159,037 FILES CLOSED FOR INCOMPLETENESS 9 $201,402 57 $205,513 343 $183,519 13 $33,125 0 $0 26 $153,993
Aggregated Statistics For Year 2002(Based on 11 full and 4 partial tracts) A) FHA, FSA/RHS & VA B) Conventional C) Refinancings D) Home Improvement Loans E) Loans on Dwellings For 5+ Families F) Non-occupant Loans on Number Average Value Number Average Value Number Average Value Number Average Value Number Average Value Number Average Value
LOANS ORIGINATED 157 $184,236 868 $158,935 3,316 $164,716 94 $43,004 7 $598,794 187 $144,533 APPLICATIONS APPROVED, NOT ACCEPTED 15 $173,284 174 $171,993 602 $168,061 27 $38,717 1 $229,210 42 $166,325 APPLICATIONS DENIED 18 $177,389 299 $150,467 1,348 $164,938 140 $41,044 1 $650,000 73 $142,181 APPLICATIONS WITHDRAWN 33 $171,978 155 $169,132 944 $169,824 49 $44,846 1 $235,090 38 $136,154 FILES CLOSED FOR INCOMPLETENESS 4 $154,750 54 $176,525 496 $176,976 3 $49,693 3 $450,187 18 $138,814
Aggregated Statistics For Year 2001(Based on 11 full and 4 partial tracts) A) FHA, FSA/RHS & VA B) Conventional C) Refinancings D) Home Improvement Loans E) Loans on Dwellings For 5+ Families F) Non-occupant Loans on Number Average Value Number Average Value Number Average Value Number Average Value Number Average Value Number Average Value
LOANS ORIGINATED 245 $170,688 767 $208,607 2,280 $150,992 112 $23,833 5 $779,150 174 $137,930 APPLICATIONS APPROVED, NOT ACCEPTED 29 $178,586 159 $152,140 464 $145,303 27 $34,091 0 $0 31 $133,674 APPLICATIONS DENIED 45 $155,577 306 $131,577 1,409 $142,904 205 $26,307 1 $204,860 68 $131,492 APPLICATIONS WITHDRAWN 47 $170,351 174 $150,993 847 $149,940 74 $41,489 1 $282,110 40 $141,695 FILES CLOSED FOR INCOMPLETENESS 5 $198,602 34 $133,809 326 $159,491 10 $56,917 2 $1,559,000 10 $110,624
Aggregated Statistics For Year 2000(Based on 11 full and 4 partial tracts) A) FHA, FSA/RHS & VA B) Conventional C) Refinancings D) Home Improvement Loans E) Loans on Dwellings For 5+ Families F) Non-occupant Loans on Number Average Value Number Average Value Number Average Value Number Average Value Number Average Value Number Average Value
LOANS ORIGINATED 266 $161,695 673 $141,061 805 $128,049 108 $28,825 6 $535,797 75 $115,356 APPLICATIONS APPROVED, NOT ACCEPTED 33 $159,358 103 $134,026 199 $121,751 87 $33,769 0 $0 13 $91,066 APPLICATIONS DENIED 60 $162,778 333 $122,585 809 $135,137 197 $24,783 3 $386,800 32 $116,483 APPLICATIONS WITHDRAWN 49 $167,217 220 $158,676 363 $112,180 33 $27,011 1 $395,000 22 $99,578 FILES CLOSED FOR INCOMPLETENESS 14 $144,020 37 $143,164 273 $149,130 0 $0 1 $118,000 17 $122,402
Aggregated Statistics For Year 1999(Based on 12 full and 7 partial tracts) A) FHA, FSA/RHS & VA B) Conventional C) Refinancings D) Home Improvement Loans E) Loans on Dwellings For 5+ Families F) Non-occupant Loans on Number Average Value Number Average Value Number Average Value Number Average Value Number Average Value Number Average Value
LOANS ORIGINATED 391 $147,497 590 $126,805 1,288 $124,704 215 $19,302 8 $124,216 110 $96,914 APPLICATIONS APPROVED, NOT ACCEPTED 32 $137,155 108 $120,803 359 $120,466 101 $23,225 6 $127,875 23 $112,040 APPLICATIONS DENIED 66 $170,090 273 $103,240 1,116 $117,111 239 $22,287 5 $1,573,790 62 $111,889 APPLICATIONS WITHDRAWN 55 $140,423 180 $114,091 617 $125,145 27 $53,648 2 $1,082,350 54 $126,769 FILES CLOSED FOR INCOMPLETENESS 13 $158,418 28 $112,816 373 $133,445 8 $33,088 1 $91,310 20 $134,812
Detailed mortgage data for all 18 tracts in Carson, CA
Private Mortgage Insurance Companies Aggregated Statistics For Year 2009(Based on 13 full and 4 partial tracts) A) Conventional B) Refinancings C) Non-occupant Loans on Number Average Value Number Average Value Number Average Value
LOANS ORIGINATED 45 $296,681 13 $323,479 0 $0 APPLICATIONS APPROVED, NOT ACCEPTED 34 $283,336 12 $365,607 0 $0 APPLICATIONS DENIED 20 $285,190 9 $321,446 4 $280,750 APPLICATIONS WITHDRAWN 2 $310,000 1 $279,000 0 $0 FILES CLOSED FOR INCOMPLETENESS 3 $340,647 1 $308,000 0 $0
Aggregated Statistics For Year 2008(Based on 14 full and 4 partial tracts) A) Conventional B) Refinancings C) Non-occupant Loans on Number Average Value Number Average Value Number Average Value
LOANS ORIGINATED 123 $347,539 55 $379,695 1 $511,980 APPLICATIONS APPROVED, NOT ACCEPTED 62 $386,630 53 $405,852 4 $322,342 APPLICATIONS DENIED 25 $368,588 17 $384,819 5 $354,350 APPLICATIONS WITHDRAWN 11 $378,076 12 $378,107 0 $0 FILES CLOSED FOR INCOMPLETENESS 3 $367,333 1 $308,000 0 $0
Aggregated Statistics For Year 2007(Based on 14 full and 4 partial tracts) A) Conventional B) Refinancings C) Non-occupant Loans on Number Average Value Number Average Value Number Average Value
LOANS ORIGINATED 43 $410,326 73 $448,587 3 $317,667 APPLICATIONS APPROVED, NOT ACCEPTED 11 $370,048 27 $479,235 4 $403,000 APPLICATIONS DENIED 10 $372,137 10 $520,115 2 $437,050 APPLICATIONS WITHDRAWN 1 $334,690 15 $470,706 0 $0 FILES CLOSED FOR INCOMPLETENESS 0 $0 0 $0 0 $0
Aggregated Statistics For Year 2006(Based on 13 full and 4 partial tracts) A) Conventional B) Refinancings C) Non-occupant Loans on Number Average Value Number Average Value Number Average Value
LOANS ORIGINATED 17 $393,529 38 $404,088 4 $347,812 APPLICATIONS APPROVED, NOT ACCEPTED 5 $377,466 15 $390,527 0 $0 APPLICATIONS DENIED 1 $602,000 6 $449,795 0 $0 APPLICATIONS WITHDRAWN 0 $0 3 $456,667 0 $0 FILES CLOSED FOR INCOMPLETENESS 0 $0 1 $445,000 0 $0
Aggregated Statistics For Year 2005(Based on 14 full and 4 partial tracts) A) Conventional B) Refinancings C) Non-occupant Loans on Number Average Value Number Average Value Number Average Value
LOANS ORIGINATED 29 $297,897 53 $360,538 4 $244,728 APPLICATIONS APPROVED, NOT ACCEPTED 11 $282,745 14 $283,917 1 $342,000 APPLICATIONS DENIED 1 $455,000 2 $445,000 1 $455,000 APPLICATIONS WITHDRAWN 3 $416,667 6 $368,775 1 $378,000 FILES CLOSED FOR INCOMPLETENESS 0 $0 1 $352,000 0 $0
Aggregated Statistics For Year 2004(Based on 14 full and 4 partial tracts) A) Conventional B) Refinancings C) Non-occupant Loans on Number Average Value Number Average Value Number Average Value
LOANS ORIGINATED 79 $293,080 50 $282,315 7 $241,050 APPLICATIONS APPROVED, NOT ACCEPTED 42 $296,472 41 $235,486 0 $0 APPLICATIONS DENIED 2 $303,215 1 $274,000 0 $0 APPLICATIONS WITHDRAWN 12 $272,746 7 $263,290 0 $0 FILES CLOSED FOR INCOMPLETENESS 3 $369,147 5 $208,718 0 $0
Aggregated Statistics For Year 2003(Based on 14 full and 4 partial tracts) A) Conventional B) Refinancings C) Non-occupant Loans on Number Average Value Number Average Value Number Average Value
LOANS ORIGINATED 209 $237,991 195 $230,711 12 $197,289 APPLICATIONS APPROVED, NOT ACCEPTED 57 $226,049 97 $228,776 4 $211,802 APPLICATIONS DENIED 1 $270,000 1 $241,800 0 $0 APPLICATIONS WITHDRAWN 14 $279,589 13 $215,765 4 $189,322 FILES CLOSED FOR INCOMPLETENESS 0 $0 1 $184,710 0 $0
Aggregated Statistics For Year 2002(Based on 11 full and 4 partial tracts) A) Conventional B) Refinancings C) Non-occupant Loans on Number Average Value Number Average Value Number Average Value
LOANS ORIGINATED 226 $206,422 194 $207,141 8 $184,528 APPLICATIONS APPROVED, NOT ACCEPTED 62 $205,394 114 $199,684 7 $159,071 APPLICATIONS DENIED 7 $218,473 7 $184,317 2 $82,145 APPLICATIONS WITHDRAWN 15 $180,462 20 $227,138 1 $217,210 FILES CLOSED FOR INCOMPLETENESS 5 $221,846 3 $205,000 1 $146,000
Aggregated Statistics For Year 2001(Based on 11 full and 4 partial tracts) A) Conventional B) Refinancings C) Non-occupant Loans on Number Average Value Number Average Value Number Average Value
LOANS ORIGINATED 204 $196,366 229 $190,924 10 $156,346 APPLICATIONS APPROVED, NOT ACCEPTED 54 $191,549 82 $187,364 0 $0 APPLICATIONS DENIED 11 $187,845 15 $194,913 2 $145,005 APPLICATIONS WITHDRAWN 6 $223,815 8 $166,696 1 $126,680 FILES CLOSED FOR INCOMPLETENESS 1 $271,190 5 $187,004 0 $0
Aggregated Statistics For Year 2000(Based on 11 full and 4 partial tracts) A) Conventional B) Refinancings C) Non-occupant Loans on Number Average Value Number Average Value Number Average Value
LOANS ORIGINATED 171 $182,542 106 $162,627 3 $105,773 APPLICATIONS APPROVED, NOT ACCEPTED 40 $169,116 34 $175,225 1 $147,000 APPLICATIONS DENIED 16 $178,416 9 $197,497 0 $0 APPLICATIONS WITHDRAWN 6 $178,055 5 $161,474 1 $145,000 FILES CLOSED FOR INCOMPLETENESS 4 $125,938 4 $134,252 0 $0
Aggregated Statistics For Year 1999(Based on 12 full and 7 partial tracts) A) Conventional B) Refinancings C) Non-occupant Loans on Number Average Value Number Average Value Number Average Value
LOANS ORIGINATED 189 $149,657 219 $156,479 3 $120,880 APPLICATIONS APPROVED, NOT ACCEPTED 29 $165,332 62 $158,005 2 $69,245 APPLICATIONS DENIED 17 $147,165 25 $167,718 0 $0 APPLICATIONS WITHDRAWN 11 $147,805 14 $145,369 0 $0 FILES CLOSED FOR INCOMPLETENESS 2 $219,880 7 $158,951 1 $126,880
Fire-safe hotels and motels in Carson, California:
Econo Lodge, 1325 E Carson St, Carson, California 90745 Phone: (310) 830-8044, Fax: (310) 518-5575
Doubletree By Hilton Carson, 2 Civic Plaza Dr, Carson, California 90745 Phone: (310) 830-9200, Fax: (310) 518-2969
Clarion Hotel South Bay, 888 E Dominguez St, Carson, California 90746 Phone: (310) 715-6688, Fax: (310) 856-0755
Extended Stay America - Los Angeles - Carson, 401 E Albertoni St, Carson, California 90746 Phone: (310) 323-2080, Fax: (310) 323-2092
All 4 fire-safe hotels and motels in Carson, California
Most common first names in Carson, CA among deceased individuals Name Count Lived (average)
John 228 70.6 years James 222 70.6 years Mary 218 75.9 years Robert 176 66.9 years William 175 70.6 years George 124 74.8 years Charles 116 68.8 years Helen 95 75.4 years Maria 93 77.0 years Jose 87 73.5 years
Most common last names in Carson, CA among deceased individuals Last name Count Lived (average)
Smith 107 72.6 years Johnson 107 71.6 years Williams 92 70.5 years Brown 79 71.0 years Jones 60 69.9 years Garcia 56 71.0 years Davis 50 70.3 years Miller 45 73.6 years Thomas 42 69.9 years Rodriguez 41 72.7 years
Carson compared to California state average:
Unemployed percentage below state average. Black race population percentage significantly above state average. Median age above state average. Renting percentage below state average. Carson, CA compared to other similar cities:
#8 on the list of "Top 101 cities with largest percentage of females in occupations: fire fighting and prevention workers including supervisors (population 50,000+)"
#15 on the list of "Top 101 cities with largest percentage of males in industries: health care and social assistance (population 50,000+)"
#17 on the list of "Top 101 cities with largest percentage of males in occupations: health technologists and technicians (population 50,000+)"
#18 on the list of "Top 101 cities with largest percentage of females in industries: transportation and warehousing (population 50,000+)"
#19 on the list of "Top 101 cities with largest percentage of females in occupations: health technologists and technicians (population 50,000+)"
#23 on the list of "Top 101 cities with largest percentage of males in industries: other services, except public administration (population 50,000+)"
#28 on the list of "Top 101 cities with the highest ratio of murders to rapes between 2002 and 2012 (population 50,000+)"
#31 on the list of "Top 101 cities with largest percentage of males in occupations: office and administrative support occupations (population 50,000+)"
#31 on the list of "Top 101 cities with the most residents born in Philippines (population 500+)"
#32 on the list of "Top 100 most racially diverse cities (pop. 50,000+)"
#39 on the list of "Top 101 cities with largest percentage of males in industries: transportation and warehousing (population 50,000+)"
#41 on the list of "Top 101 cities with the smallest temperature differences during a year (population 50,000+)"
#47 on the list of "Top 101 cities with largest percentage of males in occupations: education, training, and library occupations (population 50,000+)"
#47 on the list of "Top 101 cities with largest percentage of females in industries: manufacturing (population 50,000+)"
#48 on the list of "Top 101 cities where residents moved in more then 10 years ago (10,000+ households)"
#50 on the list of "Top 101 cities with the most residents born in South Eastern Asia (population 500+)"
#52 on the list of "Top 100 low-educated but high-earning cities (pop. 50,000+)"
#55 on the list of "Top 101 cities with the most cars per house, population 50,000+"
#56 on the list of "Top 101 cities with largest percentage of males in occupations: personal care and service occupations (population 50,000+)"
#71 on the list of "Top 101 cities with the largest city-data.com crime index increase from 2011 to 2012 (population 50,000+)"
#22 (90248) on the list of "Top 101 zip codes with the largest percentage of Scottish first ancestries (pop 5,000+)"
#24 (90746) on the list of "Top 101 zip codes with the largest percentage of Subsaharan African first ancestries"
#85 (90744) on the list of "Top 101 zip codes with the largest percentage of taxpayers using paid preparers for 2012 taxes (pop 5,000+)"
#1 on the list of "Top 101 counties with the most Evangelical Protestant congregations"
#1 on the list of "Top 101 counties with the most Mainline Protestant congregations"
#1 on the list of "Top 101 counties with the most Orthodox adherents"
#1 on the list of "Top 101 counties with the highest ground withdrawal of fresh water for public supply (pop. 50,000+)"
#1 on the list of "Top 101 counties with the most Catholic adherents (pop. 50,000+)"
Top Patent Applicants
Michael D. Danesh (8)
Yue Fu (8)
Bill Nguyen (7)
Cameron A. Riddell (6)
Allison Bajo (6)
Sheldon Vilhauer (6)
Mingfu Liu (5)
Rowel C. Go (5)
James Victor Cragg (4)
Brian S. Kim (3)
Total of 149 patent applications in 2008-2025.


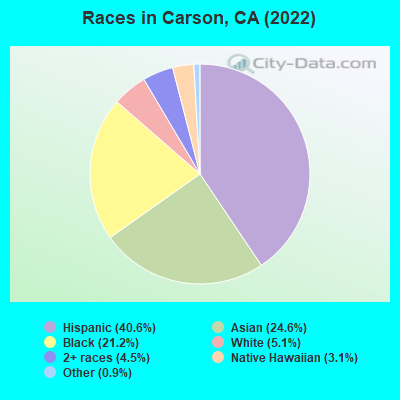
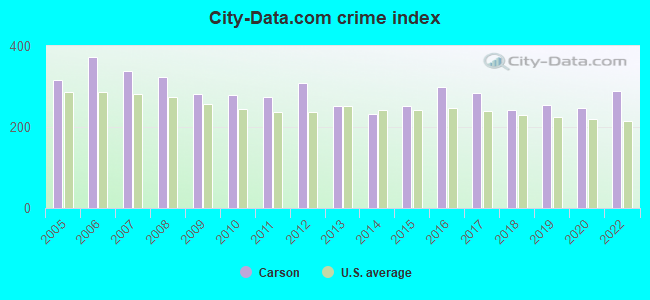
 Recent articles from our blog. Our writers, many of them Ph.D. graduates or candidates, create easy-to-read articles on a wide variety of topics.


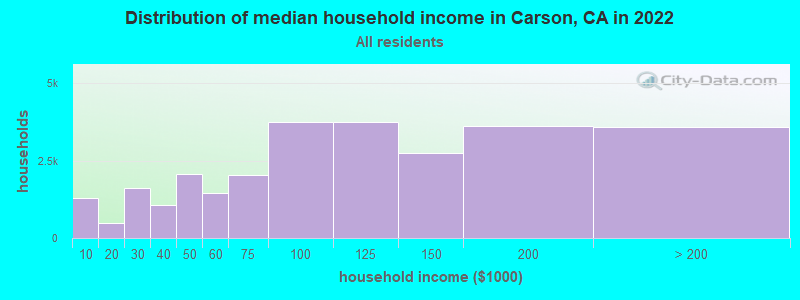
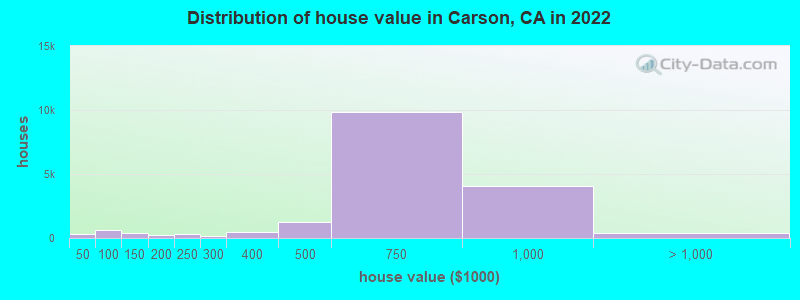
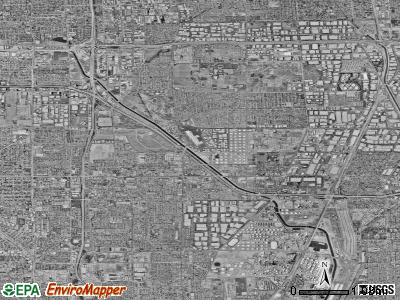
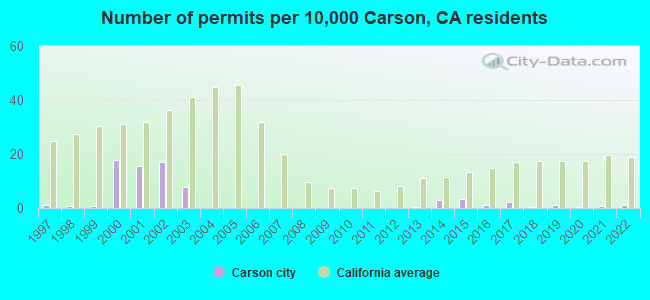
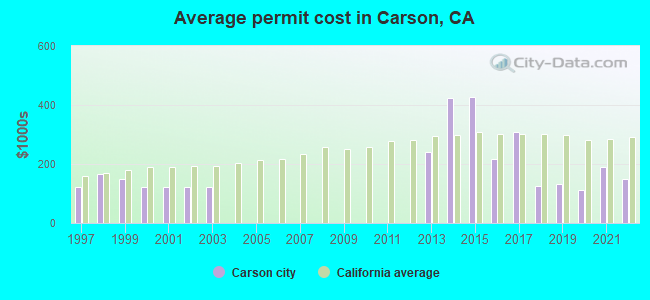
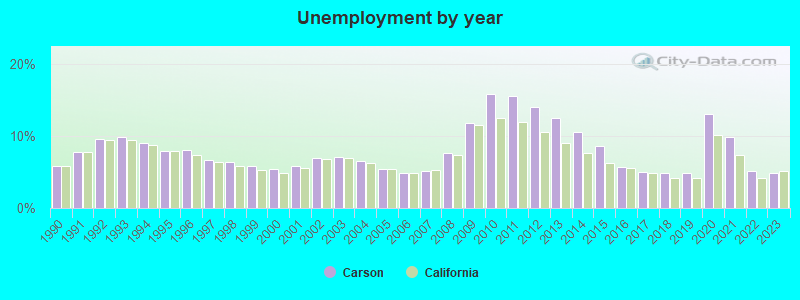
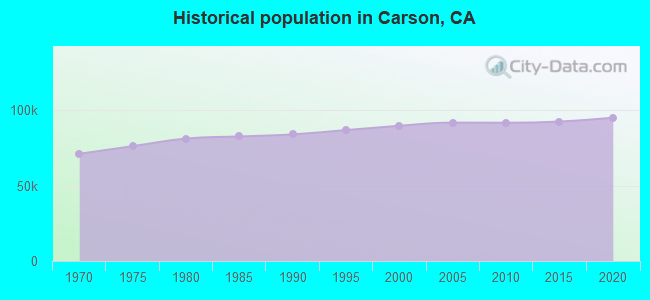
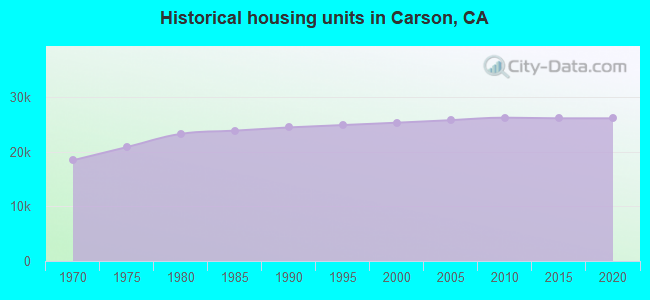
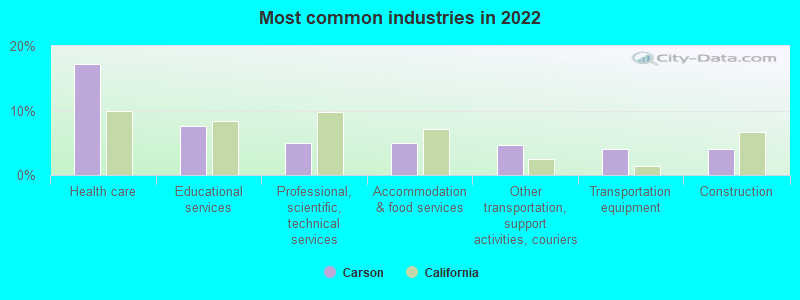
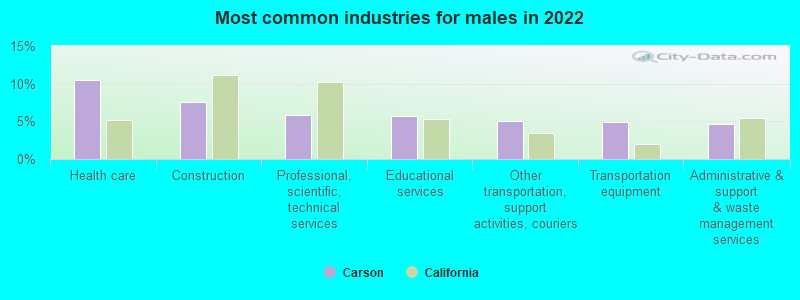
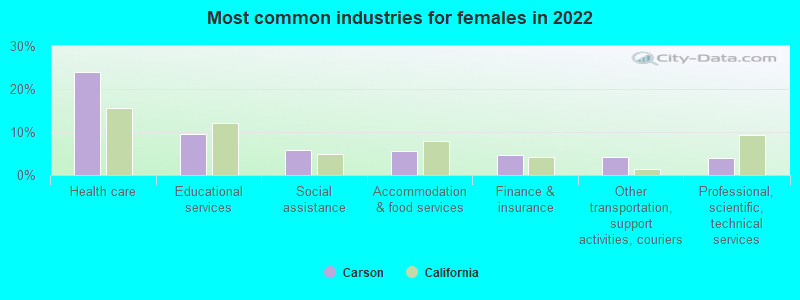
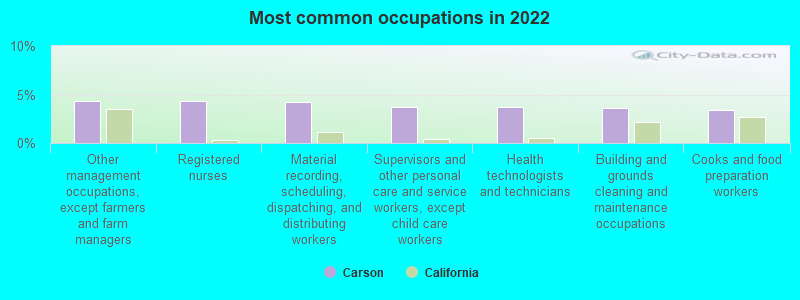
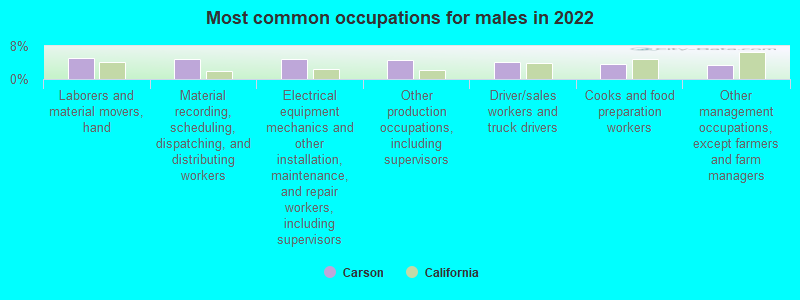
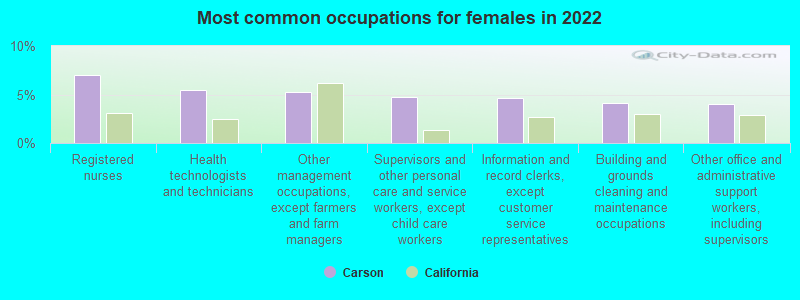
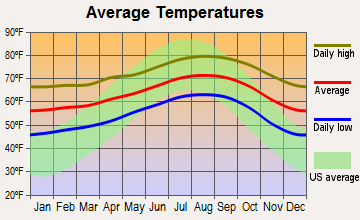
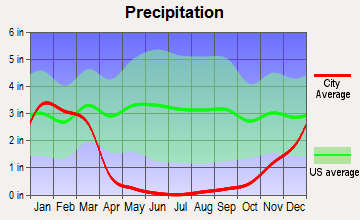
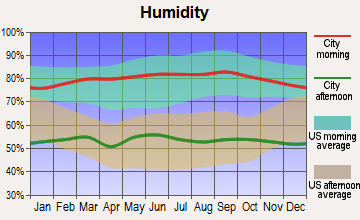
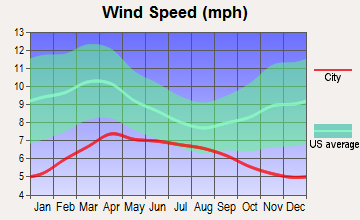
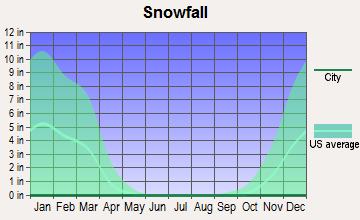
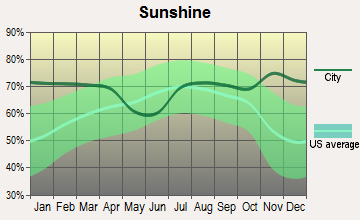
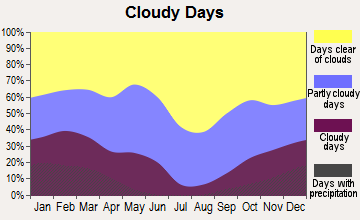
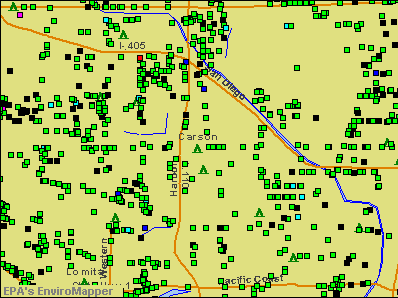

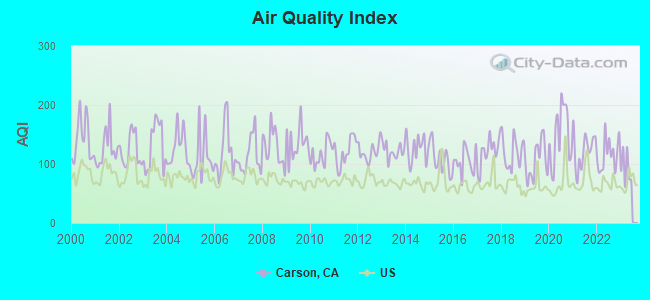
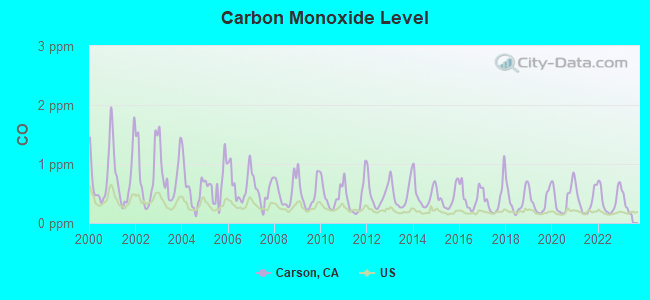
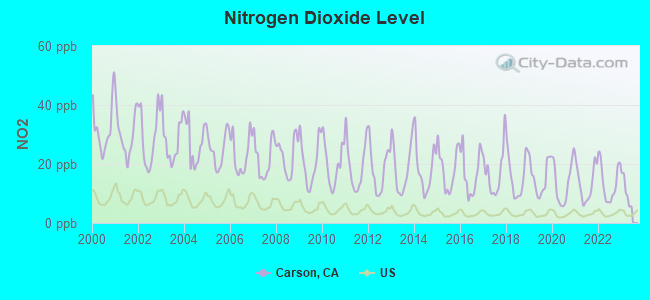
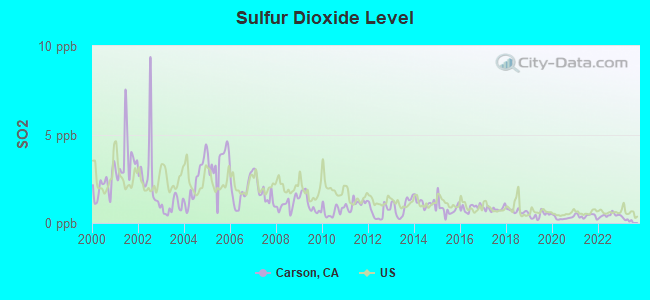
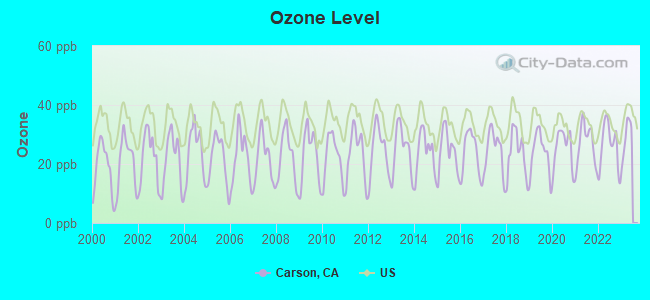

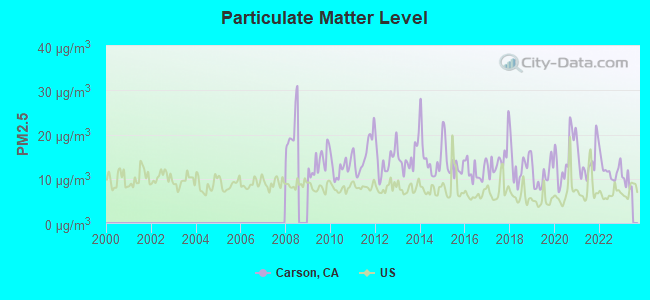
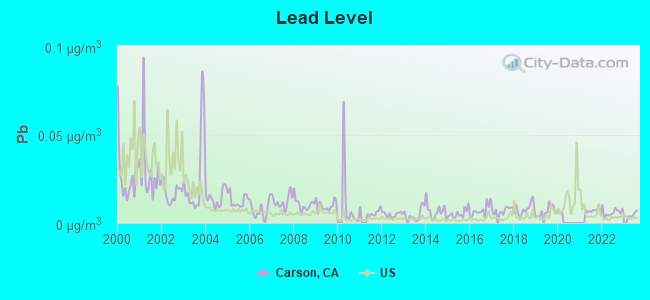

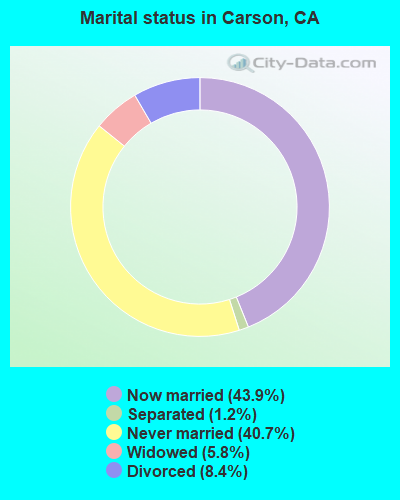
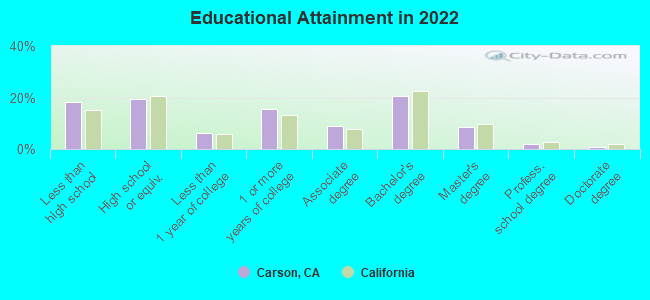
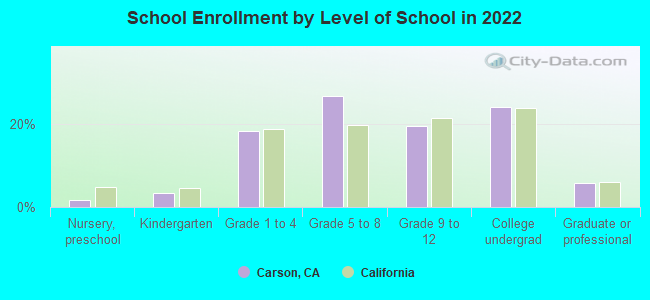
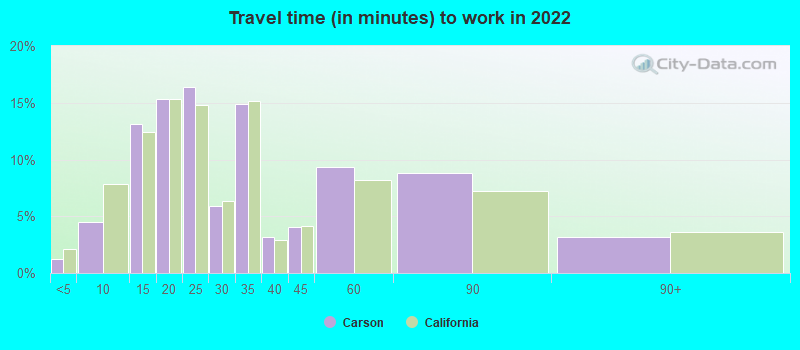
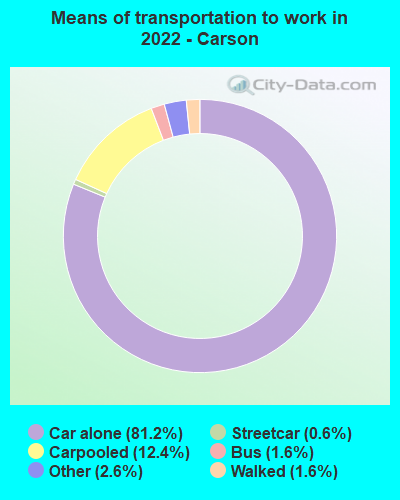


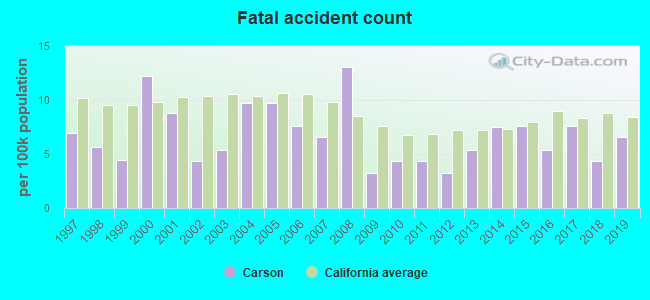
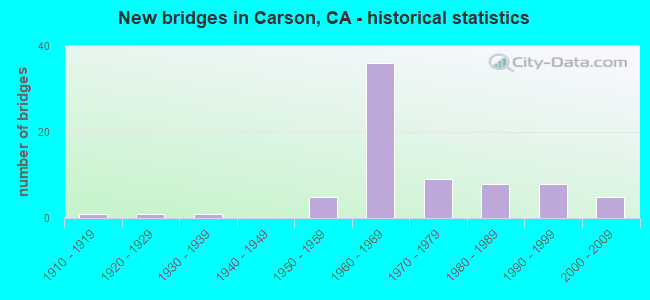
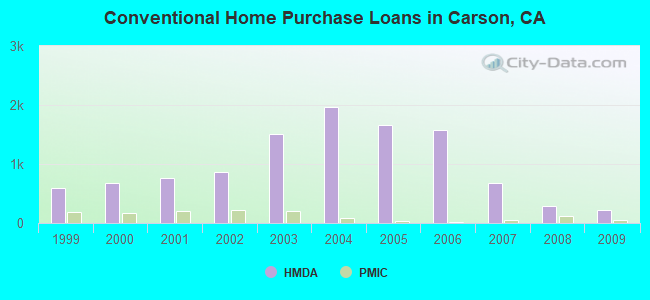
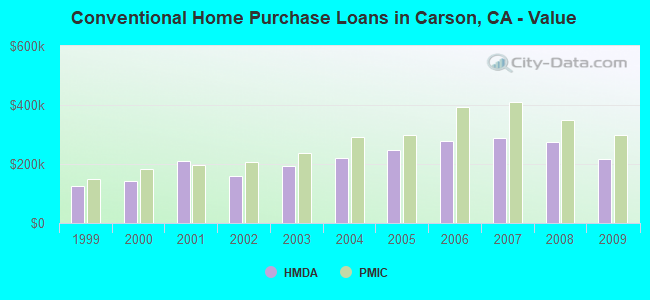
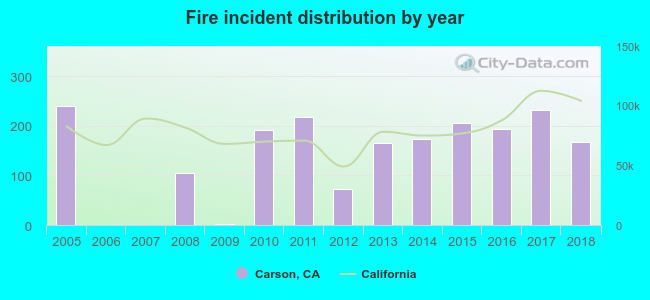 Based on the data from the years 2005 - 2018 the average number of fire incidents per year is 141. The highest number of fires - 241 took place in 2005, and the least - 0 in 2006. The data has a dropping trend.
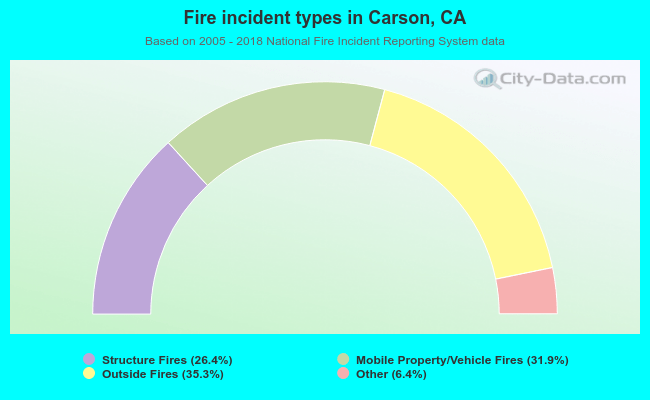 When looking into fire subcategories, the most reports belonged to: Outside Fires (35.3%), and Mobile Property/Vehicle Fires (31.9%).