Fairhope, Alabama

Fairhope: HomemadeTotem Pole at Arts Center

Fairhope: Sunset from Fairhope Park2

Fairhope: Market Lady Downtown Fairhope

Fairhope: Fairhope park on Mobile Bay2

Fairhope: Fairhope park on Mobile Bay

Fairhope: A Seahorse overlooking Fairhope Pier

Fairhope: Fairhope Fountain at park

Fairhope: The Dolphin Marble Display

Fairhope: Sea Bum by the Bay

Fairhope: Dowtown Fairhope Artist

Fairhope: Fairhope Pier from hill top
- see
51
more - add
your
Submit your own pictures of this city and show them to the world
- OSM Map
- General Map
- Google Map
- MSN Map

Population change since 2000: +91.2%
| Males: 11,387 | |
| Females: 12,472 |
| Median resident age: | 47.7 years |
| Alabama median age: | 39.6 years |
Zip codes: 36559.
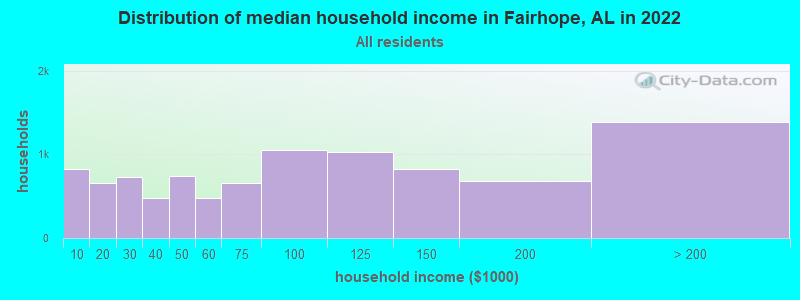
| Fairhope: | $84,083 |
| AL: | $62,212 |
Estimated per capita income in 2023: $53,091 (it was $25,237 in 2000)
Fairhope city income, earnings, and wages data
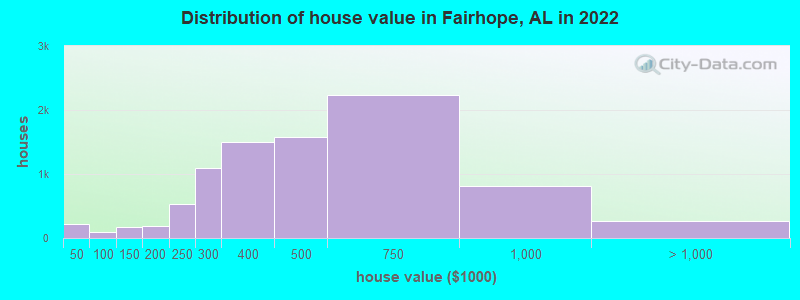
Estimated median house or condo value in 2023: $434,828 (it was $139,700 in 2000)
| Fairhope: | $434,828 |
| AL: | $216,600 |
Mean prices in 2023: all housing units: $456,624; detached houses: $468,725; townhouses or other attached units: $288,125; in 3-to-4-unit structures: $73,362; in 5-or-more-unit structures: $626,931; mobile homes: $74,851
Median gross rent in 2023: $1,738.
(9.2% for White Non-Hispanic residents, 29.7% for Black residents, 5.0% for Hispanic or Latino residents, 9.2% for American Indian residents, 2.8% for other race residents, 10.5% for two or more races residents)
Detailed information about poverty and poor residents in Fairhope, AL


Compare current foreclosures in Fairhope, AL:
| Photo | Address | Area | Beds / Baths | Price | Details |
|---|---|---|---|---|---|

|
#1
Caye Falls St
Fairhope, AL 36532
|
1,955 sq. feet
|
2 baths 3 beds |
show details | |

|
#2
Mockingbird Ln
Fairhope, AL 36532
|
1,739 sq. feet
|
1 baths 3 beds |
show details | |

|
#3
Greeno Rd
Fairhope, AL 36532
|
800 sq. feet
|
1 baths 1 beds |
show details | |

|
#4
Woodmere Dr
Fairhope, AL 36532
|
1,431 sq. feet
|
1 baths 3 beds |
show details | |

|
#5
S Mobile St Apt 41
Fairhope, AL 36532
|
2,436 sq. feet
|
2 baths 2 beds |
show details | |

|
#6
Perryman Pl
Fairhope, AL 36532
|
1,996 sq. feet
|
2 baths 3 beds |
show details | |

|
#7
Bay Meadows Ave
Fairhope, AL 36532
|
1,996 sq. feet
|
1 baths 3 beds |
show details | |

|
#8
Paddock Dr
Fairhope, AL 36532
|
1,355 sq. feet
|
1 baths 3 beds |
show details | |

|
#9
Crystal Wells Ct S
Fairhope, AL 36532
|
1,334 sq. feet
|
2 baths 3 beds |
show details | |

|
#10
Silverwood Dr
Fairhope, AL 36532
|
1,492 sq. feet
|
1 baths 3 beds |
show details |
| Photo | Address | Area | Beds / Baths | Price | Details |
|---|---|---|---|---|---|

|
#11
Patlynn Dr
Fairhope, AL 36532
|
2,142 sq. feet
|
1 baths 3 beds |
show details | |

|
#12
Thompson Hall Rd
Fairhope, AL 36532
|
1,760 sq. feet
|
1 baths - beds |
show details | |

|
#13
Azalea St
Fairhope, AL 36532
|
1,368 sq. feet
|
- baths 2 beds |
show details | |

|
#14
Greeno Ln
Fairhope, AL 36532
|
1,852 sq. feet
|
- baths 3 beds |
show details | |

|
#15
Frego Ln
Fairhope, AL 36532
|
2,173 sq. feet
|
- baths 3 beds |
show details | |

|
#16
Hawthorne Cir
Fairhope, AL 36532
|
1,771 sq. feet
|
- baths 3 beds |
show details | |

|
#17
Danne Rd
Fairhope, AL 36532
|
3,222 sq. feet
|
3 baths - beds |
show details | |

|
#18
Petz Ave
Fairhope, AL 36532
|
1,788 sq. feet
|
2 baths - beds |
show details | |

|
#19
Heard Rd
Fairhope, AL 36532
|
816 sq. feet
|
- baths 3 beds |
show details | |

|
#20
Kirkman Ln
Fairhope, AL 36532
|
1,152 sq. feet
|
- baths 3 beds |
show details |
| Photo | Address | Area | Beds / Baths | Price | Details |
|---|---|---|---|---|---|

|
#21
Mckenzie Rd
Fairhope, AL 36532
|
1,697 sq. feet
|
- baths 3 beds |
show details | |

|
#22
Wisteria St
Fairhope, AL 36532
|
925 sq. feet
|
- baths 2 beds |
show details | |

|
#23
Yellow Rose Ln
Fairhope, AL 36532
|
- sq. feet
|
- baths - beds |
show details | |

|
#24
County Road 1
Fairhope, AL 36532
|
- sq. feet
|
- baths - beds |
show details | |

|
#25
Bartlett Ave
Fairhope, AL 36532
|
- sq. feet
|
- baths - beds |
show details | |

|
#26
Meadow Rd Lot 2
Fairhope, AL 36532
|
- sq. feet
|
- baths - beds |
show details | |

|
#27
Colony Dr
Fairhope, AL 36532
|
- sq. feet
|
- baths - beds |
show details | |

|
#28
Amador Ave
Fairhope, AL 36532
|
- sq. feet
|
- baths - beds |
show details | |

|
#29
Fairhope Ave Apt 1
Fairhope, AL 36532
|
- sq. feet
|
- baths - beds |
show details | |

|
#30
Section St
Fairhope, AL 36532
|
- sq. feet
|
- baths - beds |
show details |
| Photo | Address | Area | Beds / Baths | Price | Details |
|---|---|---|---|---|---|

|
#31
Spring Run Dr Apt 143
Fairhope, AL 36532
|
- sq. feet
|
- baths - beds |
show details | |

|
#32
Mcintosh Bluff Rd
Fairhope, AL 36532
|
- sq. feet
|
- baths - beds |
show details | |

|
#33
Breckin Dr
Fairhope, AL 36532
|
- sq. feet
|
- baths - beds |
show details | |

|
#34
Woodmere Dr
Fairhope, AL 36532
|
- sq. feet
|
- baths - beds |
show details | |

|
#35
Yosemite Blvd
Fairhope, AL 36532
|
- sq. feet
|
- baths - beds |
show details | |

|
#36
Mary Ann Beach Road Ext # A
Fairhope, AL 36532
|
- sq. feet
|
- baths - beds |
show details | |

|
#37
Twin Beech Rd Apt 1203
Fairhope, AL 36532
|
- sq. feet
|
- baths - beds |
show details | |

|
#38
County Road 13
Fairhope, AL 36532
|
- sq. feet
|
- baths - beds |
show details | |

|
#39
Whittington Ave
Fairhope, AL 36532
|
- sq. feet
|
- baths - beds |
show details | |

|
#40
Truxton St
Fairhope, AL 36532
|
- sq. feet
|
- baths - beds |
show details |
| Photo | Address | Area | Beds / Baths | Price | Details |
|---|---|---|---|---|---|

|
#41
Danne Ln
Fairhope, AL 36532
|
- sq. feet
|
- baths - beds |
show details | |

|
#42
South Dr
Fairhope, AL 36532
|
- sq. feet
|
- baths - beds |
show details | |

|
#43
Spring Run Dr Apt 109
Fairhope, AL 36532
|
- sq. feet
|
- baths - beds |
show details | |

|
#44
Meadow Rd Lot 16
Fairhope, AL 36532
|
- sq. feet
|
- baths - beds |
show details | |

|
#45
Frank Sledge Ln
Fairhope, AL 36532
|
- sq. feet
|
- baths - beds |
show details | |

|
#46
Mandrell Ln
Fairhope, AL 36532
|
1,653 sq. feet
|
- baths - beds |
show details | |

|
#47
Fly Creek Ave, Unit 3317
Fairhope, AL 36532
|
- sq. feet
|
- baths - beds |
show details | |

|
#48
County Road 3
Fairhope, AL 36532
|
- sq. feet
|
- baths - beds |
show details | |

|
#49
Pandion Rdg
Fairhope, AL 36532
|
1,422 sq. feet
|
- baths - beds |
show details | |

|
Check over 1 million property listings on Foreclosure.com!
|
browse all offers | |||


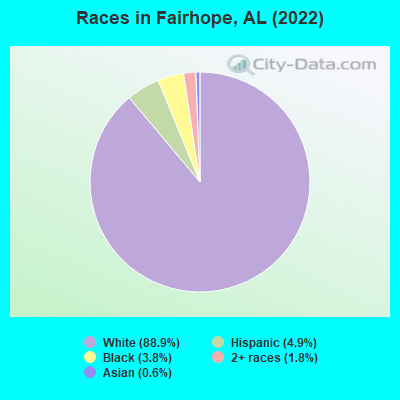
- 21,34086.5%White alone
- 1,8107.3%Hispanic
- 7643.1%Black alone
- 3981.6%Two or more races
- 1760.7%Asian alone
- 1230.5%American Indian alone
- 760.3%Native Hawaiian and Other
Pacific Islander alone
Races in Fairhope detailed stats: ancestries, foreign born residents, place of birth
According to our research of Alabama and other state lists, there were 25 registered sex offenders living in Fairhope, Alabama as of April 26, 2025.
The ratio of all residents to sex offenders in Fairhope is 723 to 1.
The ratio of registered sex offenders to all residents in this city is lower than the state average.
Type |
2010 |
2011 |
2012 |
2013 |
2014 |
2015 |
2016 |
2017 |
2018 |
2019 |
2020 |
2021 |
2022 |
2023 |
|---|---|---|---|---|---|---|---|---|---|---|---|---|---|---|
| Murders (per 100,000) | 1 (6.5) | 1 (6.5) | 1 (6.3) | 0 (0.0) | 0 (0.0) | 0 (0.0) | 0 (0.0) | 0 (0.0) | 0 (0.0) | 0 (0.0) | 0 (0.0) | 0 (0.0) | 1 (4.2) | 0 (0.0) |
| Rapes (per 100,000) | 3 (19.6) | 4 (26.0) | 2 (12.7) | 6 (35.6) | 3 (16.7) | 2 (10.6) | 4 (20.5) | 6 (29.7) | 16 (73.8) | 5 (21.8) | 2 (8.5) | 6 (24.5) | 5 (21.1) | 4 (16.3) |
| Robberies (per 100,000) | 4 (26.1) | 9 (58.4) | 5 (31.7) | 6 (35.6) | 7 (39.1) | 4 (21.3) | 6 (30.8) | 4 (19.8) | 3 (13.8) | 5 (21.8) | 3 (12.8) | 1 (4.1) | 3 (12.6) | 1 (4.1) |
| Assaults (per 100,000) | 2 (13.0) | 32 (207.8) | 35 (222.0) | 28 (166.2) | 44 (245.6) | 33 (175.3) | 26 (133.5) | 42 (208.1) | 24 (110.7) | 21 (91.6) | 11 (46.8) | 13 (53.1) | 33 (139.0) | 39 (159.4) |
| Burglaries (per 100,000) | 94 (613.3) | 124 (805.2) | 131 (830.9) | 144 (854.8) | 111 (619.6) | 85 (451.6) | 84 (431.4) | 89 (441.0) | 57 (262.8) | 36 (157.0) | 2 (8.5) | 7 (28.6) | 42 (176.9) | 41 (167.6) |
| Thefts (per 100,000) | 443 (2,891) | 492 (3,195) | 503 (3,190) | 515 (3,057) | 443 (2,473) | 413 (2,194) | 541 (2,779) | 490 (2,428) | 449 (2,070) | 229 (998.6) | 87 (369.9) | 113 (461.8) | 282 (1,188) | 267 (1,091) |
| Auto thefts (per 100,000) | 6 (39.1) | 9 (58.4) | 15 (95.1) | 19 (112.8) | 10 (55.8) | 20 (106.3) | 24 (123.3) | 27 (133.8) | 31 (142.9) | 18 (78.5) | 1 (4.3) | 8 (32.7) | 23 (96.9) | 17 (69.5) |
| Arson (per 100,000) | 0 (0.0) | 0 (0.0) | 7 (44.4) | 1 (5.9) | 1 (5.6) | 2 (10.6) | 3 (15.4) | 0 (0.0) | 2 (9.2) | 1 (4.4) | 2 (8.5) | 1 (4.1) | 3 (12.6) | 1 (4.1) |
| City-Data.com crime index | 200.8 | 281.7 | 270.1 | 263.5 | 221.0 | 177.8 | 203.6 | 210.1 | 197.9 | 99.5 | 35.7 | 54.6 | 124.5 | 107.1 |
The City-Data.com crime index weighs serious crimes and violent crimes more heavily. Higher means more crime, U.S. average is 240.7. It adjusts for the number of visitors and daily workers commuting into cities.
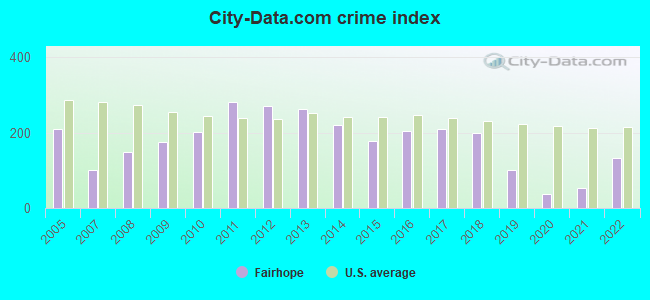
Crime rate in Fairhope detailed stats: murders, rapes, robberies, assaults, burglaries, thefts, arson
Full-time law enforcement employees in 2023, including police officers: 70 (46 officers - 43 male; 3 female).
| Officers per 1,000 residents here: | 1.88 |
| Alabama average: | 2.35 |
 Recent articles from our blog. Our writers, many of them Ph.D. graduates or candidates, create easy-to-read articles on a wide variety of topics.

 | Fairhope - A good alternative to high priced other Gulf Coast? (12 replies) |
| Fairhope - thinking about retiring there from the northeast (4 replies) |
| Never heard of FAIRHOPE and had no idea how cool that looks on Google Maps! (2 replies) |
| Mobile Area Real Estate (Mobile and Baldwin Counties) (175 replies) |
| Thoughts on Fairhope? (4 replies) |
| Fairhope (36532) Utilities (0 replies) |
Latest news from Fairhope, AL collected exclusively by city-data.com from local newspapers, TV, and radio stations
Ancestries: American (25.1%), English (19.6%), Irish (9.9%), German (8.9%), Italian (4.2%), European (3.0%).
Current Local Time: CST time zone
Elevation: 122 feet
Land area: 11.0 square miles.
Population density: 2,170 people per square mile (low).

984 residents are foreign born (2.1% Latin America, 1.5% Europe).
| This city: | 4.0% |
| Alabama: | 3.8% |
Median real estate property taxes paid for housing units with mortgages in 2023: $2,331 (0.5%)
Median real estate property taxes paid for housing units with no mortgage in 2023: $1,469 (0.4%)
Nearest city with pop. 50,000+: Mobile, AL (16.3 miles
, pop. 198,915).
Nearest city with pop. 200,000+: New Orleans, LA (134.8 miles
, pop. 484,674).
Nearest city with pop. 1,000,000+: Houston, TX (450.9 miles
, pop. 1,953,631).
Nearest cities:
Latitude: 30.53 N, Longitude: 87.90 W
Daytime population change due to commuting: +2,027 (+8.2%)
Workers who live and work in this city: 4,179 (41.4%)
Area code: 251

Fairhope tourist attractions:
Fairhope, Alabama accommodation & food services, waste management - Economy and Business Data
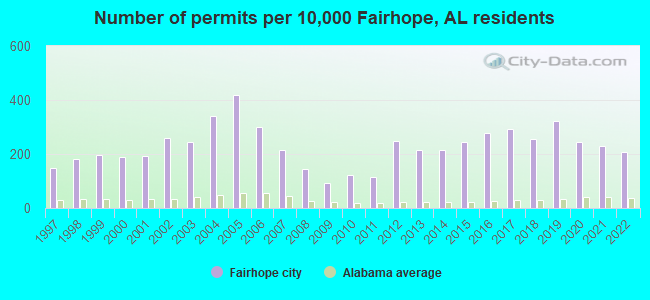
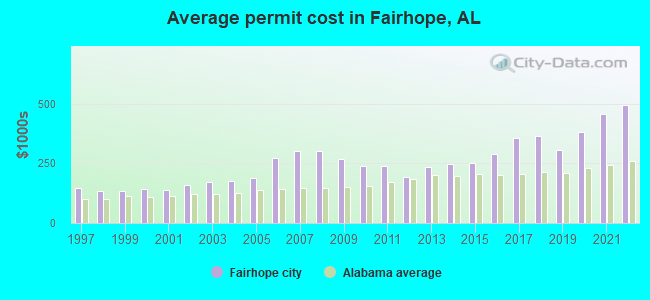
Single-family new house construction building permits:
- 2023: 296 buildings, average cost: $446,300
- 2022: 259 buildings, average cost: $494,900
- 2021: 288 buildings, average cost: $455,200
- 2020: 306 buildings, average cost: $381,900
- 2019: 404 buildings, average cost: $305,200
- 2018: 321 buildings, average cost: $363,400
- 2017: 367 buildings, average cost: $354,000
- 2016: 348 buildings, average cost: $286,700
- 2015: 303 buildings, average cost: $250,600
- 2014: 266 buildings, average cost: $245,200
- 2013: 268 buildings, average cost: $235,100
- 2012: 310 buildings, average cost: $192,200
- 2011: 144 buildings, average cost: $237,800
- 2010: 152 buildings, average cost: $239,100
- 2009: 113 buildings, average cost: $269,800
- 2008: 179 buildings, average cost: $301,500
- 2007: 266 buildings, average cost: $300,700
- 2006: 375 buildings, average cost: $272,600
- 2005: 520 buildings, average cost: $187,700
- 2004: 424 buildings, average cost: $175,000
- 2003: 304 buildings, average cost: $172,400
- 2002: 324 buildings, average cost: $157,900
- 2001: 238 buildings, average cost: $139,600
- 2000: 236 buildings, average cost: $141,600
- 1999: 247 buildings, average cost: $133,000
- 1998: 226 buildings, average cost: $133,800
- 1997: 184 buildings, average cost: $146,200
| Here: | 3.1% |
| Alabama: | 3.3% |
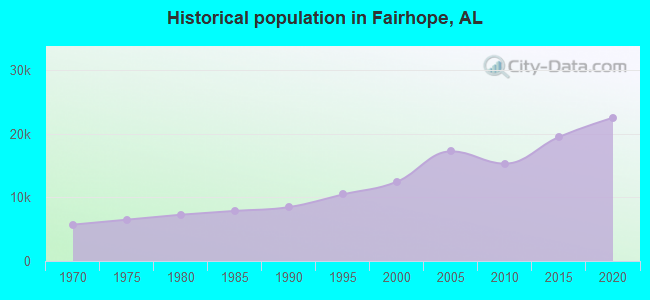
Population change in the 1990s: +3,173 (+34.1%).

- Health care & social assistance (20.5%)
- Construction (10.8%)
- Retail trade (9.0%)
- Manufacturing (8.7%)
- Professional, scientific, technical services (8.5%)
- Educational services (7.1%)
- Accommodation & food services (6.1%)

- Construction (16.8%)
- Health care & social assistance (15.6%)
- Manufacturing (13.1%)
- Professional, scientific, technical services (11.0%)
- Retail trade (7.3%)
- Arts, entertainment, recreation (5.1%)
- Accommodation & food services (4.5%)

- Health care & social assistance (25.8%)
- Educational services (13.6%)
- Retail trade (10.8%)
- Accommodation & food services (7.7%)
- Public administration (6.8%)
- Real estate & rental & leasing (6.1%)
- Professional, scientific, technical services (5.8%)
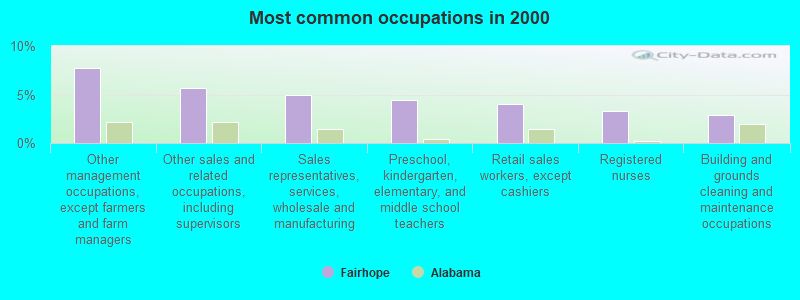
- Other management occupations, except farmers and farm managers (7.8%)
- Other sales and related occupations, including supervisors (5.7%)
- Sales representatives, services, wholesale and manufacturing (5.0%)
- Preschool, kindergarten, elementary, and middle school teachers (4.5%)
- Retail sales workers, except cashiers (4.0%)
- Registered nurses (3.2%)
- Building and grounds cleaning and maintenance occupations (2.9%)
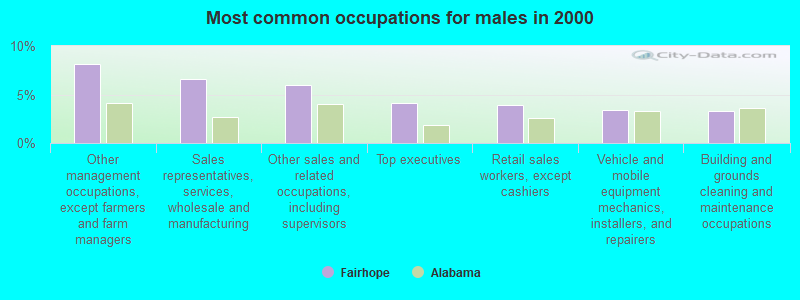
- Other management occupations, except farmers and farm managers (8.1%)
- Sales representatives, services, wholesale and manufacturing (6.6%)
- Other sales and related occupations, including supervisors (6.0%)
- Top executives (4.1%)
- Retail sales workers, except cashiers (3.9%)
- Vehicle and mobile equipment mechanics, installers, and repairers (3.4%)
- Building and grounds cleaning and maintenance occupations (3.3%)
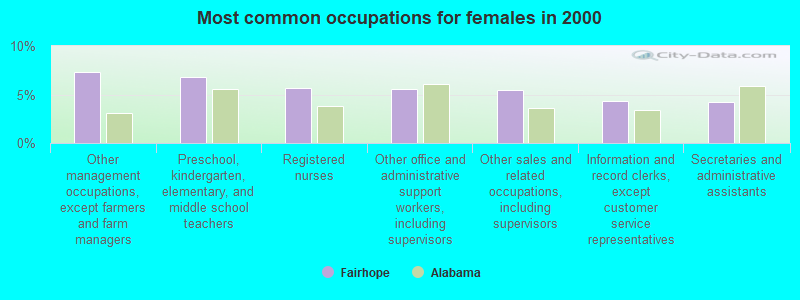
- Other management occupations, except farmers and farm managers (7.4%)
- Preschool, kindergarten, elementary, and middle school teachers (6.8%)
- Registered nurses (5.7%)
- Other office and administrative support workers, including supervisors (5.6%)
- Other sales and related occupations, including supervisors (5.4%)
- Information and record clerks, except customer service representatives (4.4%)
- Secretaries and administrative assistants (4.2%)
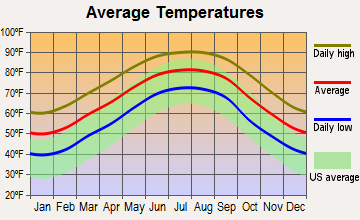
Average climate in Fairhope, Alabama
Based on data reported by over 4,000 weather stations


|
|

(lower is better)
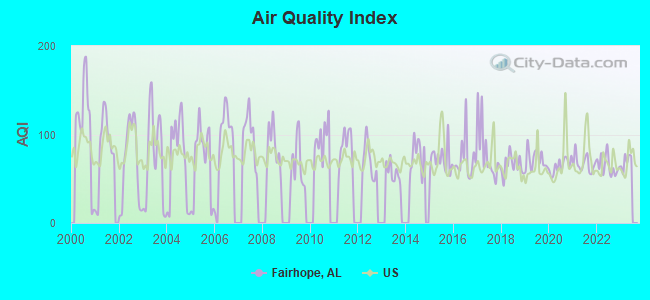
Air Quality Index (AQI) level in 2022 was 64.6. This is about average.
| City: | 64.6 |
| U.S.: | 72.6 |
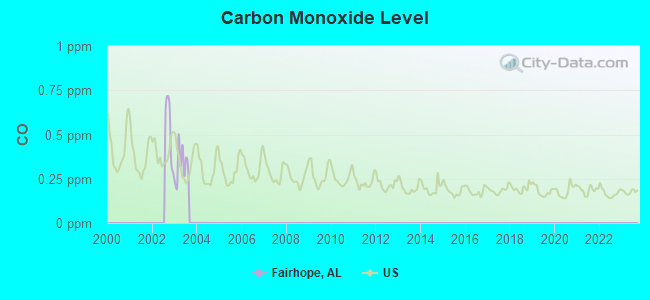
Carbon Monoxide (CO) [ppm] level in 2003 was 0.329. This is worse than average. Closest monitor was 14.1 miles away from the city center.
| City: | 0.329 |
| U.S.: | 0.251 |
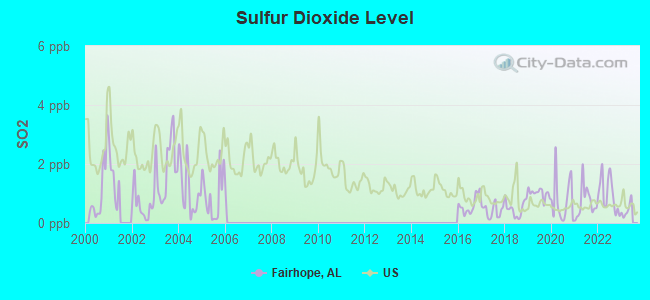
Sulfur Dioxide (SO2) [ppb] level in 2022 was 0.979. This is significantly better than average. Closest monitor was 13.6 miles away from the city center.
| City: | 0.979 |
| U.S.: | 1.515 |
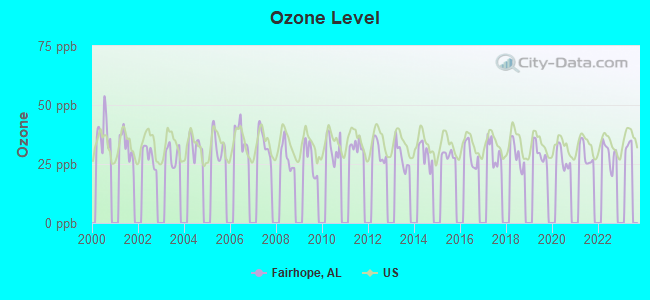
Ozone [ppb] level in 2022 was 29.5. This is about average. Closest monitor was 2.2 miles away from the city center.
| City: | 29.5 |
| U.S.: | 33.3 |
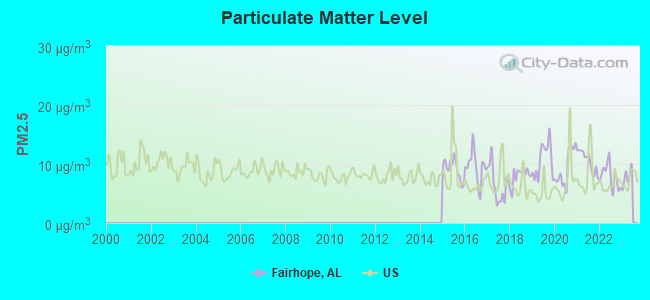
Particulate Matter (PM2.5) [µg/m3] level in 2022 was 7.92. This is about average. Closest monitor was 2.2 miles away from the city center.
| City: | 7.92 |
| U.S.: | 8.11 |
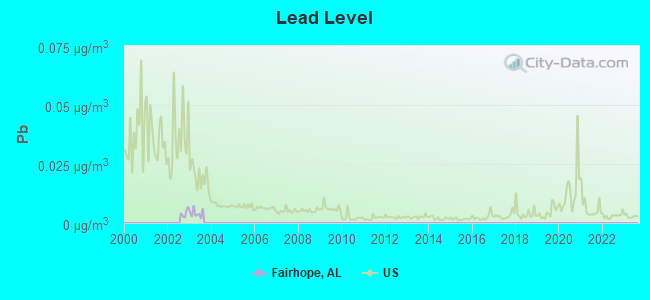
Lead (Pb) [µg/m3] level in 2003 was 0.00411. This is significantly better than average. Closest monitor was 14.6 miles away from the city center.
| City: | 0.00411 |
| U.S.: | 0.00931 |
Tornado activity:
Fairhope-area historical tornado activity is below Alabama state average. It is 19% greater than the overall U.S. average.
On 10/13/2001, a category F3 (max. wind speeds 158-206 mph) tornado 14.8 miles away from the Fairhope city center caused $250,000 in damages.
On 4/18/1950, a category F3 tornado 20.7 miles away from the city center injured 15 people and caused between $5000 and $50,000 in damages.
Earthquake activity:
Fairhope-area historical earthquake activity is significantly above Alabama state average. It is 60% smaller than the overall U.S. average.On 10/24/1997 at 08:35:17, a magnitude 4.9 (4.8 MB, 4.2 MS, 4.9 LG, Depth: 6.2 mi, Class: Light, Intensity: IV - V) earthquake occurred 55.5 miles away from Fairhope center
On 9/10/2006 at 14:56:08, a magnitude 5.9 (5.9 MB, 5.5 MS, 5.8 MW, Class: Moderate, Intensity: VI - VII) earthquake occurred 305.6 miles away from Fairhope center
On 1/18/1999 at 07:00:53, a magnitude 4.8 (4.8 MB, 4.0 LG, Depth: 0.6 mi) earthquake occurred 202.6 miles away from the city center
On 5/6/2018 at 16:47:09, a magnitude 4.6 (4.6 MB, Depth: 6.2 mi) earthquake occurred 189.6 miles away from Fairhope center
On 11/7/2004 at 11:20:21, a magnitude 4.3 (4.3 MW, Depth: 3.1 mi) earthquake occurred 146.8 miles away from the city center
On 9/3/2020 at 15:07:53, a magnitude 3.8 (3.8 MW, Depth: 2.5 mi, Class: Light, Intensity: II - III) earthquake occurred 54.0 miles away from Fairhope center
Magnitude types: regional Lg-wave magnitude (LG), body-wave magnitude (MB), surface-wave magnitude (MS), moment magnitude (MW)
Natural disasters:
The number of natural disasters in Baldwin County (36) is a lot greater than the US average (19).Major Disasters (Presidential) Declared: 20
Emergencies Declared: 8
Causes of natural disasters: Hurricanes: 21, Floods: 9, Storms: 8, Tornadoes: 6, Winds: 4, Tropical Storms: 2, Drought: 1, Snowfall: 1, Winter Storm: 1, Other: 2 (Note: some incidents may be assigned to more than one category).
Hospitals and medical centers in Fairhope:
Airports located in Fairhope:
- H L Sonny Callahan Airport (CQF) (Runways: 1, Itinerant Ops: 24,800, Local Ops: 21,000, Military Ops: 1,000)
- Klumpp Airport (AL78) (Runways: 1)
Colleges/universities with over 2000 students nearest to Fairhope:
- Bishop State Community College (about 16 miles; Mobile, AL; Full-time enrollment: 2,822)
- Columbia Southern University (about 20 miles; Orange Beach, AL; FT enrollment: 14,996)
- University of South Alabama (about 21 miles; Mobile, AL; FT enrollment: 13,228)
- James H Faulkner State Community College (about 24 miles; Bay Minette, AL; FT enrollment: 3,703)
- The University of West Florida (about 41 miles; Pensacola, FL; FT enrollment: 10,240)
- Pensacola State College (about 42 miles; Pensacola, FL; FT enrollment: 8,740)
- Mississippi Gulf Coast Community College (about 77 miles; Perkinston, MS; FT enrollment: 8,320)
Public high school in Fairhope:
- FAIRHOPE HIGH SCH (Students: 1, Location: 18800 GREENO RD, Grades: 9-12)
Public elementary/middle schools in Fairhope:
- FAIRHOPE MIDDLE SCH (Students: 968, Location: TWO PIRATE DRIVE, Grades: 7-8)
- J LARRY NEWTON SCH (Students: 602, Location: 9761 COUNTY ROAD 32, Grades: KG-6)
- FAIRHOPE PRIMARY SCH (Students: 496, Location: 408 N SECTION STREET, Grades: PK-3)
- FAIRHOPE INTERMEDIATE SCH (Students: 473, Location: 2 N BISHOP RD, Grades: 4-6)
Private elementary/middle schools in Fairhope:
User-submitted facts and corrections:
- The Faihrope Library has moved from North Section St. to Fairhope Ave.
Points of interest:
Notable locations in Fairhope: Fairhope Yacht Club (A), Rock Creek Golf Club (B), Eastern Shore Marina (C), Fly Creek Marina (D), Fairhope Public Utilities Wastewater Treatment Plant (E), Quail Creek Golf Course (F), Fairhope Airport Technical Park (G), Fairhope Public Library (H), Fairhope Volunteer Fire Department Station 1 (I), Carroll Place Assisted Living Facility (J), The Huntingdon at Homestead Village (K), Beverly Living Center (L), Montrose Bay Health and Rehabilitation Center (M), James P Nix Center (N), City of Fairhope Civic Center (O), Fairhope Satellite Courthouse (P), Marietta Johnson Museum (Q), Eastern Shore Art Center (R), Weeks Bay Reserve Foundation (S), Fairhope Volunteer Fire Department Station 2 (T). Display/hide their locations on the map
Shopping Centers: Baldwin Square Shopping Center (1), Del-Fair Shopping Center (2), Eastern Shore Shopping Center (3). Display/hide their locations on the map
Churches in Fairhope include: Saint James Episcopal Church (A), Fairhope Christian Church (B), Church of God (C), Christian Valley Baptist Church (D), Fairhope United Methodist Church (E), Redeemer Lutheran Church (F), Fairhope Seventh Day Adventist Church (G), Eastern Shore Presbyterian Church (H), First Baptist Church of Fairhope (I). Display/hide their locations on the map
Cemeteries: Fairhope Memorial Gardens (1), Fairhope Colony Cemetery (2). Display/hide their locations on the map
Lake: Devils Hole (A). Display/hide its location on the map
Creek: Fly Creek (A). Display/hide its location on the map
Parks in Fairhope include: Fairhope Municipal Park (1), Knoll Park (2). Display/hide their locations on the map
Tourist attractions: Paint'n Parrot LLC (Amusement & Theme Parks; 9 North Church Street Suite A) (1), Landmark Tours Inc (Tours & Charters; 26 Hoffren Drive) (2). Display/hide their approximate locations on the map
Hotels: Key West Inn-Fairhope (231 South Greeno Road) (1), Barons Inn On the Bay (701 South Mobile Street) (2), Grand Dining Room (Point Clear) (3), The Victorian Inn- Hotel- Pub and Grill (924 Plantation Boulevard) (4), Oak Haven Cottages (355 S Mobile St) (5). Display/hide their approximate locations on the map
Birthplace of: Grant Enfinger - Stock car racing driver, Dave Stapleton (infielder) - Baseball player.
Drinking water stations with addresses in Fairhope and their reported violations in the past:
FAIRHOPE WATER SYSTEM (CITY OF) (Address: P O DRAWER 429 , Population served: 38,754, Groundwater):Past monitoring violations:
- 35 regular monitoring violations
| This city: | 2.3 people |
| Alabama: | 2.5 people |
| This city: | 65.3% |
| Whole state: | 67.8% |
| This city: | 2.9% |
| Whole state: | 4.7% |
Likely homosexual households (counted as self-reported same-sex unmarried-partner households)
- Lesbian couples: 0.3% of all households
- Gay men: 0.3% of all households
17 people in local jails and other municipal confinement facilities in 2010
People in group quarters in Fairhope in 2000:
- 202 people in nursing homes
- 101 people in other noninstitutional group quarters
- 18 people in local jails and other confinement facilities (including police lockups)
Banks with most branches in Fairhope (2011 data):
- Branch Banking and Trust Company: Fairhope Branch at 387 Fairhope Avenue, branch established on 1983/06/13; Plantation Pointe Branch at 906 Plantation Boulevard, branch established on 1995/03/02. Info updated 2010/03/29: Bank assets: $168,867.6 mil, Deposits: $127,549.5 mil, headquarters in Winston Salem, NC, positive income, Commercial Lending Specialization, 1793 total offices, Holding Company: Bb&T Corporation
- PNC Bank, National Association: First Gulf Bank at 949 Fairhope Avenue, branch established on 2000/09/11; Fairhope Branch at 51 South Section Street, branch established on 1982/05/03. Info updated 2012/03/20: Bank assets: $263,309.6 mil, Deposits: $197,343.0 mil, headquarters in Wilmington, DE, positive income, Commercial Lending Specialization, 3085 total offices, Holding Company: Pnc Financial Services Group, Inc., The
- Regions Bank: Fairhope Section Street Branch at 55 N Section Street, branch established on 2008/10/28; Greeno Road Branch at 98 South Greeno Road, branch established on 1927/01/01. Info updated 2011/02/24: Bank assets: $123,368.2 mil, Deposits: $98,301.3 mil, headquarters in Birmingham, AL, positive income, Commercial Lending Specialization, 1778 total offices, Holding Company: Regions Financial Corporation
- Compass Bank: Greeno Road Branch at 920 Fairhope Avenue, branch established on 1975/11/10; Fairhope Main Branch at 36 North Section Street, branch established on 1982/05/15. Info updated 2011/02/24: Bank assets: $63,107.0 mil, Deposits: $46,232.4 mil, headquarters in Birmingham, AL, negative income in the last year, Commercial Lending Specialization, 720 total offices, Holding Company: Banco Bilbao Vizcaya Argentaria, S.A.
- Woodforest National Bank: Al Fairhope at 10040 County Road 48, branch established on 2009/10/10. Info updated 2011/05/10: Bank assets: $3,488.9 mil, Deposits: $3,097.6 mil, headquarters in Houston, TX, positive income, Commercial Lending Specialization, 766 total offices, Holding Company: Woodforest Financial Group Employee Stock Ownership Plan (With 401(K) Provisions)
- Centennial Bank: Fairhope Branch at 218 North Greeno Rd, branch established on 2003/07/14. Info updated 2012/02/29: Bank assets: $3,588.2 mil, Deposits: $2,891.9 mil, headquarters in Conway, AR, positive income, Commercial Lending Specialization, 109 total offices, Holding Company: Home Bancshares, Inc.
- National Bank of Commerce: Fairhope Branch at 813 Estella Drive, branch established on 2010/11/23. Info updated 2011/02/24: Bank assets: $426.0 mil, Deposits: $325.7 mil, headquarters in Birmingham, AL, positive income, Commercial Lending Specialization, 5 total offices, Holding Company: Charles Investment Group, Llc
- First National Bank of Baldwin County: Fairhope Branch at 408 Fairhope Avenue, branch established on 2003/03/26. Info updated 2006/11/03: Bank assets: $206.6 mil, Deposits: $196.0 mil, headquarters in Foley, AL, negative income in the last year, Commercial Lending Specialization, 5 total offices, Holding Company: First Baldwin Bancshares, Inc.
- BankTrust: Fairhope Branch at 236 North Greeno Road, branch established on 2008/01/02. Info updated 2012/01/30: Bank assets: $2,083.8 mil, Deposits: $1,812.7 mil, headquarters in Mobile, AL, positive income, Commercial Lending Specialization, 50 total offices, Holding Company: Banctrust Financial Group, Inc.
- 4 other banks with 4 local branches
For population 15 years and over in Fairhope:
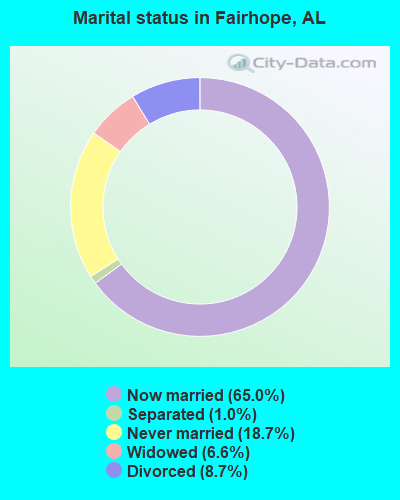
- Never married: 18.6%
- Now married: 63.6%
- Separated: 1.7%
- Widowed: 7.4%
- Divorced: 8.7%
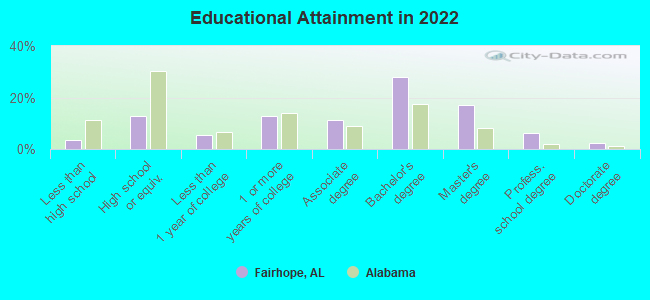
For population 25 years and over in Fairhope:
- High school or higher: 94.6%
- Bachelor's degree or higher: 53.4%
- Graduate or professional degree: 24.0%
- Unemployed: 2.4%
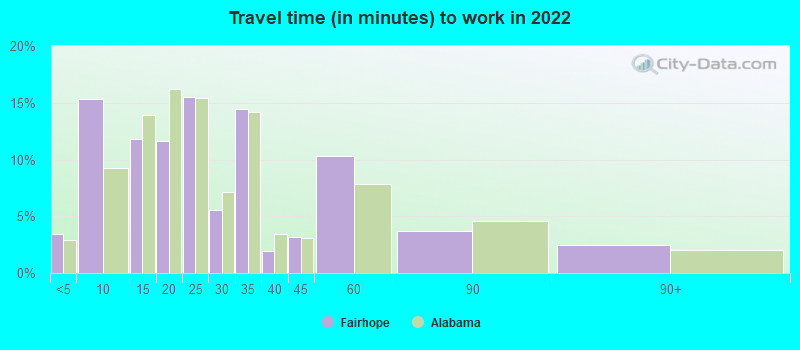
- Mean travel time to work (commute): 20.8 minutes
| Here: | 10.3 |
| Alabama average: | 11.5 |
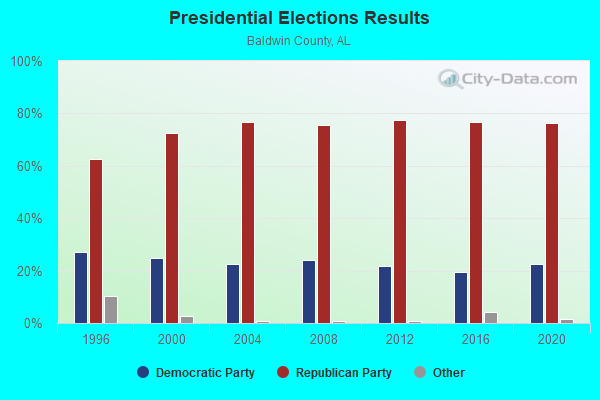

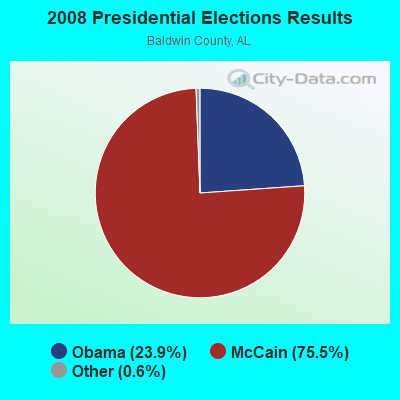
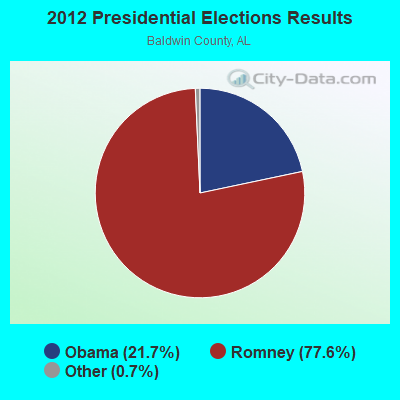
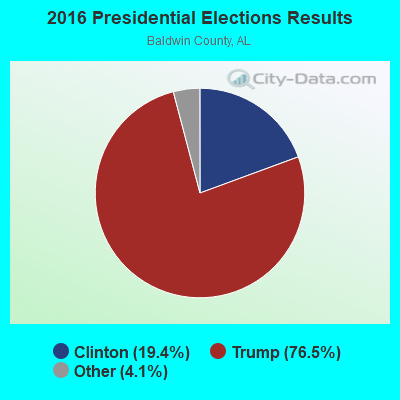
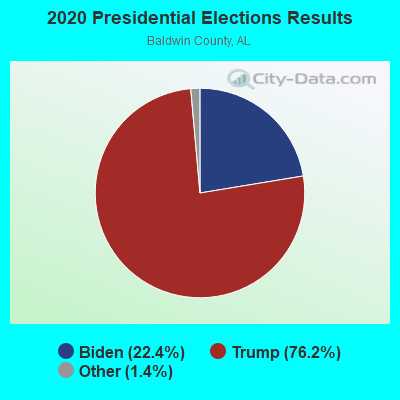

Graphs represent county-level data. Detailed 2008 Election Results
Religion statistics for Fairhope, AL (based on Baldwin County data)
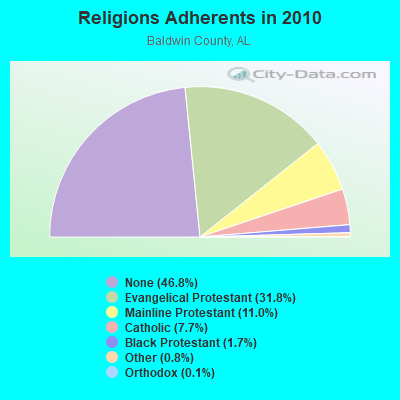
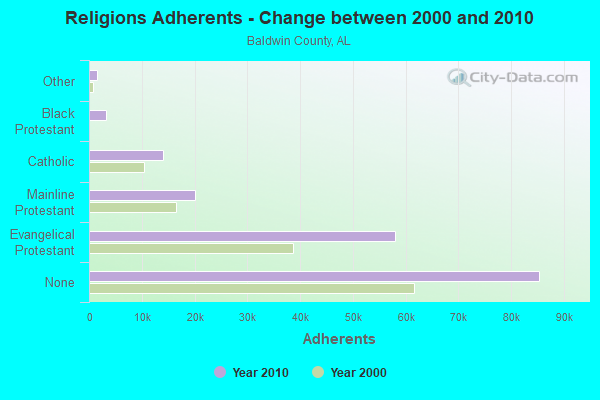
| Religion | Adherents | Congregations |
|---|---|---|
| Evangelical Protestant | 57,986 | 178 |
| Mainline Protestant | 20,075 | 48 |
| Catholic | 14,009 | 13 |
| Black Protestant | 3,130 | 17 |
| Other | 1,528 | 14 |
| Orthodox | 190 | 1 |
| None | 85,347 | - |
Food Environment Statistics:
| This county: | 1.34 / 10,000 pop. |
| State: | 1.89 / 10,000 pop. |
| Baldwin County: | 0.17 / 10,000 pop. |
| Alabama: | 0.20 / 10,000 pop. |
| This county: | 0.29 / 10,000 pop. |
| Alabama: | 0.65 / 10,000 pop. |
| Here: | 6.58 / 10,000 pop. |
| State: | 6.32 / 10,000 pop. |
| Here: | 10.71 / 10,000 pop. |
| Alabama: | 5.75 / 10,000 pop. |
| Baldwin County: | 9.4% |
| State: | 11.8% |
| This county: | 24.5% |
| State: | 31.7% |
| Here: | 10.8% |
| Alabama: | 13.5% |
Health and Nutrition:
| Fairhope: | 55.1% |
| State: | 49.0% |
| Fairhope: | 52.9% |
| Alabama: | 45.7% |
| This city: | 28.0 |
| Alabama: | 28.9 |
| This city: | 18.0% |
| Alabama: | 20.7% |
| This city: | 8.8% |
| Alabama: | 11.0% |
| Here: | 7.0 |
| State: | 6.8 |
| Fairhope: | 34.9% |
| State: | 34.4% |
| Here: | 59.3% |
| Alabama: | 55.2% |
| This city: | 77.9% |
| Alabama: | 79.3% |
More about Health and Nutrition of Fairhope, AL Residents
| Local government employment and payroll (March 2022) | |||||
| Function | Full-time employees | Monthly full-time payroll | Average yearly full-time wage | Part-time employees | Monthly part-time payroll |
|---|---|---|---|---|---|
| Solid Waste Management | 62 | $180,257 | $34,888 | 0 | $0 |
| Police Protection - Officers | 46 | $244,957 | $63,902 | 0 | $0 |
| Financial Administration | 41 | $160,597 | $47,004 | 0 | $0 |
| Water Supply | 28 | $87,523 | $37,510 | 0 | $0 |
| Parks and Recreation | 25 | $71,511 | $34,325 | 0 | $0 |
| Electric Power | 23 | $80,177 | $41,831 | 0 | $0 |
| Gas Supply | 23 | $67,786 | $35,367 | 0 | $0 |
| Police - Other | 16 | $48,972 | $36,729 | 0 | $0 |
| Correction | 14 | $44,183 | $37,871 | 0 | $0 |
| Streets and Highways | 14 | $45,208 | $38,750 | 0 | $0 |
| Other Government Administration | 14 | $29,312 | $25,125 | 0 | $0 |
| Sewerage | 14 | $48,172 | $41,290 | 0 | $0 |
| Welfare | 8 | $27,217 | $40,826 | 0 | $0 |
| Firefighters | 5 | $10,635 | $25,524 | 0 | $0 |
| Judicial and Legal | 4 | $11,201 | $33,603 | 0 | $0 |
| Totals for Government | 337 | $1,157,708 | $41,224 | 0 | $0 |
Fairhope government finances - Expenditure in 2022 (per resident):
- Construction - General - Other: $4,825,000 ($202.23)
Electric Utilities: $4,416,000 ($185.09)
Sewerage: $2,394,000 ($100.34)
Gas Utilities: $1,587,000 ($66.52)
- Current Operations - Electric Utilities: $16,632,000 ($697.10)
General - Other: $10,977,000 ($460.08)
Police Protection: $6,549,000 ($274.49)
Parks and Recreation: $5,828,000 ($244.27)
Gas Utilities: $5,644,000 ($236.56)
Central Staff Services: $4,633,000 ($194.18)
Regular Highways: $4,371,000 ($183.20)
Sewerage: $4,144,000 ($173.69)
Water Utilities: $3,703,000 ($155.20)
Solid Waste Management: $2,461,000 ($103.15)
General Public Buildings: $952,000 ($39.90)
Libraries: $878,000 ($36.80)
Local Fire Protection: $615,000 ($25.78)
Air Transportation: $335,000 ($14.04)
- Electric Utilities - Interest on Debt: $35,000 ($1.47)
- Gas Utilities - Interest on Debt: $34,000 ($1.43)
- General - Interest on Debt: $129,000 ($5.41)
- Water Utilities - Interest on Debt: $805,000 ($33.74)
Fairhope government finances - Revenue in 2022 (per resident):
- Charges - Sewerage: $7,578,000 ($317.62)
Other: $4,977,000 ($208.60)
Solid Waste Management: $1,849,000 ($77.50)
Parks and Recreation: $1,667,000 ($69.87)
Air Transportation: $250,000 ($10.48)
- Federal Intergovernmental - Other: $557,000 ($23.35)
- Miscellaneous - General Revenue - Other: $1,959,000 ($82.11)
Interest Earnings: $773,000 ($32.40)
Fines and Forfeits: $195,000 ($8.17)
Sale of Property: $4,000 ($0.17)
- Revenue - Electric Utilities: $21,910,000 ($918.31)
Gas Utilities: $8,745,000 ($366.53)
Water Utilities: $7,102,000 ($297.67)
- State Intergovernmental - Other: $10,774,000 ($451.57)
- Tax - General Sales and Gross Receipts: $11,728,000 ($491.55)
Property: $6,847,000 ($286.98)
Other License: $2,500,000 ($104.78)
Occupation and Business License - Other: $2,044,000 ($85.67)
Other Selective Sales: $1,367,000 ($57.29)
Alcoholic Beverage Sales: $714,000 ($29.93)
Motor Fuels Sales: $137,000 ($5.74)
Tobacco Products Sales: $112,000 ($4.69)
Fairhope government finances - Debt in 2022 (per resident):
- Long Term Debt - Beginning Outstanding - Unspecified Public Purpose: $25,070,000 ($1050.76)
Retired Unspecified Public Purpose: $12,870,000 ($539.42)
Outstanding Unspecified Public Purpose: $12,200,000 ($511.34)
| Businesses in Fairhope, AL | ||||
| Name | Count | Name | Count | |
|---|---|---|---|---|
| AT&T | 1 | McDonald's | 1 | |
| Ace Hardware | 1 | New Balance | 1 | |
| Advance Auto Parts | 1 | Pizza Hut | 1 | |
| Arby's | 1 | Publix Super Markets | 1 | |
| Blockbuster | 1 | RadioShack | 1 | |
| Burger King | 1 | Rite Aid | 1 | |
| CVS | 1 | Ruby Tuesday | 1 | |
| Domino's Pizza | 1 | SONIC Drive-In | 1 | |
| FedEx | 3 | Sears | 1 | |
| GNC | 1 | Subway | 1 | |
| Goodwill | 1 | T-Mobile | 1 | |
| H&R Block | 1 | True Value | 1 | |
| Hardee's | 1 | U-Haul | 2 | |
| Hilton | 1 | UPS | 5 | |
| Holiday Inn | 1 | Waffle House | 1 | |
| Little Caesars Pizza | 1 | Walmart | 1 | |
Strongest AM radio stations in Fairhope:
- WABF (1220 AM; 1 kW; FAIRHOPE, AL; Owner: GULF COAST BROADCASTING COMPANY, INC)
- WDLT (660 AM; 10 kW; FAIRHOPE, AL; Owner: CUMULUS LICENSING CORP.)
- WNTM (710 AM; 10 kW; MOBILE, AL; Owner: CLEAR CHANNEL BROADCASTING LICENSES, INC.)
- WASG (550 AM; 25 kW; ATMORE, AL; Owner: 550 AM, INC)
- WBHY (840 AM; daytime; 10 kW; MOBILE, AL; Owner: GOFORTH MEDIA, INC.)
- WMOB (1360 AM; 5 kW; MOBILE, AL; Owner: BUDDY TUCKER ASSOCIATION, INC.)
- WBCA (1110 AM; daytime; 10 kW; BAY MINETTE, AL; Owner: SOUTHERN MEDIA COMMUNICATIONS, INC)
- WABB (1480 AM; 5 kW; MOBILE, AL; Owner: WABB-FM, INC.)
- WLPR (960 AM; 5 kW; PRICHARD, AL; Owner: GOFORTH MEDIA, INC.)
- WKSJ (1270 AM; 5 kW; PRICHARD, AL; Owner: CLEAR CHANNEL BROADCASTING LICENSES, INC.)
- WHEP (1310 AM; daytime; 2 kW; FOLEY, AL; Owner: STEWART BROADCASTING COMPANY, INC.)
- WEBY (1330 AM; 25 kW; MILTON, FL; Owner: SPINNAKER LICENSE CORPORATION)
- WLVV (1410 AM; 5 kW; MOBILE, AL; Owner: WLVV, INC.)
Strongest FM radio stations in Fairhope:
- WRKH (96.1 FM; MOBILE, AL; Owner: CLEAR CHANNEL BROADCASTING LICENSES, INC.)
- WMXC (99.9 FM; MOBILE, AL; Owner: CLEAR CHANNEL BROADCASTING LICENSES, INC.)
- WABB-FM (97.5 FM; MOBILE, AL; Owner: WABB-FM, INC.)
- WHIL-FM (91.3 FM; MOBILE, AL; Owner: SPRING HILL COLLEGE)
- WJLQ (100.7 FM; PENSACOLA, FL; Owner: CUMULUS LICENSING CORP.)
- WBLX-FM (92.9 FM; MOBILE, AL; Owner: CUMULUS LICENSING CORP.)
- WYOK (104.1 FM; ATMORE, AL; Owner: CUMULUS LICENSING CORP.)
- WMEZ (94.1 FM; PENSACOLA, FL; Owner: 6 JOHNSON ROAD LICENSES, INC.)
- WKSJ-FM (94.9 FM; MOBILE, AL; Owner: CLEAR CHANNEL BROADCASTING LICENSES, INC.)
- WPCS (89.5 FM; PENSACOLA, FL; Owner: PENSACOLA CHRISTIAN COLLEGE, INC)
- WYCL (107.3 FM; PENSACOLA, FL; Owner: CONCORD MEDIA GROUP, INC.)
- WZEW (92.1 FM; FAIRHOPE, AL; Owner: BALDWIN BROADCASTING COMPANY, DEBTOR IN POSSESSION)
- WAVH (106.5 FM; DAPHNE, AL; Owner: BALDWIN BROADCASTING COMPANY, DEBTOR IN POSSESSION)
- WDLT-FM (98.3 FM; CHICKASAW, AL; Owner: CUMULUS LICENSING CORP.)
- WBHY-FM (88.5 FM; MOBILE, AL; Owner: GOFORTH MEDIA, INC.)
- WXBM-FM (102.7 FM; MILTON, FL; Owner: 6 JOHNSON ROAD LICENSES, INC.)
- WTKX-FM (101.5 FM; PENSACOLA, FL; Owner: CLEAR CHANNEL BROADCASTING LICENSES, INC.)
- WNSP (105.5 FM; BAY MINETTE, AL; Owner: COM+, LLC)
- WCSN-FM (105.7 FM; ORANGE BEACH, AL; Owner: GULF COAST BROADCASTING CO., INC.)
TV broadcast stations around Fairhope:
- WKRG-TV (Channel 5; MOBILE, AL; Owner: MEDIA GENERAL BROADCASTING OF SOUTH CAROLINA HOLDINGS, INC.)
- WEAR-TV (Channel 3; PENSACOLA, FL; Owner: WEAR LICENSEE, LLC)
- WMPV-TV (Channel 21; MOBILE, AL; Owner: TRINITY BROADCASTING NETWORK)
- WPMI (Channel 15; MOBILE, AL; Owner: CLEAR CHANNEL BROADCASTING LICENSES, INC.)
- WALA-TV (Channel 10; MOBILE, AL; Owner: EMMIS TELEVISION LICENSE CORPORATION)
- WJTC (Channel 44; PENSACOLA, FL; Owner: CLEAR CHANNEL BROADCASTING LICENSES, INC.)
- WHBR (Channel 33; PENSACOLA, FL; Owner: CHRISTIAN TELEVISION OF PENSACOLA/MOBILE, INC.)
- WRBM-LP (Channel 60; PRICHARD, AL; Owner: UPPER GULF COAST, L.L.C.)
- WEIQ (Channel 42; MOBILE, AL; Owner: ALABAMA EDUCATIONAL TELEVISION COMMISSION)
- WBPG (Channel 55; GULF SHORES, AL; Owner: EMMIS TELEVISION LICENSE CORPORATION)
- WMOE-LP (Channel 12; MOBILE, AL; Owner: TIGER EYE BROADCASTING CORPORATION)
- WSRE (Channel 23; PENSACOLA, FL; Owner: DST .BD. OF TRUSTEES PENSACOLA JR. COLLEGE)
- W52BF (Channel 52; MOBILE, AL; Owner: VENTANA TELEVISION, INC.)
- WGHA-LP (Channel 66; GULF SHORES , ETC., AL; Owner: TIGER EYE BROADCASTING CORPORATION)
- W50CF (Channel 50; MOBILE, AL; Owner: FRANKLIN MEDIA, INC.)
- WWBH-LP (Channel 27; MOBILE, AL; Owner: TIGER EYE BROADCASTING CORPORATION)
- W08DC (Channel 8; ELSANOR, AL; Owner: WHISPER BROADCASTING CO.)
- National Bridge Inventory (NBI) Statistics
- 11Number of bridges
- 69ft / 20.9mTotal length
- $29,788,000Total costs
- 83,903Total average daily traffic
- 2,371Total average daily truck traffic
- 130,494Total future (year 2040) average daily traffic
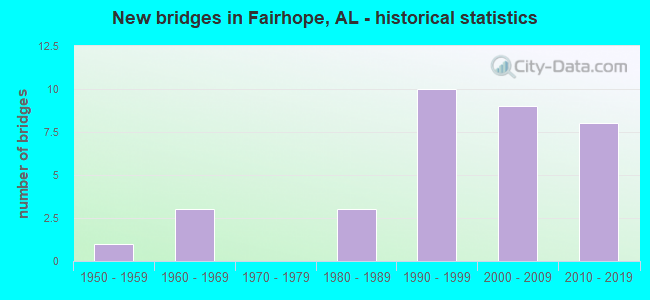
- New bridges - historical statistics
- 11960-1969
- 51990-1999
- 22000-2009
- 32010-2019
FCC Registered Antenna Towers: 220 (See the full list of FCC Registered Antenna Towers)
FCC Registered Commercial Land Mobile Towers: 1 (See the full list of FCC Registered Commercial Land Mobile Towers in Fairhope, AL)
FCC Registered Private Land Mobile Towers: 2 (See the full list of FCC Registered Private Land Mobile Towers)
FCC Registered Broadcast Land Mobile Towers: 10 (See the full list of FCC Registered Broadcast Land Mobile Towers)
FCC Registered Microwave Towers: 16 (See the full list of FCC Registered Microwave Towers in this town)
FCC Registered Paging Towers: 2 (See the full list of FCC Registered Paging Towers)
FCC Registered Maritime Coast & Aviation Ground Towers: 5 (See the full list of FCC Registered Maritime Coast & Aviation Ground Towers)
FCC Registered Amateur Radio Licenses: 198 (See the full list of FCC Registered Amateur Radio Licenses in Fairhope)
FAA Registered Aircraft Manufacturers and Dealers: 2 (See the full list of FAA Registered Manufacturers and Dealers in Fairhope)
FAA Registered Aircraft: 50 (See the full list of FAA Registered Aircraft)
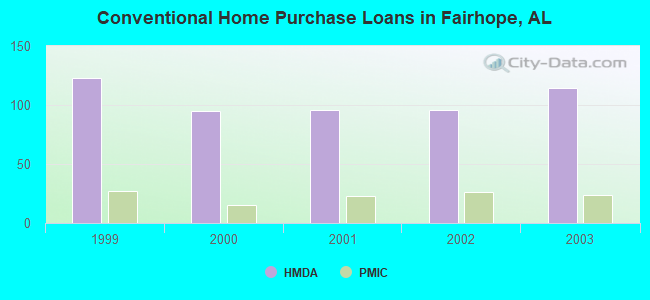
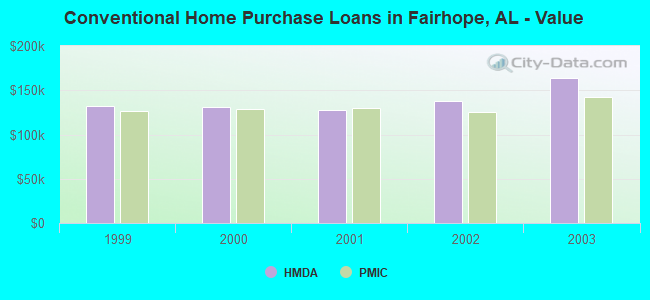
| Home Mortgage Disclosure Act Aggregated Statistics For Year 2003 (Based on 4 partial tracts) | ||||||||||
| A) FHA, FSA/RHS & VA Home Purchase Loans | B) Conventional Home Purchase Loans | C) Refinancings | D) Home Improvement Loans | F) Non-occupant Loans on < 5 Family Dwellings (A B C & D) | ||||||
|---|---|---|---|---|---|---|---|---|---|---|
| Number | Average Value | Number | Average Value | Number | Average Value | Number | Average Value | Number | Average Value | |
| LOANS ORIGINATED | 8 | $132,931 | 114 | $163,963 | 291 | $157,723 | 10 | $46,278 | 54 | $135,713 |
| APPLICATIONS APPROVED, NOT ACCEPTED | 1 | $108,130 | 14 | $141,740 | 29 | $143,478 | 2 | $42,390 | 6 | $116,015 |
| APPLICATIONS DENIED | 2 | $123,900 | 10 | $71,280 | 53 | $595,445 | 6 | $37,837 | 5 | $5,084,028 |
| APPLICATIONS WITHDRAWN | 1 | $91,990 | 10 | $143,166 | 62 | $144,300 | 0 | $0 | 5 | $123,014 |
| FILES CLOSED FOR INCOMPLETENESS | 0 | $0 | 3 | $74,010 | 12 | $247,021 | 0 | $0 | 1 | $103,090 |
Detailed HMDA statistics for the following Tracts: 0111.00 , 0112.01, 0112.02
| Private Mortgage Insurance Companies Aggregated Statistics For Year 2003 (Based on 4 partial tracts) | ||||||
| A) Conventional Home Purchase Loans | B) Refinancings | C) Non-occupant Loans on < 5 Family Dwellings (A & B) | ||||
|---|---|---|---|---|---|---|
| Number | Average Value | Number | Average Value | Number | Average Value | |
| LOANS ORIGINATED | 24 | $142,886 | 25 | $140,308 | 3 | $96,170 |
| APPLICATIONS APPROVED, NOT ACCEPTED | 3 | $171,340 | 6 | $151,265 | 1 | $57,670 |
| APPLICATIONS DENIED | 0 | $0 | 0 | $0 | 0 | $0 |
| APPLICATIONS WITHDRAWN | 1 | $95,500 | 2 | $132,480 | 1 | $41,430 |
| FILES CLOSED FOR INCOMPLETENESS | 0 | $0 | 0 | $0 | 0 | $0 |
Detailed PMIC statistics for the following Tracts: 0111.00 , 0112.01, 0112.02
2002 - 2018 National Fire Incident Reporting System (NFIRS) incidents
- Fire incident types reported to NFIRS in Fairhope, AL
- 44942.6%Outside Fires
- 42940.7%Structure Fires
- 14613.9%Mobile Property/Vehicle Fires
- 292.8%Other
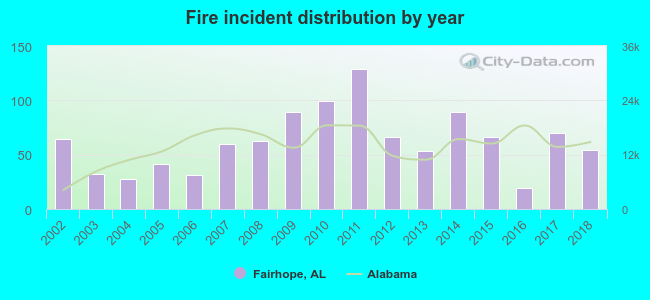 Based on the data from the years 2002 - 2018 the average number of fire incidents per year is 62. The highest number of reported fires - 129 took place in 2011, and the least - 19 in 2016. The data has a declining trend.
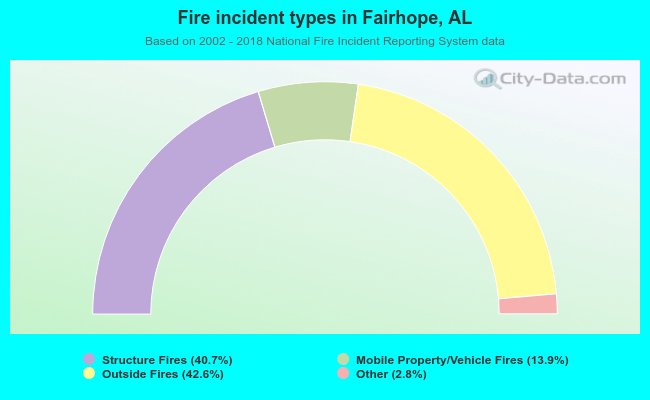 When looking into fire subcategories, the most incidents belonged to: Outside Fires (42.6%), and Structure Fires (40.7%).
Fire-safe hotels and motels in Fairhope, Alabama:
- Key West Inn-fairhope, 231 S Greeno Rd, Fairhope, Alabama 36532 , Phone: (251) 990-7373
- Hampton Inn Fairhope, 23 N Section St, Fairhope, Alabama 36532 , Phone: (251) 928-0956, Fax: (251) 928-0957
| Most common first names in Fairhope, AL among deceased individuals | ||
| Name | Count | Lived (average) |
|---|---|---|
| Mary | 173 | 80.7 years |
| James | 165 | 73.6 years |
| John | 159 | 75.3 years |
| William | 144 | 75.7 years |
| Robert | 122 | 74.6 years |
| Charles | 89 | 75.0 years |
| George | 79 | 75.7 years |
| Joseph | 78 | 74.5 years |
| Margaret | 70 | 80.0 years |
| Dorothy | 57 | 77.2 years |
| Most common last names in Fairhope, AL among deceased individuals | ||
| Last name | Count | Lived (average) |
|---|---|---|
| Johnson | 70 | 76.6 years |
| Williams | 58 | 76.8 years |
| Smith | 56 | 75.7 years |
| Brown | 48 | 74.1 years |
| Bishop | 48 | 77.4 years |
| Jones | 45 | 78.6 years |
| Nelson | 39 | 73.3 years |
| Wilson | 35 | 73.2 years |
| Moore | 32 | 77.3 years |
| Davis | 30 | 76.1 years |
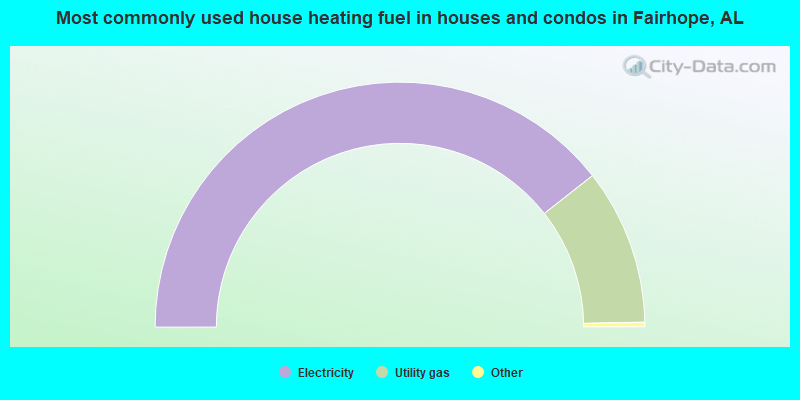
- 77.5%Electricity
- 21.6%Utility gas
- 0.6%Bottled, tank, or LP gas
- 0.3%No fuel used
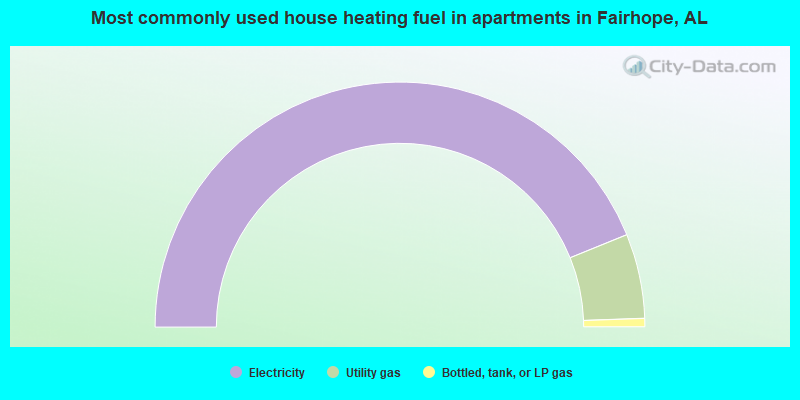
- 90.9%Electricity
- 9.1%Utility gas
Fairhope compared to Alabama state average:
- Median house value above state average.
- Unemployed percentage significantly below state average.
- Black race population percentage significantly below state average.
- Hispanic race population percentage above state average.
- Foreign-born population percentage above state average.
- Length of stay since moving in significantly above state average.
- House age below state average.
- Percentage of population with a bachelor's degree or higher significantly above state average.
Fairhope on our top lists:
- #27 on the list of "Top 101 cities with the most residents born in Turkey (population 500+)"
- #32 on the list of "Top 101 cities with the most full-time financial administration workers per 1000 residents (population 5,000+)"
- #93 on the list of "Top 101 cities with most building permits per 10,000 residents (population 5,000+)"
- #11 on the list of "Top 101 counties with the largest number of people moving in compared to moving out (pop. 50,000+)"
- #18 on the list of "Top 101 counties with highest percentage of residents voting for Romney (Republican) in the 2012 Presidential Election (pop. 50,000+)"

|
|
Total of 42 patent applications in 2008-2025.