Hamburg, New York

Hamburg: Now Pizzeria on Main St

Hamburg: Village Hall

Hamburg: View south along Main Street. User comment: Main Street runs East and West. You are looking East!

Hamburg: Hamburg Golf Course

Hamburg: Lake Erie Seaway Trail Center overlooking Lake Erie

Hamburg: Tim Hortons on Buffalo Street

Hamburg: The new Barbershop on Main St.

Hamburg: Old Post Office on Main Street

Hamburg: Golf Course

Hamburg: The New Post Office on Camp Rd

Hamburg: Sunrise Laundromat on Buffalo St
- add
your
Submit your own pictures of this village and show them to the world
- OSM Map
- General Map
- Google Map
- MSN Map

Population change since 2000: -3.4%
| Males: 4,845 | |
| Females: 4,929 |
| Median resident age: | 40.5 years |
| New York median age: | 40.2 years |
Zip codes: 14075.
| Hamburg: | $107,982 |
| NY: | $82,095 |
Estimated per capita income in 2023: $47,342 (it was $23,371 in 2000)
Hamburg village income, earnings, and wages data
Estimated median house or condo value in 2023: $264,822 (it was $97,500 in 2000)
| Hamburg: | $264,822 |
| NY: | $420,200 |
Mean prices in 2023: all housing units: $261,977; detached houses: $276,938; townhouses or other attached units: $251,947; in 2-unit structures: $212,640; in 3-to-4-unit structures: $244,530; in 5-or-more-unit structures: $353,317; mobile homes: $71,122; occupied boats, rvs, vans, etc.: $173,630
Median gross rent in 2023: $1,048.
Detailed information about poverty and poor residents in Hamburg, NY


Compare current foreclosures in Hamburg, NY:
| Photo | Address | Area | Beds / Baths | Price | Details |
|---|---|---|---|---|---|

|
#1
Lake Shore Road
Hamburg, NY 14075
|
2,466 sq. feet
|
2 baths 5 beds |
show details | |

|
#2
Morgan Pkwy
Hamburg, NY 14075
|
1,080 sq. feet
|
1 baths 2 beds |
show details | |

|
#3
Twilight Ln
Hamburg, NY 14075
|
1,016 sq. feet
|
2 baths 2 beds |
show details | |

|
#4
Fifth St
Hamburg, NY 14075
|
1,008 sq. feet
|
2 baths 3 beds |
show details | |

|
#5
Main St
Hamburg, NY 14075
|
1,772 sq. feet
|
2 baths 3 beds |
show details | |

|
#6
Harvard St
Hamburg, NY 14075
|
1,428 sq. feet
|
2 baths 3 beds |
show details | |

|
#7
Wilson Dr
Hamburg, NY 14075
|
925 sq. feet
|
1 baths 3 beds |
show details | |

|
#8
Lake Shore Rd
Hamburg, NY 14075
|
2,026 sq. feet
|
2 baths 3 beds |
show details | |

|
#9
Torry Dr # Right
Hamburg, NY 14075
|
2,640 sq. feet
|
3 baths 5 beds |
show details | |

|
#10
Sunset Dr
Hamburg, NY 14075
|
1,066 sq. feet
|
1 baths 2 beds |
show details |
| Photo | Address | Area | Beds / Baths | Price | Details |
|---|---|---|---|---|---|

|
#11
Martha Pl
Hamburg, NY 14075
|
1,332 sq. feet
|
1 baths 3 beds |
show details | |

|
#12
Herman Hill Rd
Hamburg, NY 14075
|
1,560 sq. feet
|
1 baths 3 beds |
show details | |

|
#13
Buffalo St
Hamburg, NY 14075
|
1,384 sq. feet
|
1 baths 3 beds |
show details | |

|
#14
Pittsburg St
Hamburg, NY 14075
|
2,228 sq. feet
|
3 baths 4 beds |
show details | |

|
#15
Hampton Brook Dr
Hamburg, NY 14075
|
2,065 sq. feet
|
2 baths 3 beds |
show details | |

|
#16
Oakhill Dr
Hamburg, NY 14075
|
2,098 sq. feet
|
1 baths 4 beds |
show details | |

|
#17
Glenwillow Dr
Hamburg, NY 14075
|
1,212 sq. feet
|
1 baths 3 beds |
show details | |

|
#18
Dartmouth St
Hamburg, NY 14075
|
1,750 sq. feet
|
1 baths 3 beds |
show details | |

|
#19
Glenwillow Dr
Hamburg, NY 14075
|
1,212 sq. feet
|
1 baths 4 beds |
show details | |

|
#20
Electric Ave
Hamburg, NY 14075
|
2,478 sq. feet
|
3 baths 6 beds |
show details |
| Photo | Address | Area | Beds / Baths | Price | Details |
|---|---|---|---|---|---|

|
#21
Windover Dr
Hamburg, NY 14075
|
1,848 sq. feet
|
2 baths 4 beds |
show details | |

|
#22
Tudor Pl
Hamburg, NY 14075
|
1,770 sq. feet
|
1 baths 4 beds |
show details | |

|
#23
Long Ave
Hamburg, NY 14075
|
1,664 sq. feet
|
3 baths 9 beds |
show details | |

|
#24
Stilwell Rd
Hamburg, NY 14075
|
1,000 sq. feet
|
1 baths 2 beds |
show details | |

|
#25
Clark St
Hamburg, NY 14075
|
2,146 sq. feet
|
2 baths 4 beds |
show details | |

|
#26
Chapman Pkwy
Hamburg, NY 14075
|
1,638 sq. feet
|
1 baths 3 beds |
show details | |

|
#27
N Hampton Brook Dr
Hamburg, NY 14075
|
980 sq. feet
|
1 baths 3 beds |
show details | |

|
#28
Lakewood Ave
Hamburg, NY 14075
|
948 sq. feet
|
1 baths 3 beds |
show details | |

|
#29
College St
Hamburg, NY 14075
|
2,216 sq. feet
|
2 baths 3 beds |
show details | |

|
#30
Pleasant Ave
Hamburg, NY 14075
|
1,120 sq. feet
|
1 baths 3 beds |
show details |
| Photo | Address | Area | Beds / Baths | Price | Details |
|---|---|---|---|---|---|

|
#31
Park Ave
Hamburg, NY 14075
|
2,496 sq. feet
|
3 baths 6 beds |
show details | |

|
#32
Homestead Rd
Hamburg, NY 14075
|
1,185 sq. feet
|
1 baths 3 beds |
show details | |

|
#33
Mckinley Pkwy
Hamburg, NY 14075
|
1,762 sq. feet
|
1 baths 4 beds |
show details | |

|
#34
Summerway Ln
Hamburg, NY 14075
|
1,962 sq. feet
|
2 baths 4 beds |
show details | |

|
#35
Hawkins Ave
Hamburg, NY 14075
|
2,007 sq. feet
|
1 baths 4 beds |
show details | |

|
#36
Shero Rd
Hamburg, NY 14075
|
1,494 sq. feet
|
1 baths 4 beds |
show details | |

|
#37
Eckhardt Rd
Hamburg, NY 14075
|
1,600 sq. feet
|
1 baths 3 beds |
show details | |

|
#38
Forestal Dr
Hamburg, NY 14075
|
1,439 sq. feet
|
1 baths 3 beds |
show details | |

|
#39
Stilwell Rd
Hamburg, NY 14075
|
2,023 sq. feet
|
2 baths 4 beds |
show details | |

|
#40
Jefferson Ave
Hamburg, NY 14075
|
1,488 sq. feet
|
1 baths 4 beds |
show details |
| Photo | Address | Area | Beds / Baths | Price | Details |
|---|---|---|---|---|---|

|
#41
Pleasant Ave
Hamburg, NY 14075
|
2,026 sq. feet
|
2 baths 3 beds |
show details | |

|
#42
Saint Marys Pl
Hamburg, NY 14075
|
2,004 sq. feet
|
2 baths 4 beds |
show details | |

|
#43
Blake Ln
Hamburg, NY 14075
|
1,994 sq. feet
|
1 baths 5 beds |
show details | |

|
#44
Crescent Ave
Hamburg, NY 14075
|
1,140 sq. feet
|
1 baths 3 beds |
show details | |

|
#45
Kingswood Ln
Hamburg, NY 14075
|
1,640 sq. feet
|
1 baths 3 beds |
show details | |

|
#46
E Prospect Ave
Hamburg, NY 14075
|
1,152 sq. feet
|
1 baths 3 beds |
show details | |

|
#47
Summerway Ln
Hamburg, NY 14075
|
1,789 sq. feet
|
2 baths 3 beds |
show details | |

|
#48
Lake Shore Rd
Hamburg, NY 14075
|
1,136 sq. feet
|
1 baths 3 beds |
show details | |

|
#49
Kennison Pkwy
Hamburg, NY 14075
|
1,450 sq. feet
|
1 baths 3 beds |
show details | |

|
Check over 1 million property listings on Foreclosure.com!
|
browse all offers | |||


- 8,81390.7%White alone
- 3763.9%Two or more races
- 1992.0%Hispanic
- 1271.3%Asian alone
- 1041.1%Black alone
- 350.4%Other race alone
Races in Hamburg detailed stats: ancestries, foreign born residents, place of birth
According to our research of New York and other state lists, there were 13 registered sex offenders living in Hamburg, New York as of April 12, 2025.
The ratio of all residents to sex offenders in Hamburg is 736 to 1.
Type |
2010 |
2011 |
2012 |
2013 |
2014 |
2015 |
2016 |
2017 |
2018 |
2019 |
2020 |
2022 |
2023 |
|---|---|---|---|---|---|---|---|---|---|---|---|---|---|
| Murders (per 100,000) | 0 (0.0) | 0 (0.0) | 0 (0.0) | 0 (0.0) | 0 (0.0) | 0 (0.0) | 0 (0.0) | 0 (0.0) | 0 (0.0) | 0 (0.0) | 0 (0.0) | 0 (0.0) | 0 (0.0) |
| Rapes (per 100,000) | 3 (31.9) | 4 (42.3) | 0 (0.0) | 2 (21.0) | 3 (31.4) | 1 (10.4) | 5 (52.0) | 3 (31.2) | 0 (0.0) | 0 (0.0) | 0 (0.0) | 0 (0.0) | 0 (0.0) |
| Robberies (per 100,000) | 2 (21.3) | 0 (0.0) | 0 (0.0) | 0 (0.0) | 2 (21.0) | 0 (0.0) | 1 (10.4) | 2 (20.8) | 0 (0.0) | 0 (0.0) | 1 (10.3) | 2 (20.4) | 0 (0.0) |
| Assaults (per 100,000) | 0 (0.0) | 4 (42.3) | 3 (31.7) | 6 (63.0) | 3 (31.4) | 4 (41.7) | 11 (114.5) | 10 (104.0) | 8 (82.2) | 2 (20.6) | 5 (51.3) | 11 (112.4) | 3 (30.7) |
| Burglaries (per 100,000) | 42 (446.4) | 35 (370.3) | 31 (328.1) | 40 (420.3) | 21 (220.0) | 17 (177.0) | 17 (176.9) | 19 (197.6) | 18 (184.9) | 10 (102.8) | 14 (143.7) | 12 (122.6) | 3 (30.7) |
| Thefts (per 100,000) | 174 (1,849) | 175 (1,852) | 178 (1,884) | 121 (1,271) | 107 (1,121) | 106 (1,104) | 82 (853.5) | 52 (540.7) | 76 (780.7) | 63 (647.8) | 56 (574.7) | 76 (776.5) | 34 (347.5) |
| Auto thefts (per 100,000) | 5 (53.1) | 3 (31.7) | 5 (52.9) | 0 (0.0) | 1 (10.5) | 0 (0.0) | 2 (20.8) | 3 (31.2) | 3 (30.8) | 3 (30.8) | 1 (10.3) | 5 (51.1) | 3 (30.7) |
| Arson (per 100,000) | 2 (21.3) | 0 (0.0) | 1 (10.6) | 0 (0.0) | 1 (10.5) | 0 (0.0) | 0 (0.0) | 0 (0.0) | 0 (0.0) | 0 (0.0) | 0 (0.0) | 0 (0.0) | 1 (10.2) |
| City-Data.com crime index | 141.4 | 144.9 | 108.9 | 109.7 | 98.8 | 73.2 | 115.8 | 89.9 | 63.1 | 39.7 | 47.2 | 72.3 | 24.6 |
The City-Data.com crime index weighs serious crimes and violent crimes more heavily. Higher means more crime, U.S. average is 240.7. It adjusts for the number of visitors and daily workers commuting into cities.
Crime rate in Hamburg detailed stats: murders, rapes, robberies, assaults, burglaries, thefts, arson
Full-time law enforcement employees in 2023, including police officers: 68 (64 officers - 59 male; 5 female).
| Officers per 1,000 residents here: | 1.34 |
| New York average: | 3.18 |
 Recent articles from our blog. Our writers, many of them Ph.D. graduates or candidates, create easy-to-read articles on a wide variety of topics.

 | Girls flag football officially comes to New York State (365 replies) |
| $1.82 billion in development for Niagara Falls area in the works.... (378 replies) |
| Bills want new stadium to be completely funded by taxpayer money (1314 replies) |
| Crane watch map (371 replies) |
| Update on some local startups... (250 replies) |
| Buffalo-Boom/Bust II (753 replies) |
Latest news from Hamburg, NY collected exclusively by city-data.com from local newspapers, TV, and radio stations
Ancestries: Irish (22.4%), American (20.0%), German (13.8%), Polish (12.3%), Italian (8.8%), English (2.6%).
Current Local Time: EST time zone
Incorporated in 1812
Elevation: 825 feet
Land area: 2.51 square miles.
Population density: 3,889 people per square mile (average).

178 residents are foreign born
| This village: | 1.8% |
| New York: | 22.6% |
Median real estate property taxes paid for housing units with mortgages in 2023: $6,940 (2.5%)
Median real estate property taxes paid for housing units with no mortgage in 2023: $6,545 (2.7%)
Nearest city with pop. 50,000+: Buffalo, NY (12.6 miles
, pop. 292,648).
Nearest city with pop. 1,000,000+: Philadelphia, PA (268.6 miles
, pop. 1,517,550).
Nearest cities:
Latitude: 42.72 N, Longitude: 78.83 W
Daytime population change due to commuting: +587 (+6.0%)
Workers who live and work in this village: 1,324 (25.9%)
Area code: 716

Hamburg tourist attractions:
Hamburg, New York accommodation & food services, waste management - Economy and Business Data
Single-family new house construction building permits:
- 2023: 72 buildings, average cost: $415,800
- 2022: 54 buildings, average cost: $378,900
- 2021: 76 buildings, average cost: $280,000
- 2020: 86 buildings, average cost: $239,900
- 2019: 118 buildings, average cost: $201,900
- 2018: 132 buildings, average cost: $155,000
- 2017: 116 buildings, average cost: $207,200
- 2016: 70 buildings, average cost: $170,700
- 2015: 89 buildings, average cost: $165,100
- 2014: 97 buildings, average cost: $163,300
- 2013: 129 buildings, average cost: $164,600
- 2012: 111 buildings, average cost: $164,700
- 2011: 108 buildings, average cost: $159,500
- 2010: 133 buildings, average cost: $156,300
- 2009: 98 buildings, average cost: $170,100
- 2008: 149 buildings, average cost: $172,800
- 2007: 176 buildings, average cost: $149,900
- 2006: 156 buildings, average cost: $180,300
- 2005: 201 buildings, average cost: $151,200
- 2004: 207 buildings, average cost: $147,600
- 2003: 221 buildings, average cost: $157,600
- 2002: 194 buildings, average cost: $137,200
- 2001: 208 buildings, average cost: $128,100
- 2000: 191 buildings, average cost: $123,700
- 1999: 177 buildings, average cost: $119,300
- 1998: 169 buildings, average cost: $99,800
- 1997: 130 buildings, average cost: $110,400
| Here: | 3.6% |
| New York: | 4.2% |
Population change in the 1990s: +33 (+0.3%).

- Health care & social assistance (17.6%)
- Educational services (10.0%)
- Accommodation & food services (8.5%)
- Professional, scientific, technical services (8.5%)
- Public administration (8.2%)
- Retail trade (8.0%)
- Finance & insurance (7.2%)

- Construction (12.1%)
- Public administration (10.5%)
- Accommodation & food services (10.2%)
- Professional, scientific, technical services (10.1%)
- Retail trade (9.3%)
- Manufacturing (8.6%)
- Health care & social assistance (7.4%)

- Health care & social assistance (28.3%)
- Educational services (14.6%)
- Other services, except public administration (8.9%)
- Finance & insurance (8.2%)
- Professional, scientific, technical services (6.8%)
- Accommodation & food services (6.8%)
- Retail trade (6.6%)
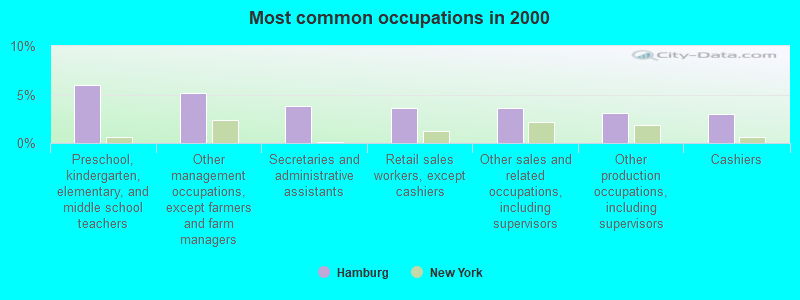
- Preschool, kindergarten, elementary, and middle school teachers (6.0%)
- Other management occupations, except farmers and farm managers (5.2%)
- Secretaries and administrative assistants (3.8%)
- Retail sales workers, except cashiers (3.6%)
- Other sales and related occupations, including supervisors (3.6%)
- Other production occupations, including supervisors (3.1%)
- Cashiers (3.0%)
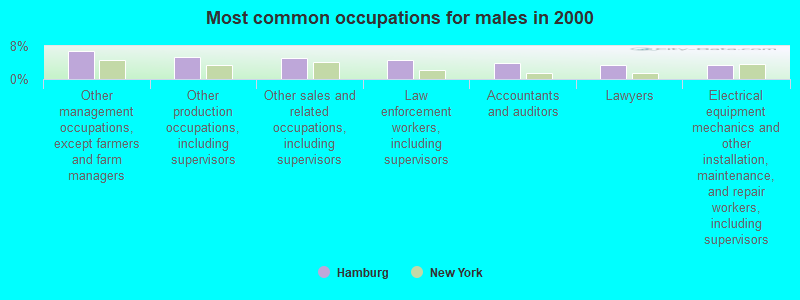
- Other management occupations, except farmers and farm managers (6.8%)
- Other production occupations, including supervisors (5.4%)
- Other sales and related occupations, including supervisors (5.0%)
- Law enforcement workers, including supervisors (4.7%)
- Accountants and auditors (3.9%)
- Lawyers (3.4%)
- Electrical equipment mechanics and other installation, maintenance, and repair workers, including supervisors (3.4%)
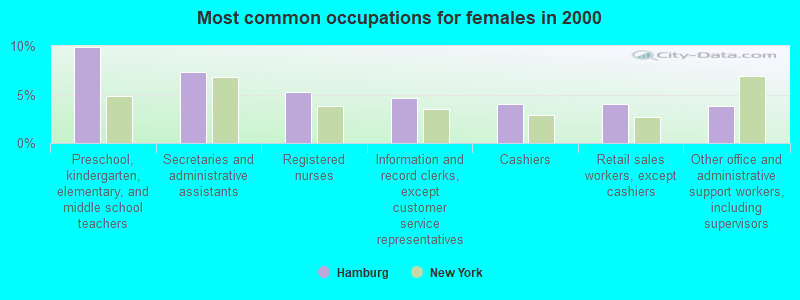
- Preschool, kindergarten, elementary, and middle school teachers (9.9%)
- Secretaries and administrative assistants (7.3%)
- Registered nurses (5.3%)
- Information and record clerks, except customer service representatives (4.6%)
- Cashiers (4.0%)
- Retail sales workers, except cashiers (4.0%)
- Other office and administrative support workers, including supervisors (3.8%)
Average climate in Hamburg, New York
Based on data reported by over 4,000 weather stations


|
|


(lower is better)
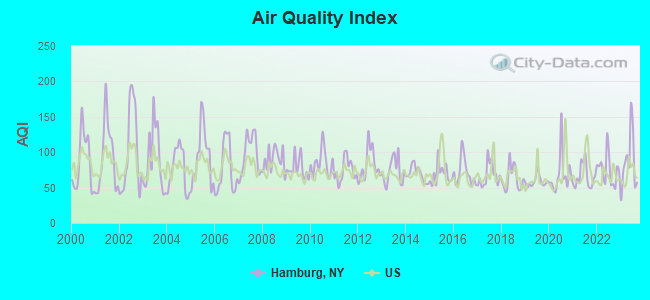
Air Quality Index (AQI) level in 2023 was 86.0. This is about average.
| City: | 86.0 |
| U.S.: | 72.6 |
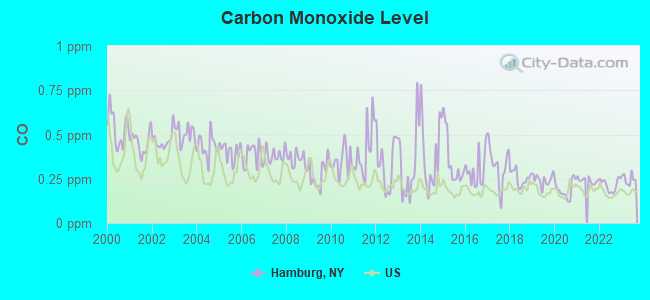
Carbon Monoxide (CO) [ppm] level in 2023 was 0.248. This is about average. Closest monitor was 10.7 miles away from the city center.
| City: | 0.248 |
| U.S.: | 0.251 |
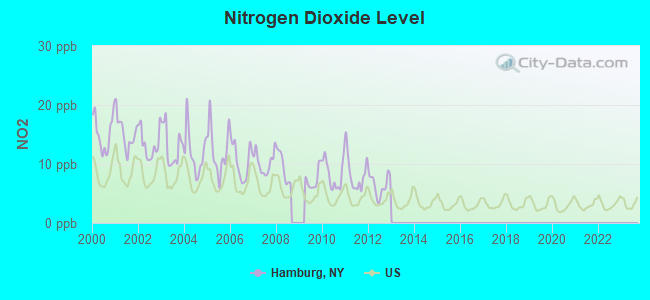
Nitrogen Dioxide (NO2) [ppb] level in 2012 was 6.43. This is worse than average. Closest monitor was 10.7 miles away from the city center.
| City: | 6.43 |
| U.S.: | 5.11 |
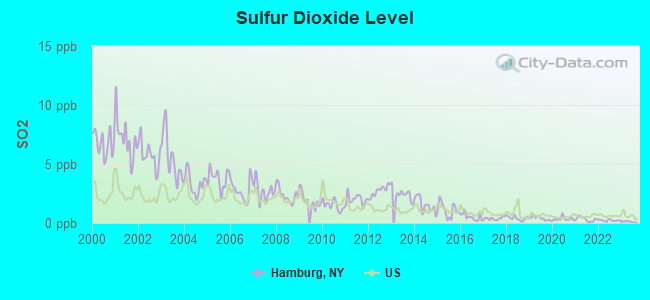
Sulfur Dioxide (SO2) [ppb] level in 2023 was 0.107. This is significantly better than average. Closest monitor was 7.3 miles away from the city center.
| City: | 0.107 |
| U.S.: | 1.515 |
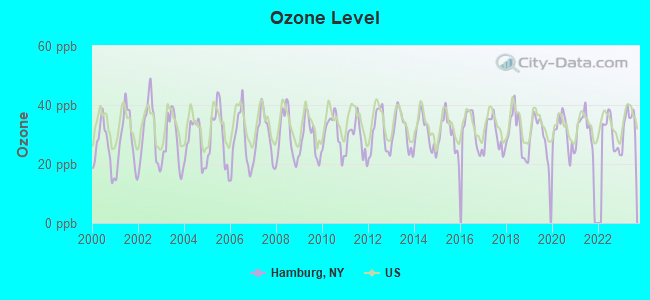
Ozone [ppb] level in 2023 was 33.8. This is about average. Closest monitor was 10.7 miles away from the city center.
| City: | 33.8 |
| U.S.: | 33.3 |
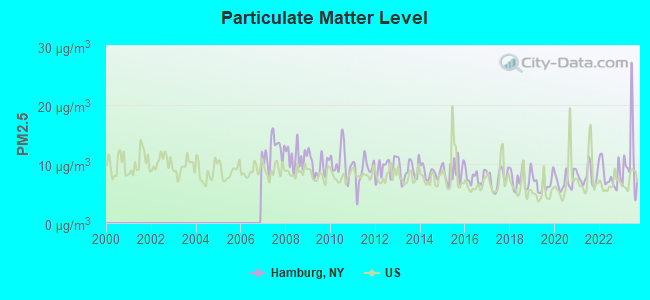
Particulate Matter (PM2.5) [µg/m3] level in 2023 was 10.6. This is worse than average. Closest monitor was 7.3 miles away from the city center.
| City: | 10.6 |
| U.S.: | 8.1 |
Tornado activity:
Hamburg-area historical tornado activity is slightly below New York state average. It is 67% smaller than the overall U.S. average.
On 8/19/1970, a category F3 (max. wind speeds 158-206 mph) tornado 3.7 miles away from the Hamburg village center injured 3 people and caused between $50,000 and $500,000 in damages.
On 7/24/1967, a category F3 tornado 22.5 miles away from the village center caused between $5000 and $50,000 in damages.
Earthquake activity:
Hamburg-area historical earthquake activity is significantly above New York state average. It is 66% smaller than the overall U.S. average.On 9/25/1998 at 19:52:52, a magnitude 5.2 (4.8 MB, 4.3 MS, 5.2 LG, 4.5 MW, Depth: 3.1 mi, Class: Moderate, Intensity: VI - VII) earthquake occurred 117.0 miles away from Hamburg center
On 1/31/1986 at 16:46:43, a magnitude 5.0 (5.0 MB) earthquake occurred 142.2 miles away from the city center
On 10/7/1983 at 10:18:46, a magnitude 5.3 (5.1 MB, 5.3 LG, 5.1 ML) earthquake occurred 241.4 miles away from the city center
On 8/23/2011 at 17:51:04, a magnitude 5.8 (5.8 MW, Depth: 3.7 mi) earthquake occurred 336.3 miles away from Hamburg center
On 4/20/2002 at 10:50:47, a magnitude 5.3 (5.3 ML, Depth: 3.0 mi) earthquake occurred 285.4 miles away from Hamburg center
On 4/20/2002 at 10:50:47, a magnitude 5.2 (5.2 MB, 4.2 MS, 5.2 MW, 5.0 MW) earthquake occurred 283.7 miles away from the city center
Magnitude types: regional Lg-wave magnitude (LG), body-wave magnitude (MB), local magnitude (ML), surface-wave magnitude (MS), moment magnitude (MW)
Natural disasters:
The number of natural disasters in Erie County (26) is greater than the US average (19).Major Disasters (Presidential) Declared: 11
Emergencies Declared: 10
Causes of natural disasters: Snowstorms: 8, Storms: 8, Floods: 7, Winter Storms: 5, Hurricanes: 2, Snows: 2, Blizzard: 1, Ice Storm: 1, Power Outage: 1, Wind: 1, Other: 3 (Note: some incidents may be assigned to more than one category).

Hospitals and medical centers in Hamburg:
Airports and heliports located in Hamburg:
- Hamburg Inc Airport (4G2) (Runways: 1, Itinerant Ops: 2,000, Local Ops: 10,000)
- Gibraltar Heliport (NK58)
- Woodlawn Beach State Park Heliport (1NY0)
Amtrak stations near Hamburg:
- 11 miles: BUFFALO-EXCHANGE STREET (BUFALO, EXCHANGE BTW ELLICOTT & WASHINGTON) . Services: ticket office, partially wheelchair accessible, enclosed waiting area, public restrooms, public payphones, vending machines, paid short-term parking, call for car rental service, call for taxi service, intercity bus service, public transit connection.
- 14 miles: BUFFALO-DEPEW (DEPEW, 55 DICK RD.) . Services: ticket office, partially wheelchair accessible, enclosed waiting area, public restrooms, public payphones, vending machines, free short-term parking, call for taxi service.
College/University in Hamburg:
Colleges/universities with over 2000 students nearest to Hamburg:
- Bryant & Stratton College-Online (about 6 miles; Orchard Park, NY; Full-time enrollment: 2,212)
- Erie Community College (about 12 miles; Buffalo, NY; FT enrollment: 11,035)
- D'Youville College (about 13 miles; Buffalo, NY; FT enrollment: 2,398)
- Canisius College (about 15 miles; Buffalo, NY; FT enrollment: 4,376)
- Medaille College (about 15 miles; Buffalo, NY; FT enrollment: 2,361)
- Buffalo State SUNY (about 15 miles; Buffalo, NY; FT enrollment: 10,439)
- Daemen College (about 17 miles; Amherst, NY; FT enrollment: 2,365)
Public high schools in Hamburg:
- FRONTIER SENIOR HIGH SCHOOL (Students: 1,679, Location: S 4432 BAY VIEW RD, Grades: 9-12)
- HAMBURG HIGH SCHOOL (Students: 1,247, Location: 4111 LEGION DR, Grades: 9-12)
- RANDOLPH ACADEMYHAMBURG CAMPUS (Location: 3780 HOWARD RD, Grades: KG-12)
Private high schools in Hamburg:
- IMMACULATA ACADEMY (Students: 203, Location: 5138 S PARK AVE, Grades: 9-12, Girls only)
- OLD TIME BAPTIST ACADEMY (Students: 26, Location: 6790 GOWANDA STATE RD, Grades: KG-11)
Public elementary/middle schools in Hamburg:
- FRONTIER MIDDLE SCHOOL (Students: 1,281, Location: 2751 AMSDELL RD, Grades: 6-8)
- HAMBURG MIDDLE SCHOOL (Students: 887, Location: 360 DIVISION ST, Grades: 1-8)
- UNION PLEASANT AVENUE ELEMENTARY SCHOOL (Students: 739, Location: 150 PLEASANT AVE, Grades: KG-5)
- CLOVERBANK ELEMENTARY SCHOOL (Students: 630, Location: 2761 CLOVERBANK RD, Grades: PK-5)
- BIG TREE ELEMENTARY SCHOOL (Students: 611, Location: S 4460 BAY VIEW RD, Grades: KG-5)
- ARMOR ELEMENTARY SCHOOL (Students: 443, Location: 5301 ABBOTT RD, Grades: KG-5)
- CHARLOTTE AVENUE ELEMENTARY SCHOOL (Students: 407, Location: 301 CHARLOTTE AVE, Grades: PK-5)
- BOSTON VALLEY ELEMENTARY SCHOOL (Students: 296, Location: 7476 BACK CREEK RD, Grades: KG-5)
Private elementary/middle school in Hamburg:
- ST MARY OF THE LAKE SCHOOL (Students: 171, Location: 4737 LAKE SHORE RD, Grades: PK-8)
User-submitted facts and corrections:
- Hamburg New York is one of two towns in the United States that claims to have invented the Hamburger.
- St. Francis High School should be added to private schools in Hamburg. Along with Immaculata Academy
Points of interest:
Notable locations in Hamburg: Hamburg Volunteer Fire Department (A), Hamburg Public Library Hamburg Branch (B), Rosewood Village Assisted Living Facility (C). Display/hide their locations on the map
Churches in Hamburg include: Trinity Episcopal Church (A), All Saints Lutheran Church (B), First Baptist Church of Hamburg (C), First Church of Christ (D), Hamburg Assembly of God Church (E), Hamburg Presbyterian Church (F), Hamburg United Methodist Church (G), Kingdom Hall of Jehovah's Witnesses (H), Saint James United Church of Christ (I). Display/hide their locations on the map
Tourist attractions: Boies-Lord House Museum (5853 South Park Avenue), Hamburg Historical Society Dunn House (Historical Places & Services; 6902 Gowanda State Road), Best of Arizona (Tours & Charters; 5999 South Park Avenue).
Hotels: Comfort Inn & Suites (3615 Commerce Place), Days Inn Hamburg (5220 Camp Road).
Birthplace of: Edgar Samuel Paxson - Artist, Manly Fleischmann - Lawyer, Trisha Romance - Painter and illustrator.
Drinking water stations with addresses in Hamburg and their reported violations in the past:
EDEN VALLEY COUNTRY CLUB (Address: 142 Chapel Glenn Drive , Population served: 25, Groundwater):Past monitoring violations:
- One routine major monitoring violation
- One regular monitoring violation
| This village: | 2.4 people |
| New York: | 2.6 people |
| This village: | 63.7% |
| Whole state: | 63.5% |
| This village: | 4.8% |
| Whole state: | 6.8% |
Likely homosexual households (counted as self-reported same-sex unmarried-partner households)
- Lesbian couples: 0.4% of all households
- Gay men: 0.1% of all households
18 people in group homes intended for adults in 2010
94 people in other noninstitutional group quarters in 2000
8 people in homes for the mentally retarded in 2000
Banks with most branches in Hamburg (2011 data):
- RBS Citizens, National Association: Mckinley Parkway/Tops Branch, Hamburg Branch, South Park - Hamburg/Tops Branch. Info updated 2007/09/19: Bank assets: $106,940.6 mil, Deposits: $75,690.2 mil, headquarters in Providence, RI, positive income, 1135 total offices, Holding Company: Uk Financial Investments Limited
- HSBC Bank USA, National Association: Hamburg Branch, Wanakah Branch, Hamburg Drive-In Branch. Info updated 2010/11/30: Bank assets: $206,009.7 mil, Deposits: $149,026.8 mil, headquarters in Mc Lean, VA, positive income, 474 total offices, Holding Company: Hsbc Holdings Plc
- Evans Bank, National Association: Hamburg Branch at 5999 South Park Ave, branch established on 1995/10/10; Administrative Office at 1 Grimsby Drive, branch established on 2004/09/20. Info updated 2009/07/27: Bank assets: $730.9 mil, Deposits: $618.8 mil, headquarters in Angola, NY, positive income, Commercial Lending Specialization, 14 total offices, Holding Company: Evans Bancorp, Inc.
- Bank of America, National Association: Hamburg Branch at 43 Main Street, branch established on 1964/03/06; Brierwood Square Branch at 5450 Southwestern Boulevard, branch established on 1960/09/28. Info updated 2009/11/18: Bank assets: $1,451,969.3 mil, Deposits: $1,077,176.8 mil, headquarters in Charlotte, NC, positive income, 5782 total offices, Holding Company: Bank Of America Corporation
- Manufacturers and Traders Trust Company: Hamburg Branch at 6000 South Park Avenue, branch established on 1964/07/30; Hamburg Branch at 5771 Camp Road, branch established on 1975/05/19. Info updated 2011/08/08: Bank assets: $76,887.1 mil, Deposits: $60,064.2 mil, headquarters in Buffalo, NY, positive income, Commercial Lending Specialization, 808 total offices, Holding Company: M&T Bank Corporation
- KeyBank National Association: Hamburg Ii Branch at 5510 Camp Road, branch established on 1978/12/27; Hamburg Branch at 25 Main Street, branch established on 1978/01/01. Info updated 2008/03/03: Bank assets: $86,198.8 mil, Deposits: $64,214.8 mil, headquarters in Cleveland, OH, positive income, Commercial Lending Specialization, 1067 total offices, Holding Company: Keycorp
- First Niagara Bank, National Association: Brierwood Branch at 5334 Southwestern Boulevard, branch established on 2009/10/26; Hamburg Branch at 5751 South Park Avenue, branch established on 1995/10/30. Info updated 2011/06/09: Bank assets: $32,750.6 mil, Deposits: $19,595.4 mil, headquarters in Buffalo, NY, positive income, Commercial Lending Specialization, 351 total offices, Holding Company: First Niagara Financial Group, Inc.
- Lake Shore Savings Bank: Hamburg Branch at 59 Main Street, branch established on 2005/12/05. Info updated 2011/07/21: Bank assets: $485.8 mil, Deposits: $383.2 mil, headquarters in Dunkirk, NY, positive income, Mortgage Lending Specialization, 10 total offices
- Woodforest National Bank: Ny Hamburg Branch at 5360 South Western Blvd, branch established on 2009/10/28. Info updated 2011/05/10: Bank assets: $3,488.9 mil, Deposits: $3,097.6 mil, headquarters in Houston, TX, positive income, Commercial Lending Specialization, 766 total offices, Holding Company: Woodforest Financial Group Employee Stock Ownership Plan (With 401(K) Provisions)
For population 15 years and over in Hamburg:
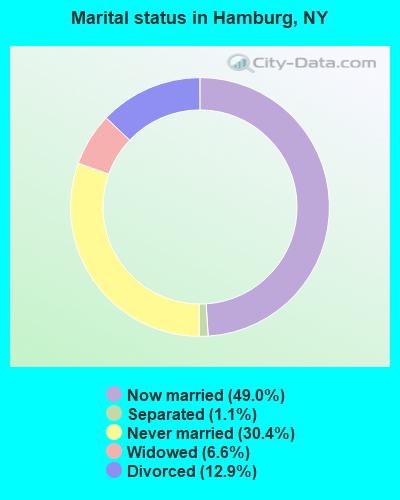
- Never married: 31.9%
- Now married: 51.4%
- Separated: 1.1%
- Widowed: 6.1%
- Divorced: 9.5%
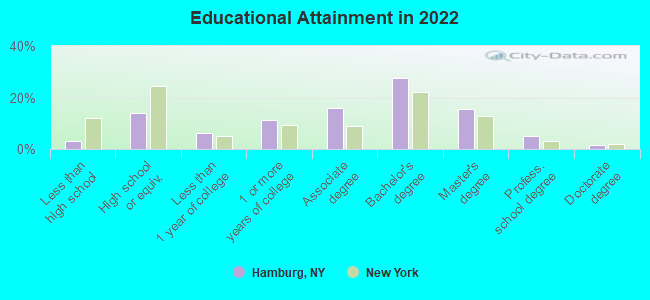
For population 25 years and over in Hamburg:
- High school or higher: 96.9%
- Bachelor's degree or higher: 50.4%
- Graduate or professional degree: 21.5%
- Unemployed: 2.3%
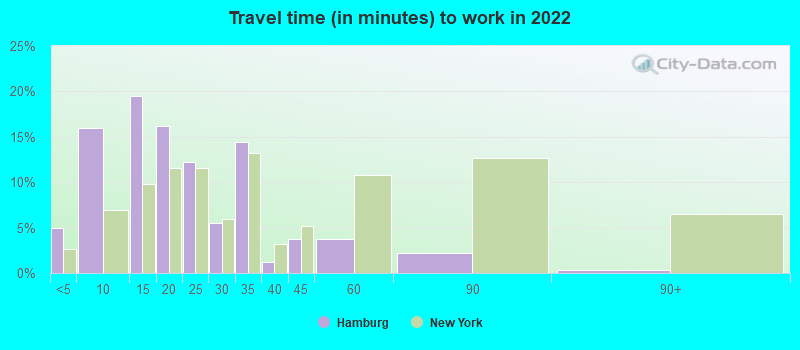
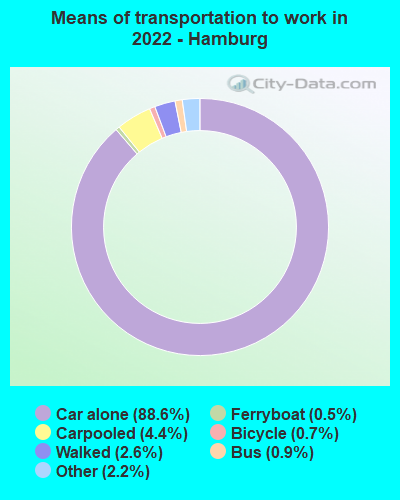
- Mean travel time to work (commute): 20.9 minutes
| Here: | 9.0 |
| New York average: | 13.8 |
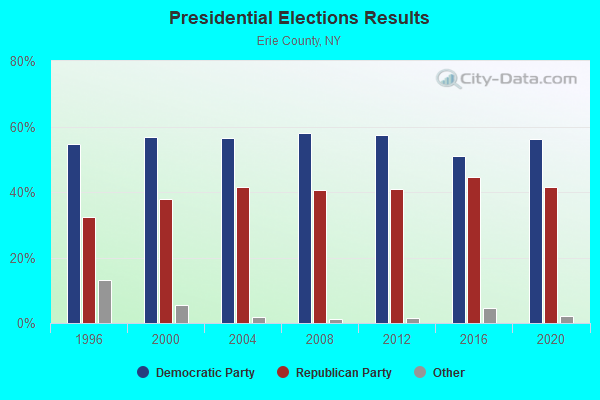
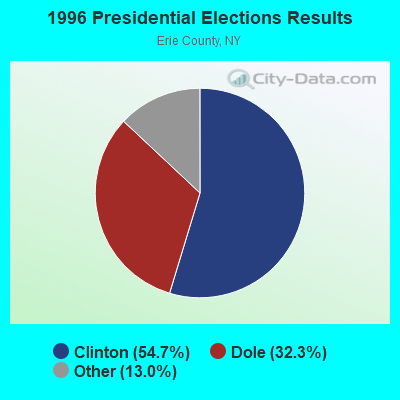
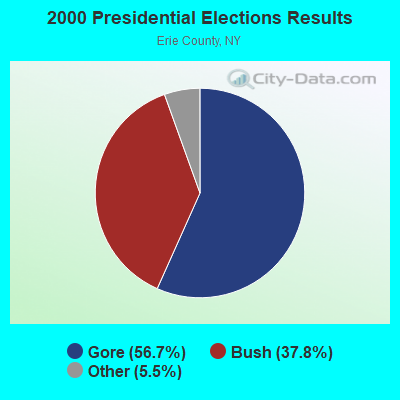
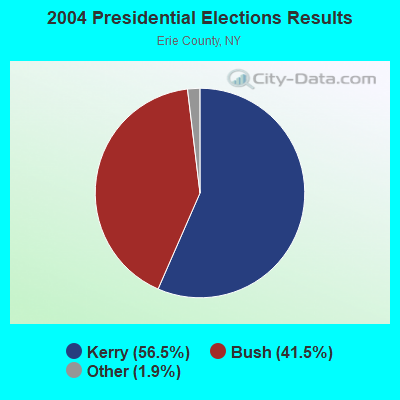
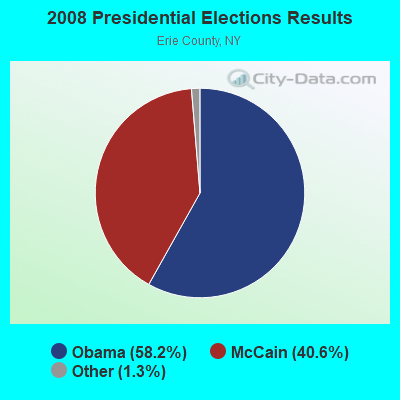
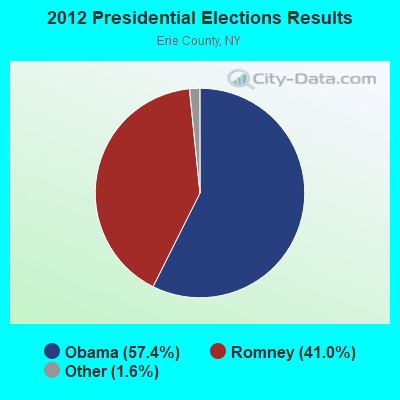
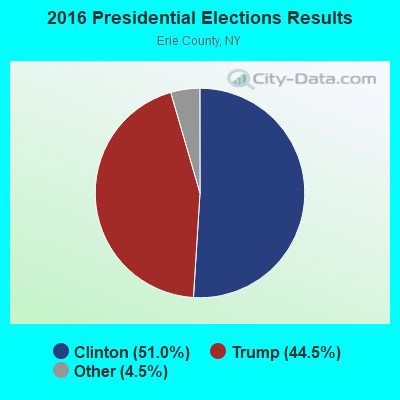


Graphs represent county-level data. Detailed 2008 Election Results
Religion statistics for Hamburg, NY (based on Erie County data)
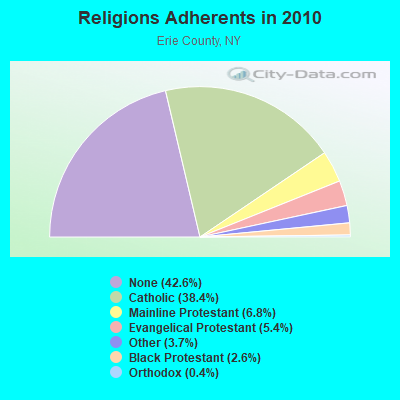
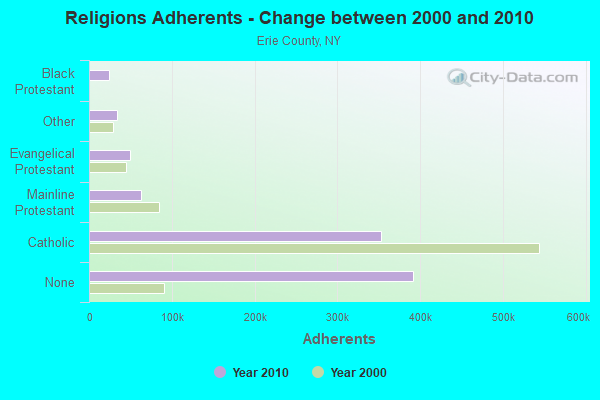
| Religion | Adherents | Congregations |
|---|---|---|
| Catholic | 352,894 | 111 |
| Mainline Protestant | 62,675 | 212 |
| Evangelical Protestant | 49,435 | 209 |
| Other | 34,076 | 79 |
| Black Protestant | 24,192 | 69 |
| Orthodox | 4,103 | 9 |
| None | 391,665 | - |
Food Environment Statistics:
| Here: | 2.59 / 10,000 pop. |
| New York: | 4.13 / 10,000 pop. |
| Erie County: | 0.05 / 10,000 pop. |
| New York: | 0.06 / 10,000 pop. |
| Erie County: | 1.37 / 10,000 pop. |
| New York: | 0.92 / 10,000 pop. |
| Erie County: | 2.50 / 10,000 pop. |
| New York: | 1.68 / 10,000 pop. |
| Here: | 8.11 / 10,000 pop. |
| New York: | 8.82 / 10,000 pop. |
| Here: | 9.8% |
| New York: | 8.2% |
| Erie County: | 26.9% |
| State: | 23.8% |
| Erie County: | 13.4% |
| New York: | 15.6% |
Health and Nutrition:
| Hamburg: | 50.0% |
| New York: | 50.1% |
| Hamburg: | 47.1% |
| New York: | 48.1% |
| Hamburg: | 28.5 |
| New York: | 28.5 |
| Here: | 23.9% |
| New York: | 20.3% |
| Hamburg: | 9.3% |
| New York: | 11.1% |
| Hamburg: | 6.9 |
| New York: | 6.8 |
| This city: | 34.1% |
| State: | 33.4% |
| Here: | 55.2% |
| New York: | 56.5% |
| Hamburg: | 77.2% |
| New York: | 80.2% |
More about Health and Nutrition of Hamburg, NY Residents
| Local government employment and payroll (March 2022) | |||||
| Function | Full-time employees | Monthly full-time payroll | Average yearly full-time wage | Part-time employees | Monthly part-time payroll |
|---|---|---|---|---|---|
| Streets and Highways | 14 | $84,535 | $72,459 | 0 | $0 |
| Police Protection - Officers | 14 | $111,071 | $95,204 | 0 | $0 |
| Solid Waste Management | 9 | $44,388 | $59,184 | 0 | $0 |
| Financial Administration | 5 | $27,797 | $66,713 | 1 | $1,370 |
| Parks and Recreation | 5 | $21,056 | $50,534 | 25 | $18,378 |
| Judicial and Legal | 1 | $4,039 | $48,468 | 6 | $3,738 |
| Other Government Administration | 0 | $0 | 7 | $3,174 | |
| Other and Unallocable | 0 | $0 | 1 | $1,519 | |
| Police - Other | 0 | $0 | 9 | $6,256 | |
| Totals for Government | 48 | $292,886 | $73,222 | 49 | $34,435 |
Hamburg government finances - Expenditure in 2022 (per resident):
- Construction - General - Other: $2,005,000 ($205.14)
Parks and Recreation: $658,000 ($67.32)
Regular Highways: $257,000 ($26.29)
Police Protection: $63,000 ($6.45)
Local Fire Protection: $36,000 ($3.68)
Financial Administration: $5,000 ($0.51)
Health - Other: $4,000 ($0.41)
Solid Waste Management: $3,000 ($0.31)
- Current Operations - General - Other: $3,693,000 ($377.84)
Police Protection: $1,542,000 ($157.77)
Regular Highways: $1,422,000 ($145.49)
Parks and Recreation: $728,000 ($74.48)
Solid Waste Management: $503,000 ($51.46)
Financial Administration: $448,000 ($45.84)
Local Fire Protection: $222,000 ($22.71)
Judicial and Legal Services: $188,000 ($19.23)
Central Staff Services: $98,000 ($10.03)
General Public Buildings: $56,000 ($5.73)
Health - Other: $15,000 ($1.53)
- General - Interest on Debt: $404,000 ($41.33)
- Total Salaries and Wages: $4,250,000 ($434.83)
- Water Utilities - Interest on Debt: $69,000 ($7.06)
Hamburg government finances - Revenue in 2022 (per resident):
- Charges - Parks and Recreation: $312,000 ($31.92)
Other: $55,000 ($5.63)
Solid Waste Management: $4,000 ($0.41)
- Federal Intergovernmental - Other: $381,000 ($38.98)
- Local Intergovernmental - Other: $1,829,000 ($187.13)
- Miscellaneous - General Revenue - Other: $411,000 ($42.05)
Interest Earnings: $398,000 ($40.72)
Rents: $164,000 ($16.78)
Fines and Forfeits: $105,000 ($10.74)
- State Intergovernmental - Other: $267,000 ($27.32)
- Tax - Property: $7,388,000 ($755.88)
Public Utilities Sales: $242,000 ($24.76)
Other License: $171,000 ($17.50)
Occupation and Business License - Other: $3,000 ($0.31)
Amusements License: $1,000 ($0.10)
Hamburg government finances - Debt in 2022 (per resident):
- Long Term Debt - Beginning Outstanding - Unspecified Public Purpose: $4,630,000 ($473.71)
Outstanding Unspecified Public Purpose: $4,214,000 ($431.14)
Retired Unspecified Public Purpose: $1,260,000 ($128.91)
Issue, Unspecified Public Purpose: $844,000 ($86.35)
- Short Term Debt Outstanding - Beginning: $7,120,000 ($728.46)
End of Fiscal Year: $6,800,000 ($695.72)
2.96% of this county's 2021 resident taxpayers lived in other counties in 2020 ($58,957 average adjusted gross income)
| Here: | 2.96% |
| New York average: | 5.29% |
0.01% of residents moved from foreign countries ($164 average AGI)
Erie County: 0.01% New York average: 0.01%
Top counties from which taxpayers relocated into this county between 2020 and 2021:
| from Niagara County, NY | |
| from Queens County, NY | |
| from Monroe County, NY |
3.42% of this county's 2020 resident taxpayers moved to other counties in 2021 ($64,893 average adjusted gross income)
| Here: | 3.42% |
| New York average: | 6.93% |
0.01% of residents moved to foreign countries ($150 average AGI)
Erie County: 0.01% New York average: 0.02%
Top counties to which taxpayers relocated from this county between 2020 and 2021:
| to Niagara County, NY | |
| to Monroe County, NY | |
| to Cattaraugus County, NY |
| Businesses in Hamburg, NY | ||||
| Name | Count | Name | Count | |
|---|---|---|---|---|
| 7-Eleven | 1 | Lane Furniture | 1 | |
| ALDI | 1 | Lowe's | 1 | |
| AT&T | 2 | MasterBrand Cabinets | 2 | |
| Advance Auto Parts | 1 | McDonald's | 2 | |
| Arby's | 2 | Nike | 2 | |
| AutoZone | 1 | Payless | 1 | |
| Blockbuster | 1 | Penske | 1 | |
| Buffalo Wild Wings | 1 | Pizza Hut | 1 | |
| Burger King | 1 | Quality | 1 | |
| CVS | 2 | RadioShack | 1 | |
| Chevrolet | 1 | Red Roof Inn | 1 | |
| Cold Stone Creamery | 1 | Rite Aid | 2 | |
| Comfort Inn | 1 | Subway | 6 | |
| Curves | 1 | Super 8 | 1 | |
| DHL | 2 | T-Mobile | 2 | |
| Dairy Queen | 1 | T.J.Maxx | 1 | |
| Dennys | 1 | Tim Hortons | 7 | |
| Dunkin Donuts | 1 | Toys"R"Us | 1 | |
| Fashion Bug | 1 | True Value | 1 | |
| FedEx | 2 | U-Haul | 2 | |
| GNC | 2 | UPS | 6 | |
| Goodwill | 7 | Walgreens | 1 | |
| H&R Block | 1 | Walmart | 1 | |
| Holiday Inn | 1 | Wendy's | 1 | |
| Jones New York | 1 | World Gym | 1 | |
| Just Tires | 1 | |||
Strongest AM radio stations in Hamburg:
- WWKB (1520 AM; 50 kW; BUFFALO, NY; Owner: ENTERCOM BUFFALO LICENSE, LLC)
- WGR (550 AM; 5 kW; BUFFALO, NY; Owner: ENTERCOM BUFFALO LICENSE, LLC)
- WNED (970 AM; 5 kW; BUFFALO, NY)
- WHLD (1270 AM; 5 kW; NIAGARA FALLS, NY; Owner: CITADEL BROADCASTING COMPANY)
- WXRL (1300 AM; 5 kW; LANCASTER, NY; Owner: DOME BROADCASTING, INC.)
- WMNY (1120 AM; daytime; 1 kW; BUFFALO, NY; Owner: CITADEL BROADCASTING COMPANY)
- WBEN (930 AM; 5 kW; BUFFALO, NY; Owner: ENTERCOM BUFFALO LICENSE, LLC)
- WHAM (1180 AM; 50 kW; ROCHESTER, NY; Owner: CITICASTERS LICENSES, L.P.)
- WTOR (770 AM; daytime; 9 kW; YOUNGSTOWN, NY; Owner: BIRACH BROADCASTING CORPORATION)
- WJJL (1440 AM; 5 kW; NIAGARA FALLS, NY; Owner: M.J. PHILLIPS COMMUNICATIONS, INC.)
- WECK (1230 AM; 1 kW; CHEEKTOWAGA, NY; Owner: INFINITY RADIO OPERATIONS INC.)
- WUFO (1080 AM; daytime; 1 kW; AMHERST, NY)
- WWWS (1400 AM; 1 kW; BUFFALO, NY; Owner: ENTERCOM BUFFALO LICENSE, LLC)
Strongest FM radio stations in Hamburg:
- WFBF (89.9 FM; BUFFALO, NY; Owner: FAMILY STATIONS, INC.)
- WNED-FM (94.5 FM; BUFFALO, NY; Owner: WESTERN NEW YORK PUBLIC B/C ASSOC.)
- WTSS (102.5 FM; BUFFALO, NY; Owner: ENTERCOM BUFFALO LICENSE, LLC)
- WDCX (99.5 FM; BUFFALO, NY; Owner: KIMTRON, INC.)
- WBUF (92.9 FM; BUFFALO, NY; Owner: INFINITY RADIO OPERATIONS INC.)
- WHTT-FM (104.1 FM; BUFFALO, NY; Owner: CITADEL BROADCASTING COMPANY)
- WGRF (96.9 FM; BUFFALO, NY; Owner: CITADEL BROADCASTING COMPANY)
- WBLK (93.7 FM; DEPEW, NY; Owner: INFINITY RADIO OPERATIONS INC.)
- WJYE (96.1 FM; BUFFALO, NY; Owner: INFINITY RADIO OPERATIONS INC.)
- WYRK (106.5 FM; BUFFALO, NY; Owner: INFINITY RADIO OPERATIONS INC.)
- W284AP (104.7 FM; BUFFALO, NY; Owner: FAMILY LIFE MINISTRIES, INC.)
- WEDG (103.3 FM; BUFFALO, NY; Owner: CITADEL BROADCASTING COMPANY)
- WNSA (107.7 FM; WETHERSFIELD TWNSHP, NY; Owner: ADELPHIA COMMUNICATIONS CORPORATION, DEBTOR-IN-POSSESSION)
- WKSE (98.5 FM; NIAGARA FALLS, NY; Owner: ENTERCOM BUFFALO LICENSE, LLC)
- WLOF (101.7 FM; ATTICA, NY; Owner: HOLY FAMILY COMMUNICATIONS, INC.)
- WCOU (88.3 FM; WARSAW, NY; Owner: FAMILY LIFE MINISTRIES, INC.)
- WBFO (88.7 FM; BUFFALO, NY; Owner: STATE UNIVERSITY OF NEW YORK)
- W207BB (89.3 FM; BUFFALO, NY; Owner: PENSACOLA CHRISTIAN COLLEGE, INC)
- WBNY (91.3 FM; BUFFALO, NY; Owner: STATE UNIVERSITY OF NEW YORK)
TV broadcast stations around Hamburg:
- WKBW-TV (Channel 7; BUFFALO, NY; Owner: WKBW-TV LICENSE, INC.)
- WIVB-TV (Channel 4; BUFFALO, NY; Owner: WIVB BROADCASTING, LLC)
- WGRZ-TV (Channel 2; BUFFALO, NY; Owner: MULTIMEDIA ENTERTAINMENT, INC.)
- WDTB-LP (Channel 39; HAMBURG, NY; Owner: WORD OF GOD FELLOWSHIP, INC.)
- WFHW-LP (Channel 58; BUFFALO, NY; Owner: CITIZENS TELEVISION SYSTEM, INC.)
- WBXZ-LP (Channel 56; BUFFALO, NY; Owner: RENARD COMMUNICATIONS CORP.)
- WNYO-TV (Channel 49; BUFFALO, NY; Owner: NEW YORK TELEVISION, INC.)
- WUTV (Channel 29; BUFFALO, NY; Owner: WUTV LICENSEE, LLC)
- WNED-TV (Channel 17; BUFFALO, NY; Owner: WESTERN NY PUBLIC BROADCASTING ASSOC.)
- WNLO (Channel 23; BUFFALO, NY; Owner: WIVB BROADCASTING, LLC)
- WNGS (Channel 67; SPRINGVILLE, NY; Owner: CAROLINE K. POWLEY D/B/A UNICORN/SPRINGVILLE)
- WNYB (Channel 26; JAMESTOWN, NY; Owner: FAITH BROADCASTING NETWORK, INC.)
- WBNF-CA (Channel 15; BUFFALO, NY; Owner: FAITH BROADCASTING NETWORK, INC.)
- WPXJ-TV (Channel 51; BATAVIA, NY; Owner: PAXSON BUFFALO LICENSE, INC.)
Medal of Honor Recipients
Medal of Honor Recipient born in Hamburg: Henry C. Meyer.
- National Bridge Inventory (NBI) Statistics
- 4Number of bridges
- 36ft / 11.5mTotal length
- 24,211Total average daily traffic
- 287Total average daily truck traffic
FCC Registered Antenna Towers: 125 (See the full list of FCC Registered Antenna Towers)
FCC Registered Broadcast Land Mobile Towers: 22 (See the full list of FCC Registered Broadcast Land Mobile Towers in Hamburg, NY)
FCC Registered Microwave Towers: 29 (See the full list of FCC Registered Microwave Towers in this town)
FCC Registered Amateur Radio Licenses: 189 (See the full list of FCC Registered Amateur Radio Licenses in Hamburg)
FAA Registered Aircraft Manufacturers and Dealers: 1 (See the full list of FAA Registered Manufacturers and Dealers in Hamburg)
FAA Registered Aircraft: 17 (See the full list of FAA Registered Aircraft)
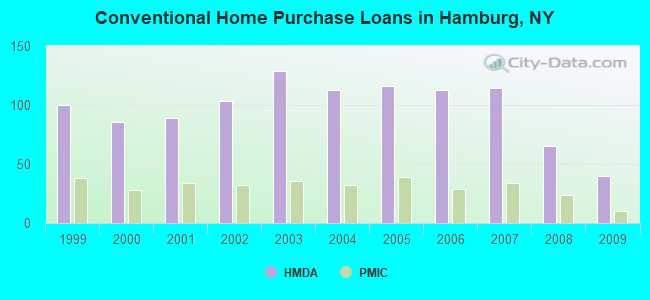
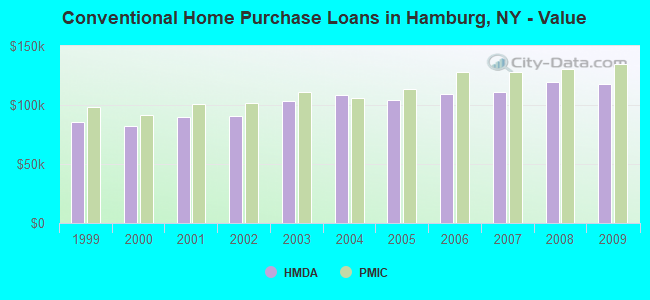
| Home Mortgage Disclosure Act Aggregated Statistics For Year 2009 (Based on 2 partial tracts) | ||||||||||||||
| A) FHA, FSA/RHS & VA Home Purchase Loans | B) Conventional Home Purchase Loans | C) Refinancings | D) Home Improvement Loans | E) Loans on Dwellings For 5+ Families | F) Non-occupant Loans on < 5 Family Dwellings (A B C & D) | G) Loans On Manufactured Home Dwelling (A B C & D) | ||||||||
|---|---|---|---|---|---|---|---|---|---|---|---|---|---|---|
| Number | Average Value | Number | Average Value | Number | Average Value | Number | Average Value | Number | Average Value | Number | Average Value | Number | Average Value | |
| LOANS ORIGINATED | 50 | $129,948 | 40 | $118,101 | 93 | $120,643 | 7 | $36,714 | 2 | $325,730 | 7 | $98,747 | 0 | $0 |
| APPLICATIONS APPROVED, NOT ACCEPTED | 2 | $217,065 | 8 | $162,945 | 16 | $133,652 | 3 | $15,617 | 1 | $117,280 | 1 | $66,950 | 1 | $55,050 |
| APPLICATIONS DENIED | 5 | $150,490 | 2 | $102,660 | 31 | $168,159 | 9 | $24,201 | 0 | $0 | 2 | $252,925 | 0 | $0 |
| APPLICATIONS WITHDRAWN | 4 | $118,628 | 1 | $117,280 | 27 | $138,311 | 2 | $125,435 | 0 | $0 | 0 | $0 | 0 | $0 |
| FILES CLOSED FOR INCOMPLETENESS | 0 | $0 | 0 | $0 | 8 | $119,220 | 0 | $0 | 0 | $0 | 1 | $61,740 | 0 | $0 |
Detailed HMDA statistics for the following Tracts: 0133.00 , 0134.00
| Private Mortgage Insurance Companies Aggregated Statistics For Year 2009 (Based on 2 partial tracts) | ||||||
| A) Conventional Home Purchase Loans | B) Refinancings | C) Non-occupant Loans on < 5 Family Dwellings (A & B) | ||||
|---|---|---|---|---|---|---|
| Number | Average Value | Number | Average Value | Number | Average Value | |
| LOANS ORIGINATED | 10 | $134,904 | 7 | $154,766 | 1 | $110,100 |
| APPLICATIONS APPROVED, NOT ACCEPTED | 4 | $120,122 | 0 | $0 | 0 | $0 |
| APPLICATIONS DENIED | 3 | $154,693 | 0 | $0 | 1 | $133,230 |
| APPLICATIONS WITHDRAWN | 0 | $0 | 0 | $0 | 0 | $0 |
| FILES CLOSED FOR INCOMPLETENESS | 0 | $0 | 0 | $0 | 0 | $0 |
Detailed PMIC statistics for the following Tracts: 0133.00 , 0134.00
2002 - 2018 National Fire Incident Reporting System (NFIRS) incidents
- Fire incident types reported to NFIRS in Hamburg, NY
- 1,40557.1%Structure Fires
- 50520.5%Outside Fires
- 29512.0%Mobile Property/Vehicle Fires
- 25710.4%Other
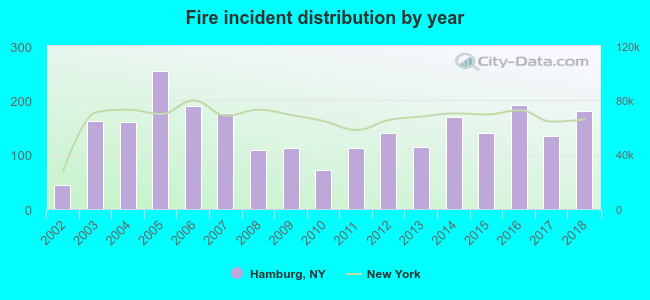 Based on the data from the years 2002 - 2018 the average number of fire incidents per year is 145. The highest number of fires - 254 took place in 2005, and the least - 45 in 2002. The data has a rising trend.
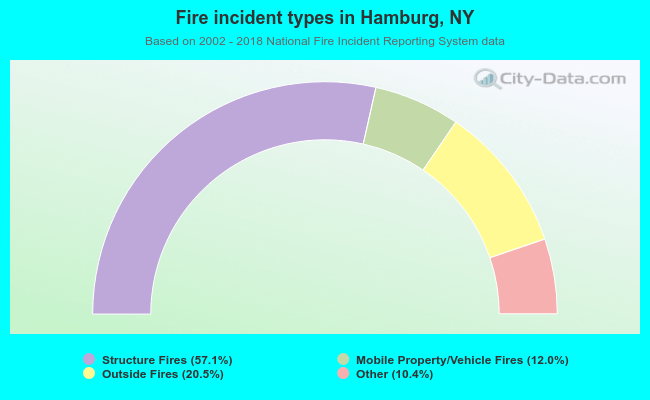 When looking into fire subcategories, the most reports belonged to: Structure Fires (57.1%), and Outside Fires (20.5%).
Fire-safe hotels and motels in Hamburg, New York:
- Holiday Inn-hamburg, 5440 CP Rd, Hamburg, New York 14075 , Phone: (716) 649-0500, Fax: (716) 648-2278
- Holiday Inn Express & Suites - Buffalo/Hamburg, 3565 Commerce Pl, Hamburg, New York 14075 , Phone: (716) 648-9200, Fax: (716) 649-9205
- Hampton Inn by Hilton Buffalo Hamburg, 5444 Camp Rd, Hamburg, New York 14075 , Phone: (716) 649-3769, Fax: (716) 649-3873
- Comfort Inn & Suites Hamburg, 3615 Commerce Pl, Hamburg, New York 14075 , Phone: (716) 648-2922, Fax: (716) 648-2904
- Red Roof Inn, 5370 Camp Rd, Hamburg, New York 14075 , Phone: (800) 733-7663, Fax: (716) 648-7324
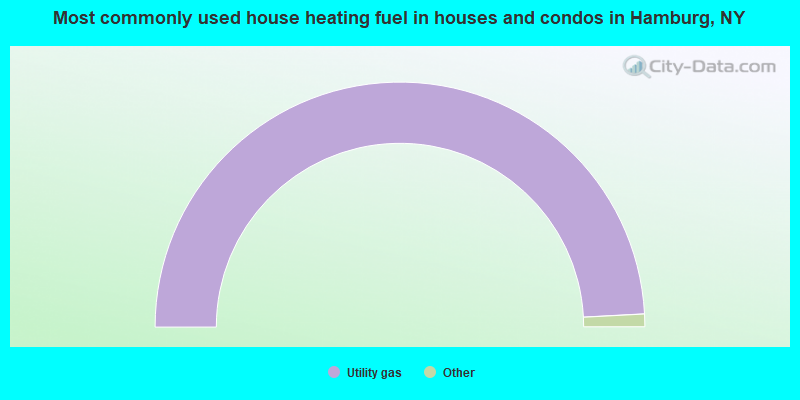
- 97.4%Utility gas
- 1.4%Electricity
- 0.7%Bottled, tank, or LP gas
- 0.5%No fuel used
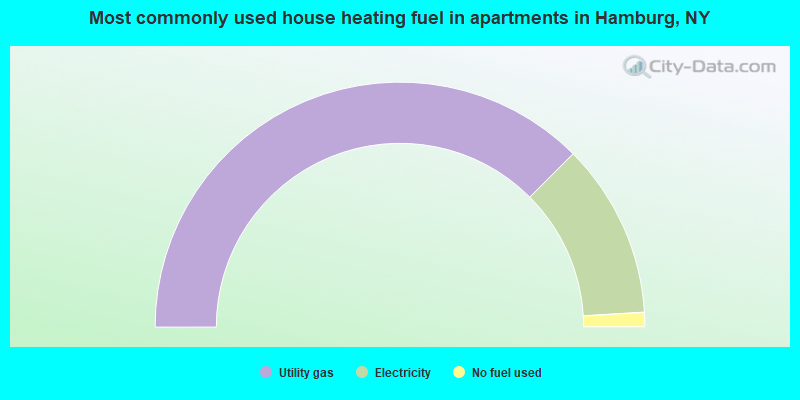
- 78.7%Utility gas
- 17.2%Electricity
- 2.2%Fuel oil, kerosene, etc.
- 2.0%No fuel used
Hamburg compared to New York state average:
- Median house value below state average.
- Unemployed percentage significantly below state average.
- Black race population percentage significantly below state average.
- Hispanic race population percentage significantly below state average.
- Foreign-born population percentage significantly below state average.
- Renting percentage below state average.
- Length of stay since moving in above state average.
- Number of rooms per house above state average.
- Percentage of population with a bachelor's degree or higher above state average.

|
|
Total of 155 patent applications in 2008-2025.