Milton, West Virginia
Submit your own pictures of this town and show them to the world
- OSM Map
- General Map
- Google Map
- MSN Map

Population change since 2000: +25.4%
| Males: 1,224 | |
| Females: 1,543 |
| Median resident age: | 40.1 years |
| West Virginia median age: | 42.9 years |
Zip codes: 25541.
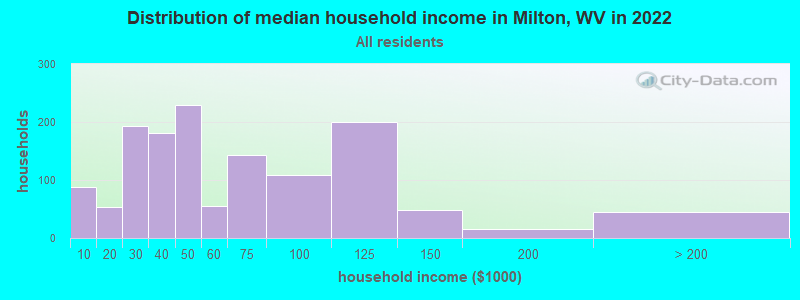
| Milton: | $45,740 |
| WV: | $54,329 |
Estimated per capita income in 2022: $28,387 (it was $15,384 in 2000)
Milton town income, earnings, and wages data
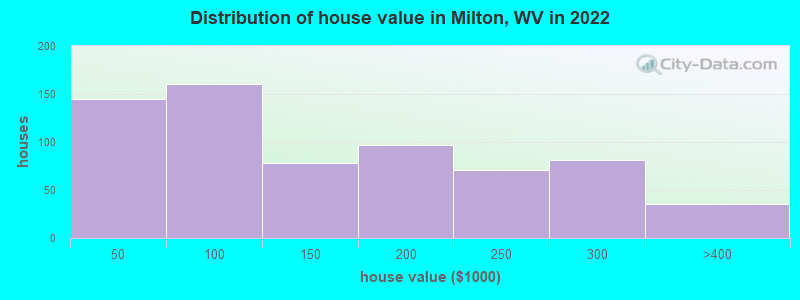
Estimated median house or condo value in 2022: $103,564 (it was $66,300 in 2000)
| Milton: | $103,564 |
| WV: | $155,100 |
Mean prices in 2022: all housing units: $157,735; detached houses: $169,480; townhouses or other attached units: $158,394; mobile homes: $36,849
Median gross rent in 2022: $973.
Detailed information about poverty and poor residents in Milton, WV
Compare current foreclosures near Milton, WV:
| Photo | Address | Area | Beds / Baths | Price | Details |
|---|---|---|---|---|---|

|
#1
Misty Valley Ln
Milton, WV 25541
|
1,200 sq. feet
|
2 baths 3 beds |
show details | |

|
#2
Sunset Ter
Milton, WV 25541
|
1,892 sq. feet
|
1 baths 3 beds |
show details | |

|
#3
Poplar St
Milton, WV 25541
|
1,392 sq. feet
|
2 baths 3 beds |
show details | |

|
#4
Kirby Rd, Trlr 23
Milton, WV 25541
|
- sq. feet
|
- baths - beds |
show details | |

|
#5
County Hwy-25/1
Milton, WV 25541
|
- sq. feet
|
- baths - beds |
show details | |

|
#6
Lower Creek Rd
Milton, WV 25541
|
- sq. feet
|
- baths - beds |
show details | |

|
#7
Straight Frk
Griffithsville, WV 25521
|
1,236 sq. feet
|
1 baths 3 beds |
$145,000
|
show details |

|
#8
Pkwy Dr
Huntington, WV 25705
|
2,279 sq. feet
|
2 baths 3 beds |
$215,000
|
show details |

|
#9
Big Seven Mile Rd
Lesage, WV 25537
|
1,752 sq. feet
|
2 baths 4 beds |
$186,000
|
show details |

|
#10
Washington Hill Rd
Hurricane, WV 25526
|
- sq. feet
|
2 baths 4 beds |
$24,900
|
show details |
| Photo | Address | Area | Beds / Baths | Price | Details |
|---|---|---|---|---|---|

|
#11
4th Ave
Huntington, WV 25702
|
1,305 sq. feet
|
2 baths 3 beds |
$37,900
|
show details |

|
#12
Beech St
Huntington, WV 25701
|
1,524 sq. feet
|
1 baths 3 beds |
$9,900
|
show details |

|
#13
Doss Hill Rd
Barboursville, WV 25504
|
1,040 sq. feet
|
1 baths 2 beds |
$23,900
|
show details |

|
#14
Charleston Ave
Huntington, WV 25701
|
1,200 sq. feet
|
2 baths 4 beds |
$27,900
|
show details |

|
#15
Township Road 1365
Proctorville, OH 45669
|
2,296 sq. feet
|
2 baths 3 beds |
show details | |

|
#16
Spring Dr
Huntington, WV 25705
|
1,176 sq. feet
|
1 baths 3 beds |
show details | |

|
#17
Township Rd 1365
Proctorville, OH 45669
|
2,296 sq. feet
|
3 baths 3 beds |
show details | |

|
#18
Township Road 1132
Proctorville, OH 45669
|
1,904 sq. feet
|
2 baths 4 beds |
show details | |

|
#19
Hedrick Rd
Scott Depot, WV 25560
|
1,824 sq. feet
|
2 baths 3 beds |
show details | |

|
#20
Doss Hill Rd
Barboursville, WV 25504
|
2,046 sq. feet
|
1 baths 2 beds |
show details |
| Photo | Address | Area | Beds / Baths | Price | Details |
|---|---|---|---|---|---|

|
#21
Norway Ave
Huntington, WV 25705
|
1,588 sq. feet
|
2 baths 3 beds |
show details | |

|
#22
Main St
Huntington, WV 25702
|
1,527 sq. feet
|
2 baths 2 beds |
show details | |

|
#23
Turner Rd
Huntington, WV 25705
|
960 sq. feet
|
1 baths 3 beds |
show details | |

|
#24
Nickel Plate Dr
Huntington, WV 25705
|
- sq. feet
|
2 baths 3 beds |
show details | |

|
#25
Shawnee Cir
Huntington, WV 25705
|
1,024 sq. feet
|
1 baths 2 beds |
show details | |

|
#26
Sumner Ave
Huntington, WV 25705
|
2,073 sq. feet
|
2 baths 4 beds |
show details | |

|
#27
Windsong Acres Rd
Winfield, WV 25213
|
2,522 sq. feet
|
3 baths 3 beds |
show details | |

|
#28
W Pea Ridge Rd
Huntington, WV 25705
|
1,688 sq. feet
|
2 baths 3 beds |
show details | |

|
#29
Marne Dr
Huntington, WV 25705
|
1,655 sq. feet
|
1 baths 3 beds |
show details | |

|
#30
Euclid Pl
Huntington, WV 25701
|
2,323 sq. feet
|
3 baths 3 beds |
show details |
| Photo | Address | Area | Beds / Baths | Price | Details |
|---|---|---|---|---|---|

|
#31
11th St
Nitro, WV 25143
|
1,056 sq. feet
|
1 baths 3 beds |
show details | |

|
#32
12th St
Nitro, WV 25143
|
- sq. feet
|
1 baths 3 beds |
show details | |

|
#33
Artisan Ave
Huntington, WV 25703
|
1,288 sq. feet
|
1 baths 3 beds |
show details | |

|
#34
Raccoon Creek Rd
Branchland, WV 25506
|
1,404 sq. feet
|
2 baths 3 beds |
show details | |

|
#35
Rankin St
Branchland, WV 25506
|
1 sq. feet
|
2 baths 4 beds |
show details | |

|
#36
Geronimo Dr
Saint Albans, WV 25177
|
1,408 sq. feet
|
2 baths 3 beds |
show details | |

|
#37
3rd Ave
Huntington, WV 25703
|
1,896 sq. feet
|
2 baths 4 beds |
show details | |

|
#38
Buffalo Rd
Buffalo, WV 25033
|
3,000 sq. feet
|
2 baths 3 beds |
show details | |

|
#39
Pinehurst Dr
Tornado, WV 25202
|
- sq. feet
|
2 baths 3 beds |
show details | |

|
#40
Township Road 1302
Chesapeake, OH 45619
|
960 sq. feet
|
1 baths 3 beds |
show details |
| Photo | Address | Area | Beds / Baths | Price | Details |
|---|---|---|---|---|---|

|
#41
Forest Rd
Huntington, WV 25705
|
1,496 sq. feet
|
2 baths 3 beds |
show details | |

|
#42
Township Road 1122
Proctorville, OH 45669
|
1,400 sq. feet
|
1 baths 3 beds |
show details | |

|
#43
Dupont Ave
Nitro, WV 25143
|
- sq. feet
|
1 baths 2 beds |
show details | |

|
#44
Altizer Ave
Huntington, WV 25705
|
1,192 sq. feet
|
1 baths 3 beds |
show details | |

|
#45
Davis St
Huntington, WV 25705
|
1,344 sq. feet
|
1 baths 3 beds |
show details | |

|
#46
Linden Cir
Huntington, WV 25705
|
864 sq. feet
|
1 baths 3 beds |
show details | |

|
#47
S Staunton Rd
Huntington, WV 25702
|
1,873 sq. feet
|
1 baths 2 beds |
show details | |

|
#48
Hall Ave
Huntington, WV 25701
|
1,567 sq. feet
|
1 baths 3 beds |
show details | |

|
#49
4th Ave
Huntington, WV 25702
|
1,048 sq. feet
|
2 baths 3 beds |
show details | |

|
Check over 1 million property listings on Foreclosure.com!
|
browse all offers | |||


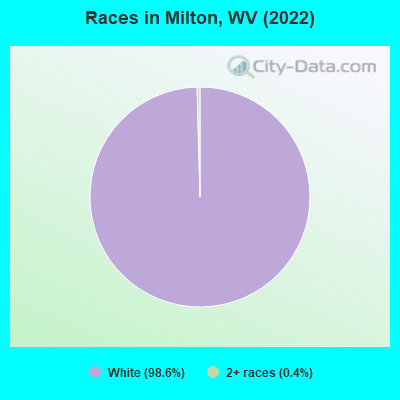
- 2,69898.6%White alone
- 110.4%Two or more races
Races in Milton detailed stats: ancestries, foreign born residents, place of birth
According to our research of West Virginia and other state lists, there were 26 registered sex offenders living in Milton, West Virginia as of March 09, 2025.
The ratio of all residents to sex offenders in Milton is 98 to 1.
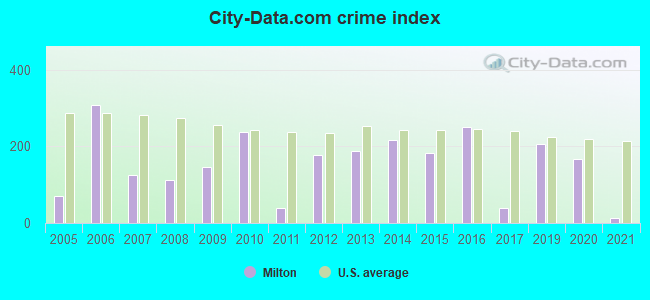
Type |
2009 |
2010 |
2011 |
2012 |
2013 |
2014 |
2015 |
2016 |
2017 |
2019 |
2020 |
2021 |
|---|---|---|---|---|---|---|---|---|---|---|---|---|
| Murders (per 100,000) | 0 (0.0) | 0 (0.0) | 0 (0.0) | 0 (0.0) | 0 (0.0) | 0 (0.0) | 0 (0.0) | 0 (0.0) | 0 (0.0) | 0 (0.0) | 0 (0.0) | 0 (0.0) |
| Rapes (per 100,000) | 1 (41.3) | 0 (0.0) | 0 (0.0) | 0 (0.0) | 1 (39.6) | 1 (39.3) | 1 (37.2) | 1 (37.3) | 0 (0.0) | 0 (0.0) | 2 (78.5) | 0 (0.0) |
| Robberies (per 100,000) | 0 (0.0) | 1 (41.3) | 0 (0.0) | 1 (41.3) | 1 (39.6) | 0 (0.0) | 0 (0.0) | 0 (0.0) | 0 (0.0) | 3 (115.9) | 0 (0.0) | 0 (0.0) |
| Assaults (per 100,000) | 4 (165.3) | 4 (165.1) | 2 (82.4) | 4 (165.2) | 2 (79.2) | 3 (118.0) | 5 (186.0) | 5 (186.4) | 0 (0.0) | 6 (231.8) | 3 (117.8) | 0 (0.0) |
| Burglaries (per 100,000) | 14 (578.5) | 35 (1,444) | 3 (123.7) | 10 (412.9) | 7 (277.2) | 14 (550.7) | 14 (520.8) | 19 (708.2) | 2 (75.5) | 13 (502.3) | 6 (235.6) | 1 (39.5) |
| Thefts (per 100,000) | 24 (991.7) | 49 (2,022) | 9 (371.0) | 57 (2,353) | 60 (2,376) | 66 (2,596) | 47 (1,749) | 80 (2,982) | 17 (642.0) | 54 (2,087) | 39 (1,531) | 5 (197.3) |
| Auto thefts (per 100,000) | 0 (0.0) | 3 (123.8) | 0 (0.0) | 3 (123.9) | 4 (158.4) | 6 (236.0) | 3 (111.6) | 5 (186.4) | 3 (113.3) | 2 (77.3) | 1 (39.3) | 1 (39.5) |
| Arson (per 100,000) | 0 (0.0) | 0 (0.0) | 0 (0.0) | 0 (0.0) | 1 (39.6) | 1 (39.3) | 0 (0.0) | 0 (0.0) | 0 (0.0) | 0 (0.0) | 0 (0.0) | 0 (0.0) |
| City-Data.com crime index | 146.3 | 237.3 | 40.0 | 178.4 | 186.5 | 216.4 | 182.3 | 250.8 | 40.0 | 206.0 | 167.3 | 13.8 |
The City-Data.com crime index weighs serious crimes and violent crimes more heavily. Higher means more crime, U.S. average is 246.1. It adjusts for the number of visitors and daily workers commuting into cities.
Crime rate in Milton detailed stats: murders, rapes, robberies, assaults, burglaries, thefts, arson
Full-time law enforcement employees in 2021, including police officers: 11 (10 officers - 10 male; 0 female).
| Officers per 1,000 residents here: | 3.95 |
| West Virginia average: | 1.95 |
 Recent articles from our blog. Our writers, many of them Ph.D. graduates or candidates, create easy-to-read articles on a wide variety of topics.

 | Milton WV Grand Patrician Resort shady deal? (1 reply) |
| US News rates the Huntington Metro well in annual lists for 2023-24 (4 replies) |
| Does Huntington have a greater connection to Cincinnati or Columbus? (5 replies) |
| Huntington Business News (2278 replies) |
| I-64 Expansion (58 replies) |
| How is Huntington For Nerds and Disabled (93 replies) |
Latest news from Milton, WV collected exclusively by city-data.com from local newspapers, TV, and radio stations
Ancestries: American (61.5%), German (9.2%), English (6.5%), Scotch-Irish (5.3%), Irish (3.3%), British (2.0%).
Current Local Time: EST time zone
Incorporated in 1876
Elevation: 584 feet
Land area: 1.58 square miles.
Population density: 1,756 people per square mile (low).

| Milton town: | 0.6% ($382) |
| West Virginia: | 0.6% ($378) |
Nearest city with pop. 50,000+: Huntington, WV (16.4 miles
, pop. 51,475).
Nearest city with pop. 200,000+: Columbus, OH (116.9 miles
, pop. 711,470).
Nearest city with pop. 1,000,000+: Chicago, IL (376.0 miles
, pop. 2,896,016).
Nearest cities:
Latitude: 38.44 N, Longitude: 82.13 W
Area code: 304

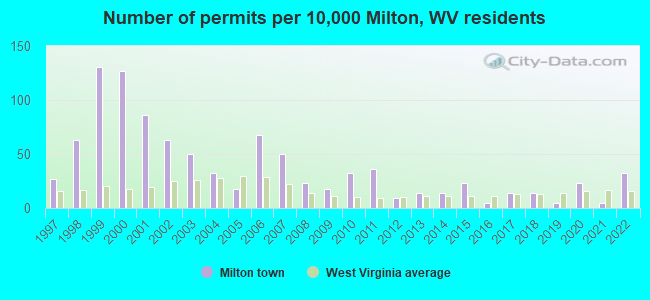
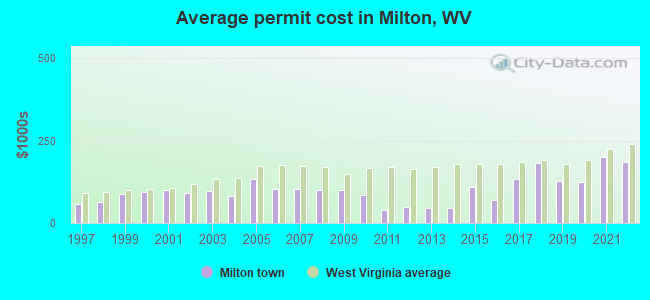
Single-family new house construction building permits:
- 2022: 7 buildings, average cost: $185,300
- 2021: 1 building, cost: $200,000
- 2020: 5 buildings, average cost: $125,200
- 2019: 1 building, cost: $129,000
- 2018: 3 buildings, average cost: $182,600
- 2017: 3 buildings, average cost: $133,300
- 2016: 1 building, cost: $70,000
- 2015: 5 buildings, average cost: $108,100
- 2014: 3 buildings, average cost: $45,000
- 2013: 3 buildings, average cost: $46,900
- 2012: 2 buildings, average cost: $47,500
- 2011: 8 buildings, average cost: $39,300
- 2010: 7 buildings, average cost: $86,200
- 2009: 4 buildings, average cost: $100,000
- 2008: 5 buildings, average cost: $100,000
- 2007: 11 buildings, average cost: $103,100
- 2006: 15 buildings, average cost: $103,100
- 2005: 4 buildings, average cost: $135,000
- 2004: 7 buildings, average cost: $80,500
- 2003: 11 buildings, average cost: $96,900
- 2002: 14 buildings, average cost: $90,000
- 2001: 19 buildings, average cost: $99,300
- 2000: 28 buildings, average cost: $94,600
- 1999: 29 buildings, average cost: $88,600
- 1998: 14 buildings, average cost: $64,800
- 1997: 6 buildings, average cost: $57,500
| Here: | 3.7% |
| West Virginia: | 4.0% |
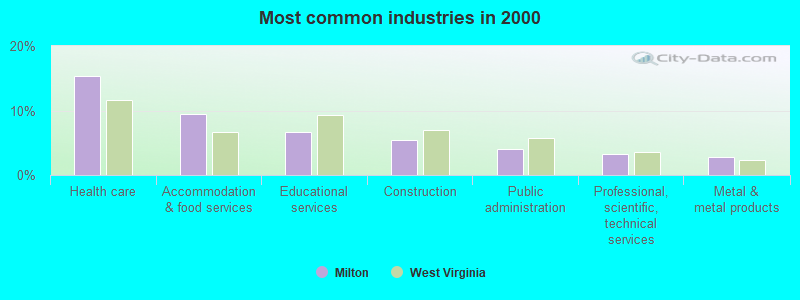
- Health care (15.4%)
- Accommodation & food services (9.5%)
- Educational services (6.6%)
- Construction (5.4%)
- Public administration (4.0%)
- Professional, scientific, technical services (3.3%)
- Metal & metal products (2.8%)
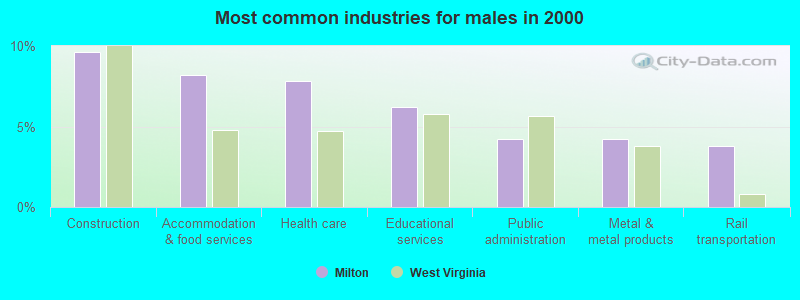
- Construction (9.6%)
- Accommodation & food services (8.2%)
- Health care (7.8%)
- Educational services (6.2%)
- Public administration (4.2%)
- Metal & metal products (4.2%)
- Rail transportation (3.8%)
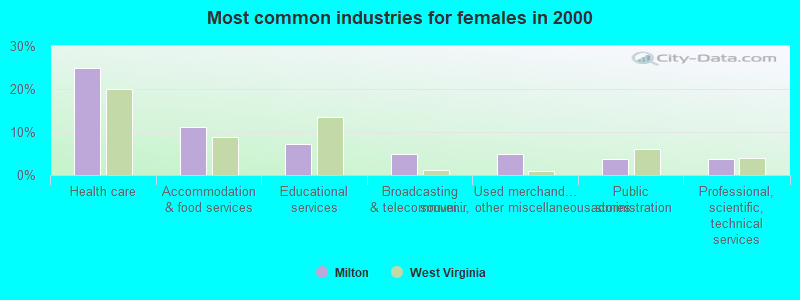
- Health care (25.0%)
- Accommodation & food services (11.2%)
- Educational services (7.1%)
- Broadcasting & telecommunications (4.8%)
- Used merchandise, gift, novelty, souvenir, other miscellaneous stores (4.8%)
- Public administration (3.8%)
- Professional, scientific, technical services (3.8%)
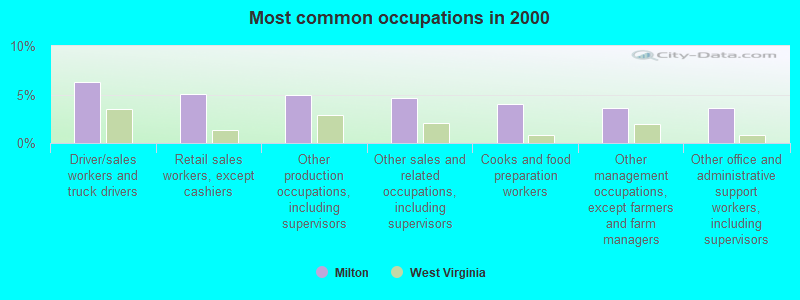
- Driver/sales workers and truck drivers (6.3%)
- Retail sales workers, except cashiers (5.0%)
- Other production occupations, including supervisors (4.9%)
- Other sales and related occupations, including supervisors (4.6%)
- Cooks and food preparation workers (4.0%)
- Other management occupations, except farmers and farm managers (3.6%)
- Other office and administrative support workers, including supervisors (3.6%)
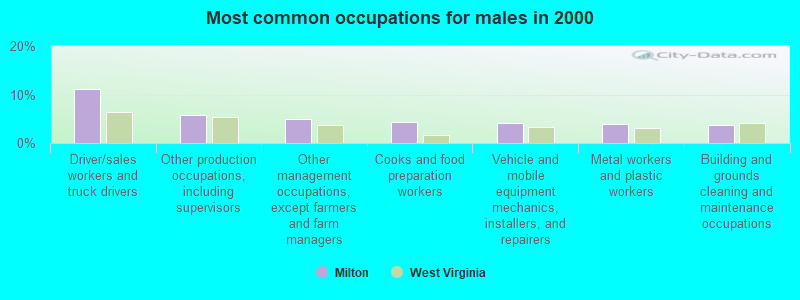
- Driver/sales workers and truck drivers (11.2%)
- Other production occupations, including supervisors (5.8%)
- Other management occupations, except farmers and farm managers (5.0%)
- Cooks and food preparation workers (4.4%)
- Vehicle and mobile equipment mechanics, installers, and repairers (4.2%)
- Metal workers and plastic workers (4.0%)
- Building and grounds cleaning and maintenance occupations (3.8%)
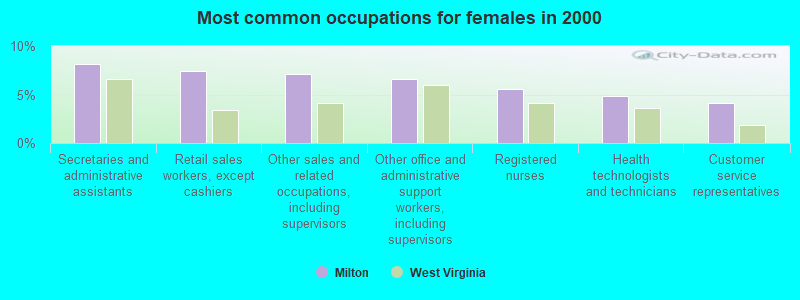
- Secretaries and administrative assistants (8.2%)
- Retail sales workers, except cashiers (7.4%)
- Other sales and related occupations, including supervisors (7.1%)
- Other office and administrative support workers, including supervisors (6.6%)
- Registered nurses (5.6%)
- Health technologists and technicians (4.8%)
- Customer service representatives (4.1%)
Average climate in Milton, West Virginia
Based on data reported by over 4,000 weather stations


|
|


(lower is better)
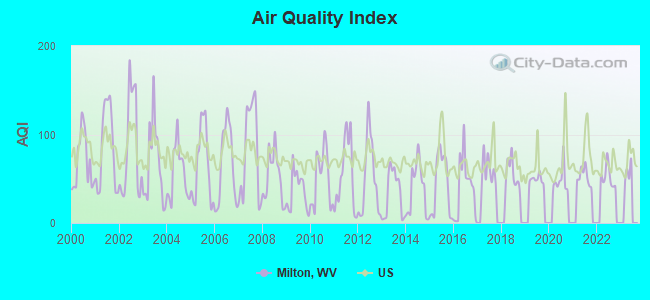
Air Quality Index (AQI) level in 2022 was 52.4. This is better than average.
| City: | 52.4 |
| U.S.: | 72.6 |
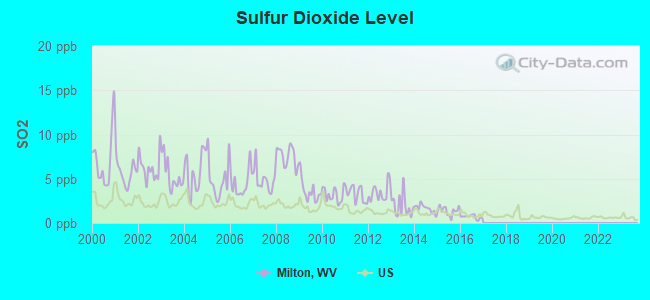
Sulfur Dioxide (SO2) [ppb] level in 2016 was 0.693. This is significantly better than average. Closest monitor was 10.5 miles away from the city center.
| City: | 0.693 |
| U.S.: | 1.515 |
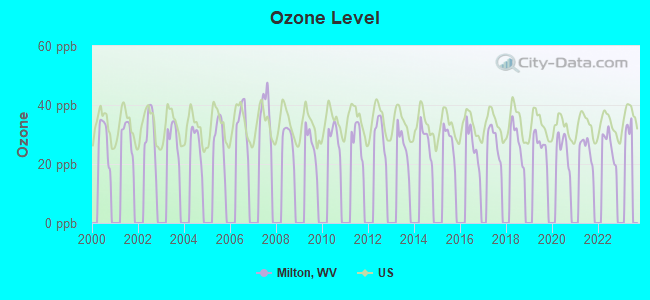
Ozone [ppb] level in 2022 was 26.5. This is better than average. Closest monitor was 15.9 miles away from the city center.
| City: | 26.5 |
| U.S.: | 33.3 |
Tornado activity:
Milton-area historical tornado activity is near West Virginia state average. It is 67% smaller than the overall U.S. average.
On 4/23/1968, a category F5 (max. wind speeds 261-318 mph) tornado 26.8 miles away from the Milton town center killed 7 people and injured 93 people and caused between $500,000 and $5,000,000 in damages.
On 4/8/1965, a category F3 (max. wind speeds 158-206 mph) tornado 22.2 miles away from the town center injured 3 people and caused between $50,000 and $500,000 in damages.
Earthquake activity:
Milton-area historical earthquake activity is significantly above West Virginia state average. It is 2% greater than the overall U.S. average.On 7/27/1980 at 18:52:21, a magnitude 5.2 (5.1 MB, 4.7 MS, 5.0 UK, 5.2 UK, Class: Moderate, Intensity: VI - VII) earthquake occurred 99.5 miles away from Milton center
On 8/23/2011 at 17:51:04, a magnitude 5.8 (5.8 MW, Depth: 3.7 mi) earthquake occurred 231.1 miles away from the city center
On 8/9/2020 at 12:07:37, a magnitude 5.1 (5.1 MW, Depth: 4.7 mi) earthquake occurred 147.1 miles away from the city center
On 9/7/1988 at 02:28:09, a magnitude 4.6 (4.5 MB, 4.6 LG, Class: Light, Intensity: IV - V) earthquake occurred 96.9 miles away from the city center
On 9/25/1998 at 19:52:52, a magnitude 5.2 (4.8 MB, 4.3 MS, 5.2 LG, 4.5 MW, Depth: 3.1 mi) earthquake occurred 230.5 miles away from Milton center
On 1/31/1986 at 16:46:43, a magnitude 5.0 (5.0 MB) earthquake occurred 225.0 miles away from Milton center
Magnitude types: regional Lg-wave magnitude (LG), body-wave magnitude (MB), surface-wave magnitude (MS), moment magnitude (MW)
Natural disasters:
The number of natural disasters in Cabell County (27) is a lot greater than the US average (15).Major Disasters (Presidential) Declared: 20
Emergencies Declared: 5
Causes of natural disasters: Floods: 16, Storms: 15, Landslides: 9, Mudslides: 5, Winter Storms: 4, Hurricanes: 2, Blizzard: 1, Fire: 1, Snowfall: 1, Tornado: 1, Wind: 1, Other: 2 (Note: some incidents may be assigned to more than one category).

Hospitals and medical centers near Milton:
- FMC - HURRICANE (Dialysis Facility, about 10 miles away; HURRICANE, WV)
- PUTNAM CARE AND REHABILITATION CENTER (Nursing Home, about 10 miles away; HURRICANE, WV)
- TEAYS VALLEY CENTER (Nursing Home, about 10 miles away; HURRICANE, WV)
- LINCOLN NURSING AND REHABILITATION CENTER, LLC (Nursing Home, about 11 miles away; HAMLIN, WV)
- COVENANT HOME HEALTH CARE SERVICES (Home Health Center, about 11 miles away; SCOTT DEPOT, WV)
- HEALTHSOUTH REHABILITATION HOSPITAL OF HUNTINGTON (Hospital, about 12 miles away; HUNTINGTON, WV)
- GUYANDOTTE GROUP HOME (Hospital, about 14 miles away; HUNTINGTON, WV)
Airports located in Milton:
- Ona Airpark Airport (12V) (Runways: 1, Itinerant Ops: 700, Local Ops: 4,000)
Colleges/universities with over 2000 students nearest to Milton:
- Marshall University (about 17 miles; Huntington, WV; Full-time enrollment: 11,450)
- West Virginia State University (about 21 miles; Institute, WV; FT enrollment: 2,133)
- Ashland Community and Technical College (about 29 miles; Ashland, KY; FT enrollment: 2,482)
- Shawnee State University (about 51 miles; Portsmouth, OH; FT enrollment: 4,160)
- Ohio University-Main Campus (about 62 miles; Athens, OH; FT enrollment: 26,181)
- Big Sandy Community and Technical College (about 63 miles; Prestonsburg, KY; FT enrollment: 2,660)
- West Virginia University at Parkersburg (about 64 miles; Parkersburg, WV; FT enrollment: 2,619)
Public elementary/middle schools in Milton:
- MILTON MIDDLE SCHOOL (Students: 651, Location: 1 PANTHER TRAIL, Grades: 6-8)
- MILTON ELEMENTARY SCHOOL (Students: 621, Location: 1201 PIKE ST., Grades: PK-5)
Points of interest:
Notable locations in Milton: Perry Morris Square (A), Milton Branch Cabell County Public Library (B), Milton Volunteer Fire Department Station 1 (C). Display/hide their locations on the map
Churches in Milton include: Milton Baptist Church (A), First United Methodist Church (B). Display/hide their locations on the map
Cemetery: Milton Cemetery (1). Display/hide its location on the map
Tourist attractions: Sportsman's Inn (Caverns; 1540 East USRoute 60), Appalachian TrailRunners (Arcades & Amusements; Route 1 Box 78).
Birthplace of: Phillip Swann - Composer.
Drinking water stations with addresses in Milton and their reported violations in the past:
MILTON WATER (Address: 1139 SMITH STREET , Population served: 4,883, Surface water):Past health violations:Past monitoring violations:
- MCL, Average - Between APR-2005 and JUN-2005, Contaminant: Total Haloacetic Acids (HAA5). Follow-up actions: St Compliance achieved (JUL-06-2005), St Public Notif requested (NOV-12-2005), St Formal NOV issued (NOV-12-2005), St Public Notif received (DEC-08-2005)
- Monitoring and Reporting (DBP) - Between JAN-2005 and MAR-2005, Contaminant: Total Haloacetic Acids (HAA5). Follow-up actions: St Public Notif requested (JUN-14-2005), St Formal NOV issued (JUN-14-2005), St Compliance achieved (JUL-06-2005), St Public Notif received (JUL-07-2005)
- Monitoring and Reporting (DBP) - Between JAN-2005 and MAR-2005, Contaminant: TTHM. Follow-up actions: St Public Notif requested (JUN-14-2005), St Formal NOV issued (JUN-14-2005), St Compliance achieved (JUL-06-2005), St Public Notif received (JUL-07-2005)
- 2 routine major monitoring violations
- 16 regular monitoring violations
| This town: | 2.1 people |
| West Virginia: | 2.4 people |
| This town: | 58.8% |
| Whole state: | 65.8% |
| This town: | 6.5% |
| Whole state: | 6.6% |
Likely homosexual households (counted as self-reported same-sex unmarried-partner households)
- Lesbian couples: 0.6% of all households
- Gay men: 0.2% of all households
Banks with branches in Milton (2011 data):
- The Ohio Valley Bank Company: Milton Branch at 280 East Main Street, branch established on 1980/05/06. Info updated 2012/01/05: Bank assets: $793.4 mil, Deposits: $689.5 mil, headquarters in Gallipolis, OH, positive income, Commercial Lending Specialization, 15 total offices, Holding Company: Ohio Valley Banc Corp.
- JPMorgan Chase Bank, National Association: Milton Branch at 500 Main St. East, branch established on 1988/05/09. Info updated 2011/11/10: Bank assets: $1,811,678.0 mil, Deposits: $1,190,738.0 mil, headquarters in Columbus, OH, positive income, International Specialization, 5577 total offices, Holding Company: Jpmorgan Chase & Co.
- City National Bank of West Virginia: Milton Branch at 1041 Church Street, branch established on 1904/09/08. Info updated 2008/01/10: Bank assets: $2,753.2 mil, Deposits: $2,223.1 mil, headquarters in Charleston, WV, positive income, Commercial Lending Specialization, 68 total offices, Holding Company: City Holding Company
For population 15 years and over in Milton:
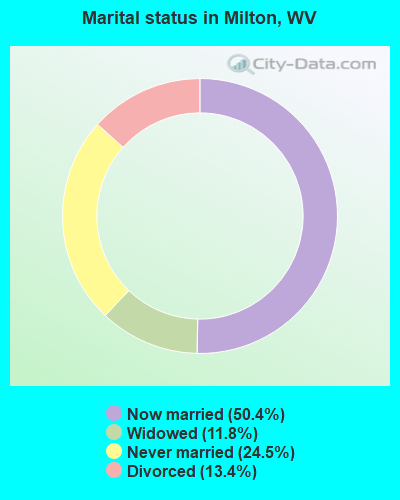
- Never married: 24.5%
- Now married: 50.4%
- Separated: 0.0%
- Widowed: 11.8%
- Divorced: 13.4%
For population 25 years and over in Milton:
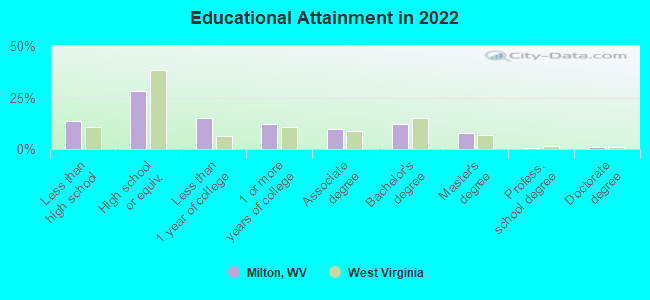
- High school or higher: 86.3%
- Bachelor's degree or higher: 19.2%
- Graduate or professional degree: 8.9%
- Unemployed: 5.1%
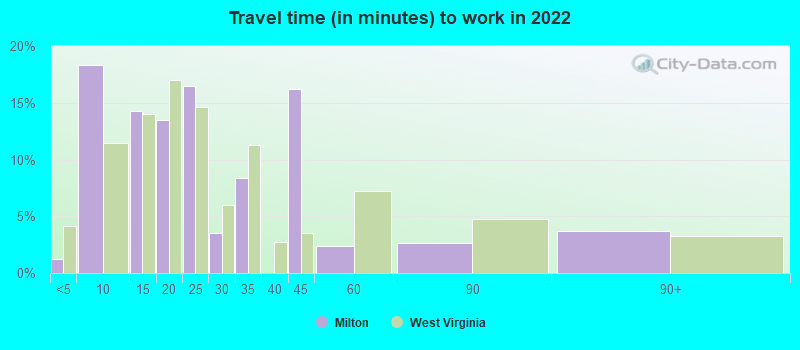
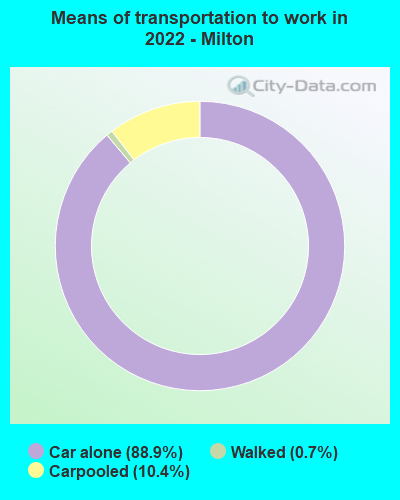
- Mean travel time to work (commute): 20.5 minutes
| Here: | 11.4 |
| West Virginia average: | 11.1 |
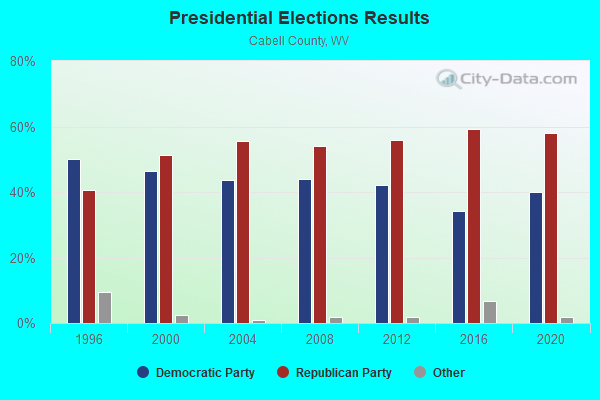
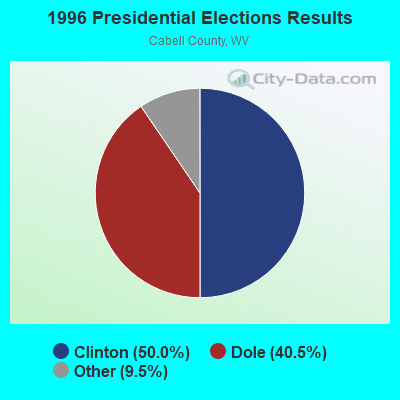
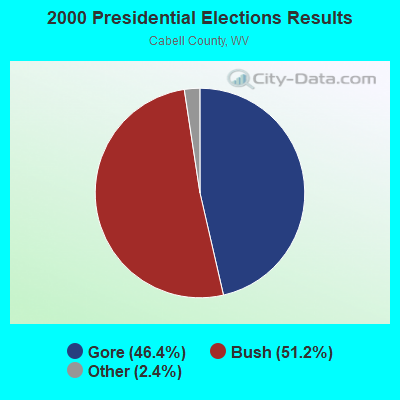
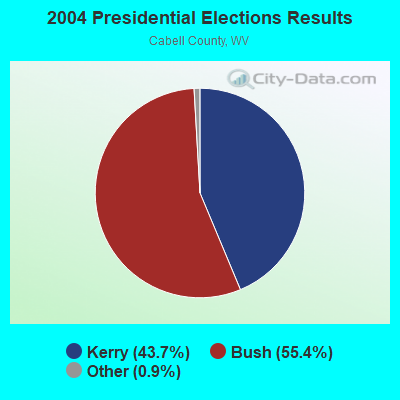
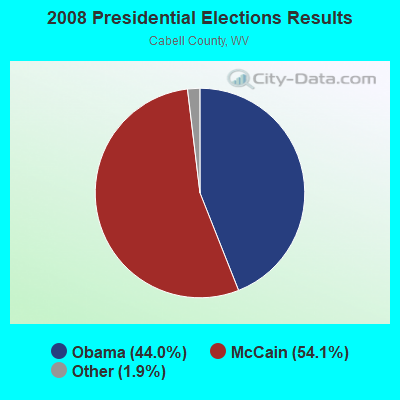
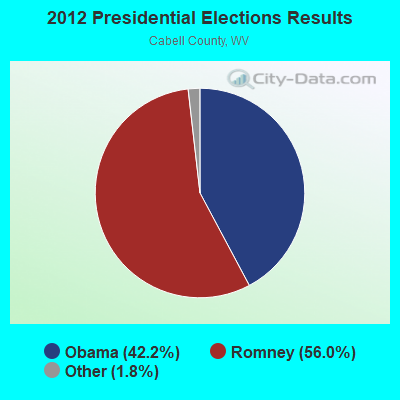
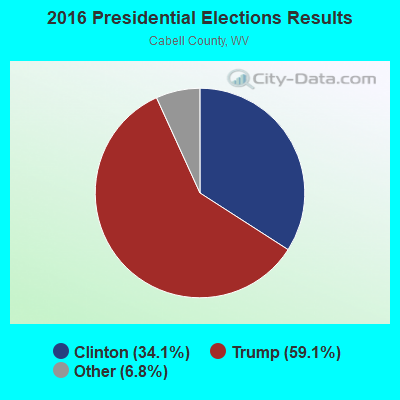
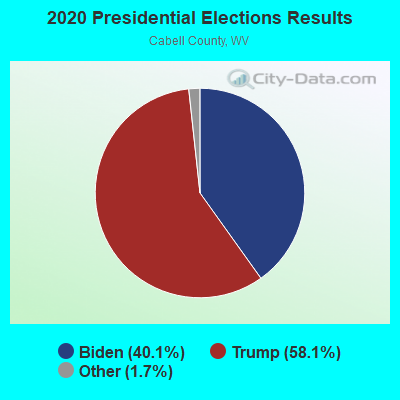
Graphs represent county-level data. Detailed 2008 Election Results
Religion statistics for Milton, WV (based on Cabell County data)
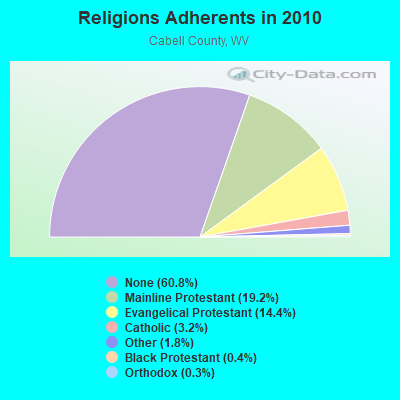
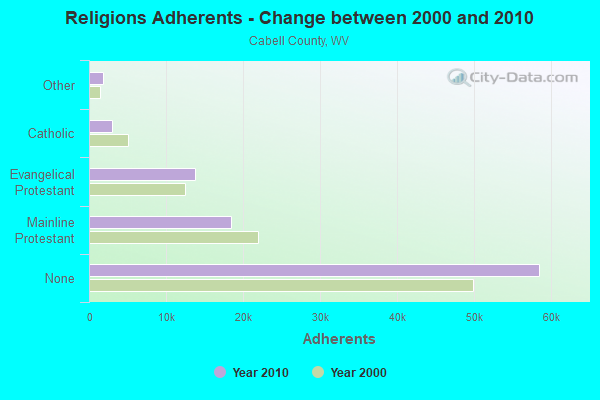
| Religion | Adherents | Congregations |
|---|---|---|
| Mainline Protestant | 18,454 | 60 |
| Evangelical Protestant | 13,824 | 74 |
| Catholic | 3,052 | 5 |
| Other | 1,771 | 11 |
| Black Protestant | 415 | 4 |
| Orthodox | 255 | 2 |
| None | 58,548 | - |
Food Environment Statistics:
| This county: | 1.91 / 10,000 pop. |
| State: | 2.41 / 10,000 pop. |
| Cabell County: | 0.95 / 10,000 pop. |
| West Virginia: | 1.09 / 10,000 pop. |
| Cabell County: | 4.24 / 10,000 pop. |
| State: | 5.38 / 10,000 pop. |
| Here: | 8.05 / 10,000 pop. |
| West Virginia: | 6.22 / 10,000 pop. |
| Here: | 13.9% |
| West Virginia: | 12.2% |
| This county: | 31.0% |
| West Virginia: | 31.1% |
| Cabell County: | 16.7% |
| West Virginia: | 13.1% |
Health and Nutrition:
| This city: | 48.6% |
| State: | 51.8% |
| Here: | 47.8% |
| State: | 49.7% |
| This city: | 28.7 |
| West Virginia: | 28.6 |
| Milton: | 17.3% |
| West Virginia: | 20.4% |
| This city: | 17.6% |
| West Virginia: | 9.7% |
| Here: | 6.7 |
| West Virginia: | 6.9 |
| Milton: | 38.5% |
| State: | 34.8% |
| Here: | 54.3% |
| West Virginia: | 58.4% |
| Milton: | 80.8% |
| West Virginia: | 78.6% |
More about Health and Nutrition of Milton, WV Residents
| Local government employment and payroll (March 2022) | |||||
| Function | Full-time employees | Monthly full-time payroll | Average yearly full-time wage | Part-time employees | Monthly part-time payroll |
|---|---|---|---|---|---|
| Water Supply | 5 | $22,535 | $54,084 | 0 | $0 |
| Sewerage | 3 | $14,660 | $58,640 | 0 | $0 |
| Police Protection - Officers | 2 | $12,304 | $73,824 | 3 | $14,091 |
| Streets and Highways | 2 | $6,876 | $41,256 | 1 | $1,867 |
| Other Government Administration | 1 | $6,048 | $72,576 | 13 | $8,624 |
| Financial Administration | 1 | $4,276 | $51,312 | 0 | $0 |
| Judicial and Legal | 0 | $0 | 1 | $4,480 | |
| Totals for Government | 14 | $66,699 | $57,171 | 18 | $29,062 |
Milton government finances - Expenditure in 2021 (per resident):
- Current Operations - Financial Administration: $983,000 ($355.26)
Sewerage: $858,000 ($310.08)
Water Utilities: $799,000 ($288.76)
Police Protection: $555,000 ($200.58)
Regular Highways: $291,000 ($105.17)
Parks and Recreation: $73,000 ($26.38)
Health - Other: $23,000 ($8.31)
Public Welfare - Other: $11,000 ($3.98)
Miscellaneous Commercial Activities - Other: $1,000 ($0.36)
- General - Interest on Debt: $32,000 ($11.56)
- Other Capital Outlay - General - Other: $66,000 ($23.85)
Water Utilities: $6,000 ($2.17)
Sewerage: $2,000 ($0.72)
- Total Salaries and Wages: $874,000 ($315.87)
- Water Utilities - Interest on Debt: $369,000 ($133.36)
Milton government finances - Revenue in 2021 (per resident):
- Charges - Sewerage: $1,441,000 ($520.78)
Other: $201,000 ($72.64)
Miscellaneous Commercial Activities: $9,000 ($3.25)
- Local Intergovernmental - Other: $3,000 ($1.08)
- Miscellaneous - Fines and Forfeits: $478,000 ($172.75)
Donations From Private Sources: $93,000 ($33.61)
General Revenue - Other: $41,000 ($14.82)
Interest Earnings: $35,000 ($12.65)
- Revenue - Water Utilities: $1,011,000 ($365.38)
- State Intergovernmental - Other: $176,000 ($63.61)
General Local Government Support: $8,000 ($2.89)
- Tax - Occupation and Business License - Other: $598,000 ($216.12)
Property: $431,000 ($155.76)
Other License: $237,000 ($85.65)
Other: $46,000 ($16.62)
Alcoholic Beverage Sales: $4,000 ($1.45)
Milton government finances - Debt in 2021 (per resident):
- Long Term Debt - Beginning Outstanding - Unspecified Public Purpose: $7,264,000 ($2625.23)
Outstanding Unspecified Public Purpose: $6,912,000 ($2498.01)
Retired Unspecified Public Purpose: $352,000 ($127.21)
Milton government finances - Cash and Securities in 2021 (per resident):
- Other Funds - Cash and Securities: $3,455,000 ($1248.64)
| Businesses in Milton, WV | ||||
| Name | Count | Name | Count | |
|---|---|---|---|---|
| Advance Auto Parts | 1 | Nike | 1 | |
| Curves | 1 | Pizza Hut | 1 | |
| FedEx | 1 | Rite Aid | 1 | |
| H&R Block | 1 | Subway | 1 | |
| MasterBrand Cabinets | 2 | UPS | 1 | |
| McDonald's | 1 | Wendy's | 1 | |
Strongest AM radio stations in Milton:
- WZZW (1600 AM; 5 kW; MILTON, WV; Owner: CAPSTAR TX LIMITED PARTNERSHIP)
- WOKU (1080 AM; daytime; 1 kW; HURRICANE, WV; Owner: BIG RIVER RADIO, INC.)
- WCHS (580 AM; 5 kW; CHARLESTON, WV; Owner: WEST VIRGINIA RADIO CORPORATION OF CHARLESTON)
- WVHU (800 AM; 5 kW; HUNTINGTON, WV; Owner: CAPSTAR TX LIMITED PARTNERSHIP)
- WBGS (1030 AM; daytime; 10 kW; POINT PLEASANT, WV; Owner: BIG RIVER RADIO, INC.)
- WRVC (930 AM; 5 kW; HUNTINGTON, WV; Owner: FIFTH AVENUE BROADCASTING COMPANY, INC.)
- WCAW (680 AM; 10 kW; CHARLESTON, WV; Owner: WEST VIRGINIA RADIO CORPORATION OF CHARLESTON)
- WVTS (950 AM; 5 kW; CHARLESTON, WV; Owner: BRISTOL BROADCASTING COMPANY, INC.)
- WTVN (610 AM; 50 kW; COLUMBUS, OH; Owner: CITICASTERS LICENSES, L.P.)
- WHRD (1470 AM; 5 kW; HUNTINGTON, WV; Owner: CONCORD MEDIA GROUP, INC.)
- WSCW (1410 AM; daytime; 5 kW; SOUTH CHARLESTON, WV; Owner: L.M. COMMUNICATIONS OF KENTUCKY, LLC)
- WTCR (1420 AM; 5 kW; KENOVA, WV; Owner: CAPSTAR TX LIMITED PARTNERSHIP)
- WLW (700 AM; 50 kW; CINCINNATI, OH; Owner: JACOR BROADCASTING CORPORATION)
Strongest FM radio stations in Milton:
- WVWV (89.9 FM; HUNTINGTON, WV; Owner: WEST VIRGINIA EDUCATIONAL BROADCASTING AUTHORITY)
- WAMX (106.3 FM; MILTON, WV; Owner: CAPSTAR TX LIMITED PARTNERSHIP)
- WKLC-FM (105.1 FM; ST. ALBANS, WV; Owner: WKLC, INC.)
- WEMM (107.9 FM; HUNTINGTON, WV; Owner: MORTENSON BROADCASTING CO. OF WEST VIRGINIA, LLC)
- WTCR-FM (103.3 FM; HUNTINGTON, WV; Owner: CAPSTAR TX LIMITED PARTNERSHIP)
- WKEE-FM (100.5 FM; HUNTINGTON, WV; Owner: CAPSTAR TX LIMITED PARTNERSHIP)
- WZJO (94.5 FM; DUNBAR, WV; Owner: BRISTOL BROADCASTING COMPANY, INC)
- WDGG (93.7 FM; ASHLAND, KY; Owner: FIFTH AVENUE B/CASTING COMPANY, INC.)
- WBKS (107.1 FM; IRONTON, OH; Owner: CAPSTAR TX LIMITED PARTNERSHIP)
- WQBE-FM (97.5 FM; CHARLESTON, WV; Owner: BRISTOL BROADCASTING COMPANY)
- WPAY-FM (104.1 FM; PORTSMOUTH, OH; Owner: RADIO STATIONS WPAY/WPFB, INC.)
- WMEJ (91.9 FM; PROCTORVILLE, OH; Owner: MARANATHA BROADCASTING INC.)
- WZAC-FM (92.5 FM; DANVILLE, WV; Owner: PRICE BROADCASTING COMPANY)
- WRVC-FM (92.7 FM; CATLETTSBURG, KY; Owner: FIFTH AVENUE BROADCASTING CO., INC)
- WRVZ (98.7 FM; POCATALICO, WV; Owner: WEST VIRGINIA RADIO CORPORATION OF CHARLESTON)
- WRYV (101.5 FM; GALLIPOLIS, OH; Owner: LEGEND COMMUNICATIONS OF OHIO, LLC)
- WKAZ (107.3 FM; MIAMI, WV; Owner: WEST VIRGINIA RADIO CORPORATION OF CHARLESTON)
- WBVB (97.1 FM; COAL GROVE, OH; Owner: CAPSTAR TX LIMITED PARTNERSHIP)
- WKWS (96.1 FM; CHARLESTON, WV; Owner: WEST VIRGINIA RADIO CORPORATION OF CHARLESTON)
- WXAF (90.9 FM; CHARLESTON, WV; Owner: MARANATHA BROADCASTING, INC.)
TV broadcast stations around Milton:
- WPBY-TV (Channel 33; HUNTINGTON, WV; Owner: WEST VIRGINIA EDUCATIONAL BROADCASTING AUTHORITY)
- WSAZ-TV (Channel 3; HUNTINGTON, WV; Owner: EMMIS TELEVISION LICENSE CORPORATION)
- WOWK-TV (Channel 13; HUNTINGTON, WV; Owner: WEST VIRGINIA MEDIA HOLDINGS, LLC)
- WVAH-TV (Channel 11; CHARLESTON, WV; Owner: WVAH LICENSEE, LLC)
- WCHS-TV (Channel 8; CHARLESTON, WV; Owner: WCHS LICENSEE, LLC)
- W36CR (Channel 36; HUNTINGTON, WV; Owner: NATIONAL MINORITY T.V., INC.)
- WLPX-TV (Channel 29; CHARLESTON, WV; Owner: PAXSON CHARLESTON LICENSE, INC.)
- W14CU (Channel 14; HUNTINGTON, WV; Owner: VENTANA TELEVISION, INC.)
- WTSF (Channel 61; ASHLAND, KY; Owner: TRI STATE FAMILY BROADCASTING, INC.)
- WKAS (Channel 25; ASHLAND, KY; Owner: KENTUCKY AUTHORITY FOR EDUCATIONAL TV)
- W55AT (Channel 55; HUNTINGTON, WV; Owner: CHANNEL AMERICA LPTV LIC. SUBSIDIARY)
- National Bridge Inventory (NBI) Statistics
- 50Number of bridges
- 597ft / 182mTotal length
- $4,759,000Total costs
- 466,796Total average daily traffic
- 69,194Total average daily truck traffic
- New bridges - historical statistics
- 31900-1909
- 21920-1929
- 21930-1939
- 101950-1959
- 121960-1969
- 11970-1979
- 41980-1989
- 121990-1999
- 42000-2009
FCC Registered Antenna Towers:
105 (See the full list of FCC Registered Antenna Towers in Milton)FCC Registered Commercial Land Mobile Towers:
2- Lat: 38.505917 Lon: -82.209028, Call Sign: KC62788,
Assigned Frequencies: 161.640 MHz, 161.760 MHz, 170.150 MHz, Grant Date: 03/09/1987, Expiration Date: 10/01/1995, Cancellation Date: 09/24/2000, Registrant: Peters Broadcasting, Inc., Box 266, Milton, WV 25541
- Lat: 38.429528 Lon: -82.105694, Call Sign: KIT695,
Assigned Frequencies: 26.1100 MHz, Grant Date: 07/25/2000, Expiration Date: 10/01/2011, Cancellation Date: 10/22/2003, Registrant: Nasty 1570 Sports LLC, 2545 Wilkens Avenue, Baltimore, MD 21223
FCC Registered Broadcast Land Mobile Towers:
5- Int Us Rt 60 & Hillsview Dr (Lat: 38.434250 Lon: -82.121806), Call Sign: KQF622, Licensee ID: L00101437,
Assigned Frequencies: 37.5800 MHz, 37.7000 MHz, Grant Date: 06/27/1996, Expiration Date: 08/11/2001, Cancellation Date: 07/27/2001, Registrant: Appalachian Power Company, Roanoke, VA 24022, Phone: (703) 985-2833
- EAST TANK, East Tank .13km W Of Jct. Cr 16 And Sugar Run Rd (Lat: 38.440306 Lon: -82.098528), Type: Tank, Structure height: 9 m, Call Sign: WPBT922,
Assigned Frequencies: 173.203 MHz, Grant Date: 02/23/2023, Expiration Date: 02/26/2033, Registrant: City Of Milton, 1139 Smith St, Milton, WV 25541, Phone: (304) 743-3422, Fax: (304) 743-1872, Email:
- Wv Sec Rt 9 0.1 Km N Of Us Rt 60 Int (Lat: 38.437306 Lon: -82.140139), Type: Pole, Structure height: 6 m, Call Sign: WPJX675,
Assigned Frequencies: 173.203 MHz, Grant Date: 12/06/2011, Expiration Date: 12/06/2021, Cancellation Date: 02/05/2022, Certifier: Tommy L Harbour, Registrant: Business Radio Licensing, 30251 Golden Lantern Ste E #501, Laguna Niguel, CA 92677-5993, Phone: (949) 348-8510, Fax: (949) 348-8514, Email:
- Lat: 38.443611 Lon: -82.127222, Call Sign: WPYQ665,
Assigned Frequencies: 461.150 MHz, 466.150 MHz, Grant Date: 09/30/2003, Expiration Date: 09/30/2013, Cancellation Date: 01/18/2013, Certifier: Michael J Zarrilli, Registrant: Suddenlink Communications, 12444 Powerscourt Drive, Ste. 140, St. Louis, MO 63131, Phone: (314) 315-9400, Email:
- Lat: 38.433972 Lon: -82.139806, Call Sign: WQDE226,
Assigned Frequencies: 72.1000 MHz, Grant Date: 08/03/2005, Expiration Date: 08/03/2015, Cancellation Date: 10/03/2015, Certifier: Bonnie Mills, Registrant: Primex Wireless, Inc., N3211 County Road H, Lake Geneva, WI 53147, Phone: (262) 248-3000
FCC Registered Microwave Towers:
15 (See the full list of FCC Registered Microwave Towers in this town)FCC Registered Maritime Coast & Aviation Ground Towers:
1 (See the full list of FCC Registered Maritime Coast & Aviation Ground Towers)FCC Registered Amateur Radio Licenses:
55 (See the full list of FCC Registered Amateur Radio Licenses in Milton)FAA Registered Aircraft:
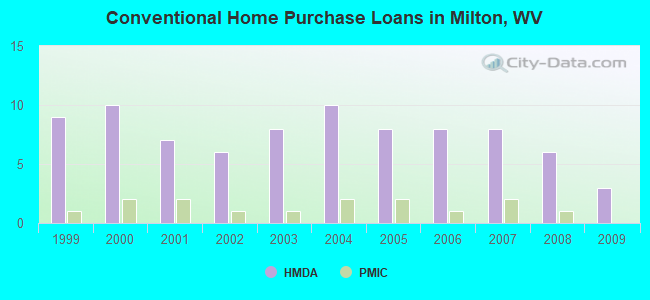
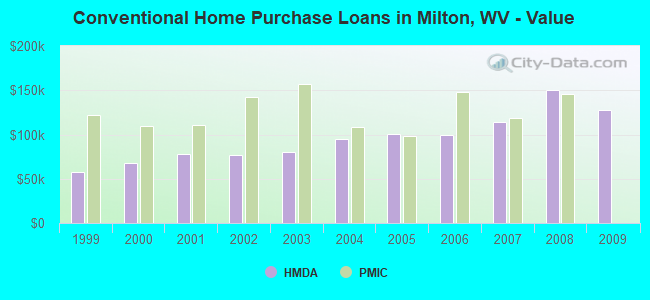
9 (See the full list of FAA Registered Aircraft in Milton)| Home Mortgage Disclosure Act Aggregated Statistics For Year 2009 (Based on 1 partial tract) | ||||||||||||
| A) FHA, FSA/RHS & VA Home Purchase Loans | B) Conventional Home Purchase Loans | C) Refinancings | D) Home Improvement Loans | F) Non-occupant Loans on < 5 Family Dwellings (A B C & D) | G) Loans On Manufactured Home Dwelling (A B C & D) | |||||||
|---|---|---|---|---|---|---|---|---|---|---|---|---|
| Number | Average Value | Number | Average Value | Number | Average Value | Number | Average Value | Number | Average Value | Number | Average Value | |
| LOANS ORIGINATED | 2 | $117,490 | 3 | $127,547 | 10 | $143,057 | 1 | $44,740 | 1 | $53,730 | 1 | $78,330 |
| APPLICATIONS APPROVED, NOT ACCEPTED | 0 | $0 | 0 | $0 | 1 | $77,530 | 0 | $0 | 0 | $0 | 0 | $0 |
| APPLICATIONS DENIED | 0 | $0 | 1 | $111,040 | 2 | $148,810 | 1 | $34,630 | 0 | $0 | 1 | $35,820 |
| APPLICATIONS WITHDRAWN | 0 | $0 | 0 | $0 | 2 | $170,900 | 0 | $0 | 0 | $0 | 0 | $0 |
| FILES CLOSED FOR INCOMPLETENESS | 0 | $0 | 0 | $0 | 1 | $74,270 | 0 | $0 | 0 | $0 | 0 | $0 |
Detailed HMDA statistics for the following Tracts: 0108.00
| Private Mortgage Insurance Companies Aggregated Statistics For Year 2008 (Based on 1 partial tract) | ||
| A) Conventional Home Purchase Loans | ||
|---|---|---|
| Number | Average Value | |
| LOANS ORIGINATED | 1 | $145,430 |
| APPLICATIONS APPROVED, NOT ACCEPTED | 0 | $0 |
| APPLICATIONS DENIED | 0 | $0 |
| APPLICATIONS WITHDRAWN | 0 | $0 |
| FILES CLOSED FOR INCOMPLETENESS | 0 | $0 |
Detailed PMIC statistics for the following Tracts: 0108.00
2003 - 2018 National Fire Incident Reporting System (NFIRS) incidents
- Fire incident types reported to NFIRS in Milton, WV
- 35351.9%Structure Fires
- 17625.9%Outside Fires
- 11617.1%Mobile Property/Vehicle Fires
- 355.1%Other
 According to the data from the years 2003 - 2018 the average number of fire incidents per year is 42. The highest number of fire incidents - 69 took place in 2013, and the least - 12 in 2003. The data has an increasing trend.
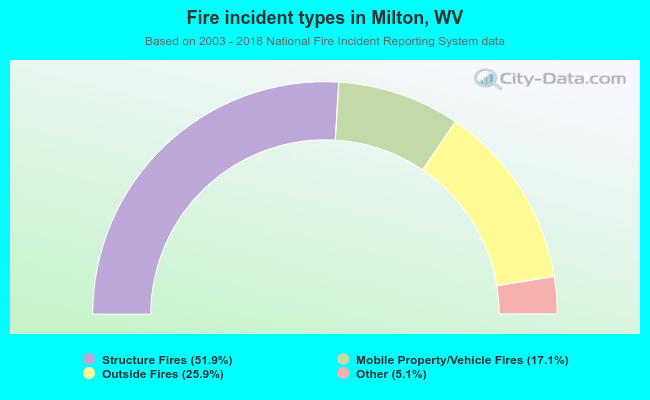 When looking into fire subcategories, the most incidents belonged to: Structure Fires (51.9%), and Outside Fires (25.9%).
| Most common first names in Milton, WV among deceased individuals | ||
| Name | Count | Lived (average) |
|---|---|---|
| James | 73 | 70.2 years |
| William | 71 | 73.3 years |
| Mary | 62 | 78.3 years |
| John | 52 | 75.5 years |
| Charles | 51 | 71.2 years |
| Robert | 30 | 74.4 years |
| Roy | 23 | 71.3 years |
| Thelma | 22 | 79.8 years |
| Anna | 22 | 77.9 years |
| Helen | 22 | 77.4 years |
| Most common last names in Milton, WV among deceased individuals | ||
| Last name | Count | Lived (average) |
|---|---|---|
| Chapman | 80 | 75.7 years |
| Meadows | 50 | 73.8 years |
| Smith | 49 | 76.6 years |
| Johnson | 47 | 77.1 years |
| Clagg | 32 | 72.7 years |
| Holley | 30 | 77.6 years |
| Black | 30 | 72.0 years |
| Perry | 27 | 77.7 years |
| Wallace | 27 | 75.3 years |
| Ball | 27 | 79.8 years |
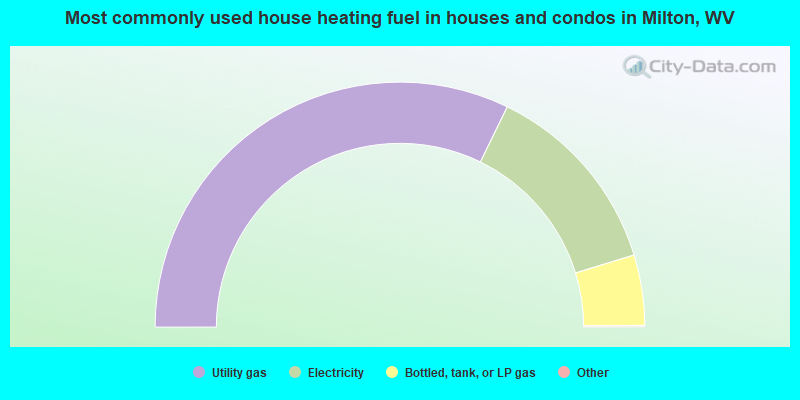
- 64.5%Utility gas
- 26.1%Electricity
- 9.3%Bottled, tank, or LP gas
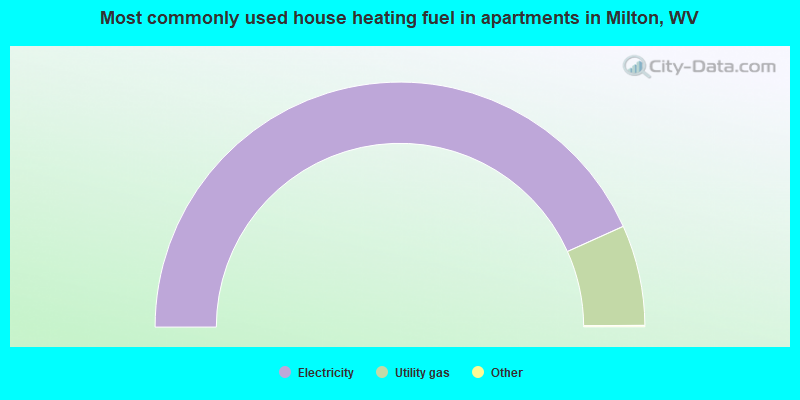
- 86.7%Electricity
- 13.3%Utility gas
Milton compared to West Virginia state average:
- Unemployed percentage significantly below state average.
- Black race population percentage significantly below state average.
- Hispanic race population percentage significantly below state average.
- Foreign-born population percentage significantly below state average.
- Length of stay since moving in significantly above state average.
- House age below state average.

|
|
Total of 15 patent applications in 2008-2025.