Odenton, Maryland Submit your own pictures of this place and show them to the world
OSM Map
General Map
Google Map
MSN Map
OSM Map
General Map
Google Map
MSN Map
OSM Map
General Map
Google Map
MSN Map
OSM Map
General Map
Google Map
MSN Map
Please wait while loading the map...
Population in 2010: 37,132. Population change since 2000: +80.8%Males: 17,442 Females: 19,690
December 2024 cost of living index in Odenton: 132.2 (high, U.S. average is 100) Percentage of residents living in poverty in 2023: 4.0%for White Non-Hispanic residents , 6.3% for Black residents , 1.3% for Hispanic or Latino residents , 1.0% for American Indian residents , 1.0% for other race residents , 0.7% for two or more races residents )
Profiles of local businesses
Business Search - 14 Million verified businesses
Data:
Median household income ($)
Median household income (% change since 2000)
Household income diversity
Ratio of average income to average house value (%)
Ratio of average income to average rent
Median household income ($) - White
Median household income ($) - Black or African American
Median household income ($) - Asian
Median household income ($) - Hispanic or Latino
Median household income ($) - American Indian and Alaska Native
Median household income ($) - Multirace
Median household income ($) - Other Race
Median household income for houses/condos with a mortgage ($)
Median household income for apartments without a mortgage ($)
Races - White alone (%)
Races - White alone (% change since 2000)
Races - Black alone (%)
Races - Black alone (% change since 2000)
Races - American Indian alone (%)
Races - American Indian alone (% change since 2000)
Races - Asian alone (%)
Races - Asian alone (% change since 2000)
Races - Hispanic (%)
Races - Hispanic (% change since 2000)
Races - Native Hawaiian and Other Pacific Islander alone (%)
Races - Native Hawaiian and Other Pacific Islander alone (% change since 2000)
Races - Two or more races (%)
Races - Two or more races (% change since 2000)
Races - Other race alone (%)
Races - Other race alone (% change since 2000)
Racial diversity
Unemployment (%)
Unemployment (% change since 2000)
Unemployment (%) - White
Unemployment (%) - Black or African American
Unemployment (%) - Asian
Unemployment (%) - Hispanic or Latino
Unemployment (%) - American Indian and Alaska Native
Unemployment (%) - Multirace
Unemployment (%) - Other Race
Population density (people per square mile)
Population - Males (%)
Population - Females (%)
Population - Males (%) - White
Population - Males (%) - Black or African American
Population - Males (%) - Asian
Population - Males (%) - Hispanic or Latino
Population - Males (%) - American Indian and Alaska Native
Population - Males (%) - Multirace
Population - Males (%) - Other Race
Population - Females (%) - White
Population - Females (%) - Black or African American
Population - Females (%) - Asian
Population - Females (%) - Hispanic or Latino
Population - Females (%) - American Indian and Alaska Native
Population - Females (%) - Multirace
Population - Females (%) - Other Race
Coronavirus confirmed cases (Apr 30, 2025)
Deaths caused by coronavirus (Apr 30, 2025)
Coronavirus confirmed cases (per 100k population) (Apr 30, 2025)
Deaths caused by coronavirus (per 100k population) (Apr 30, 2025)
Daily increase in number of cases (Apr 30, 2025)
Weekly increase in number of cases (Apr 30, 2025)
Cases doubled (in days) (Apr 30, 2025)
Hospitalized patients (Apr 18, 2022)
Negative test results (Apr 18, 2022)
Total test results (Apr 18, 2022)
COVID Vaccine doses distributed (per 100k population) (Sep 19, 2023)
COVID Vaccine doses administered (per 100k population) (Sep 19, 2023)
COVID Vaccine doses distributed (Sep 19, 2023)
COVID Vaccine doses administered (Sep 19, 2023)
Likely homosexual households (%)
Likely homosexual households (% change since 2000)
Likely homosexual households - Lesbian couples (%)
Likely homosexual households - Lesbian couples (% change since 2000)
Likely homosexual households - Gay men (%)
Likely homosexual households - Gay men (% change since 2000)
Cost of living index
Median gross rent ($)
Median contract rent ($)
Median monthly housing costs ($)
Median house or condo value ($)
Median house or condo value ($ change since 2000)
Mean house or condo value by units in structure - 1, detached ($)
Mean house or condo value by units in structure - 1, attached ($)
Mean house or condo value by units in structure - 2 ($)
Mean house or condo value by units in structure by units in structure - 3 or 4 ($)
Mean house or condo value by units in structure - 5 or more ($)
Mean house or condo value by units in structure - Boat, RV, van, etc. ($)
Mean house or condo value by units in structure - Mobile home ($)
Median house or condo value ($) - White
Median house or condo value ($) - Black or African American
Median house or condo value ($) - Asian
Median house or condo value ($) - Hispanic or Latino
Median house or condo value ($) - American Indian and Alaska Native
Median house or condo value ($) - Multirace
Median house or condo value ($) - Other Race
Median resident age
Resident age diversity
Median resident age - Males
Median resident age - Females
Median resident age - White
Median resident age - Black or African American
Median resident age - Asian
Median resident age - Hispanic or Latino
Median resident age - American Indian and Alaska Native
Median resident age - Multirace
Median resident age - Other Race
Median resident age - Males - White
Median resident age - Males - Black or African American
Median resident age - Males - Asian
Median resident age - Males - Hispanic or Latino
Median resident age - Males - American Indian and Alaska Native
Median resident age - Males - Multirace
Median resident age - Males - Other Race
Median resident age - Females - White
Median resident age - Females - Black or African American
Median resident age - Females - Asian
Median resident age - Females - Hispanic or Latino
Median resident age - Females - American Indian and Alaska Native
Median resident age - Females - Multirace
Median resident age - Females - Other Race
Commute - mean travel time to work (minutes)
Travel time to work - Less than 5 minutes (%)
Travel time to work - Less than 5 minutes (% change since 2000)
Travel time to work - 5 to 9 minutes (%)
Travel time to work - 5 to 9 minutes (% change since 2000)
Travel time to work - 10 to 19 minutes (%)
Travel time to work - 10 to 19 minutes (% change since 2000)
Travel time to work - 20 to 29 minutes (%)
Travel time to work - 20 to 29 minutes (% change since 2000)
Travel time to work - 30 to 39 minutes (%)
Travel time to work - 30 to 39 minutes (% change since 2000)
Travel time to work - 40 to 59 minutes (%)
Travel time to work - 40 to 59 minutes (% change since 2000)
Travel time to work - 60 to 89 minutes (%)
Travel time to work - 60 to 89 minutes (% change since 2000)
Travel time to work - 90 or more minutes (%)
Travel time to work - 90 or more minutes (% change since 2000)
Marital status - Never married (%)
Marital status - Now married (%)
Marital status - Separated (%)
Marital status - Widowed (%)
Marital status - Divorced (%)
Median family income ($)
Median family income (% change since 2000)
Median non-family income ($)
Median non-family income (% change since 2000)
Median per capita income ($)
Median per capita income (% change since 2000)
Median family income ($) - White
Median family income ($) - Black or African American
Median family income ($) - Asian
Median family income ($) - Hispanic or Latino
Median family income ($) - American Indian and Alaska Native
Median family income ($) - Multirace
Median family income ($) - Other Race
Median year house/condo built
Median year apartment built
Year house built - Built 2005 or later (%)
Year house built - Built 2000 to 2004 (%)
Year house built - Built 1990 to 1999 (%)
Year house built - Built 1980 to 1989 (%)
Year house built - Built 1970 to 1979 (%)
Year house built - Built 1960 to 1969 (%)
Year house built - Built 1950 to 1959 (%)
Year house built - Built 1940 to 1949 (%)
Year house built - Built 1939 or earlier (%)
Average household size
Household density (households per square mile)
Average household size - White
Average household size - Black or African American
Average household size - Asian
Average household size - Hispanic or Latino
Average household size - American Indian and Alaska Native
Average household size - Multirace
Average household size - Other Race
Occupied housing units (%)
Vacant housing units (%)
Owner occupied housing units (%)
Renter occupied housing units (%)
Vacancy status - For rent (%)
Vacancy status - For sale only (%)
Vacancy status - Rented or sold, not occupied (%)
Vacancy status - For seasonal, recreational, or occasional use (%)
Vacancy status - For migrant workers (%)
Vacancy status - Other vacant (%)
Residents with income below the poverty level (%)
Residents with income below 50% of the poverty level (%)
Children below poverty level (%)
Poor families by family type - Married-couple family (%)
Poor families by family type - Male, no wife present (%)
Poor families by family type - Female, no husband present (%)
Poverty status for native-born residents (%)
Poverty status for foreign-born residents (%)
Poverty among high school graduates not in families (%)
Poverty among people who did not graduate high school not in families (%)
Residents with income below the poverty level (%) - White
Residents with income below the poverty level (%) - Black or African American
Residents with income below the poverty level (%) - Asian
Residents with income below the poverty level (%) - Hispanic or Latino
Residents with income below the poverty level (%) - American Indian and Alaska Native
Residents with income below the poverty level (%) - Multirace
Residents with income below the poverty level (%) - Other Race
Air pollution - Air Quality Index (AQI)
Air pollution - CO
Air pollution - NO2
Air pollution - SO2
Air pollution - Ozone
Air pollution - PM10
Air pollution - PM25
Air pollution - Pb
Crime - Murders per 100,000 population
Crime - Rapes per 100,000 population
Crime - Robberies per 100,000 population
Crime - Assaults per 100,000 population
Crime - Burglaries per 100,000 population
Crime - Thefts per 100,000 population
Crime - Auto thefts per 100,000 population
Crime - Arson per 100,000 population
Crime - City-data.com crime index
Crime - Violent crime index
Crime - Property crime index
Crime - Murders per 100,000 population (5 year average)
Crime - Rapes per 100,000 population (5 year average)
Crime - Robberies per 100,000 population (5 year average)
Crime - Assaults per 100,000 population (5 year average)
Crime - Burglaries per 100,000 population (5 year average)
Crime - Thefts per 100,000 population (5 year average)
Crime - Auto thefts per 100,000 population (5 year average)
Crime - Arson per 100,000 population (5 year average)
Crime - City-data.com crime index (5 year average)
Crime - Violent crime index (5 year average)
Crime - Property crime index (5 year average)
1996 Presidential Elections Results (%) - Democratic Party (Clinton)
1996 Presidential Elections Results (%) - Republican Party (Dole)
1996 Presidential Elections Results (%) - Other
2000 Presidential Elections Results (%) - Democratic Party (Gore)
2000 Presidential Elections Results (%) - Republican Party (Bush)
2000 Presidential Elections Results (%) - Other
2004 Presidential Elections Results (%) - Democratic Party (Kerry)
2004 Presidential Elections Results (%) - Republican Party (Bush)
2004 Presidential Elections Results (%) - Other
2008 Presidential Elections Results (%) - Democratic Party (Obama)
2008 Presidential Elections Results (%) - Republican Party (McCain)
2008 Presidential Elections Results (%) - Other
2012 Presidential Elections Results (%) - Democratic Party (Obama)
2012 Presidential Elections Results (%) - Republican Party (Romney)
2012 Presidential Elections Results (%) - Other
2016 Presidential Elections Results (%) - Democratic Party (Clinton)
2016 Presidential Elections Results (%) - Republican Party (Trump)
2016 Presidential Elections Results (%) - Other
2020 Presidential Elections Results (%) - Democratic Party (Biden)
2020 Presidential Elections Results (%) - Republican Party (Trump)
2020 Presidential Elections Results (%) - Other
Ancestries Reported - Arab (%)
Ancestries Reported - Czech (%)
Ancestries Reported - Danish (%)
Ancestries Reported - Dutch (%)
Ancestries Reported - English (%)
Ancestries Reported - French (%)
Ancestries Reported - French Canadian (%)
Ancestries Reported - German (%)
Ancestries Reported - Greek (%)
Ancestries Reported - Hungarian (%)
Ancestries Reported - Irish (%)
Ancestries Reported - Italian (%)
Ancestries Reported - Lithuanian (%)
Ancestries Reported - Norwegian (%)
Ancestries Reported - Polish (%)
Ancestries Reported - Portuguese (%)
Ancestries Reported - Russian (%)
Ancestries Reported - Scotch-Irish (%)
Ancestries Reported - Scottish (%)
Ancestries Reported - Slovak (%)
Ancestries Reported - Subsaharan African (%)
Ancestries Reported - Swedish (%)
Ancestries Reported - Swiss (%)
Ancestries Reported - Ukrainian (%)
Ancestries Reported - United States (%)
Ancestries Reported - Welsh (%)
Ancestries Reported - West Indian (%)
Ancestries Reported - Other (%)
Educational Attainment - No schooling completed (%)
Educational Attainment - Less than high school (%)
Educational Attainment - High school or equivalent (%)
Educational Attainment - Less than 1 year of college (%)
Educational Attainment - 1 or more years of college (%)
Educational Attainment - Associate degree (%)
Educational Attainment - Bachelor's degree (%)
Educational Attainment - Master's degree (%)
Educational Attainment - Professional school degree (%)
Educational Attainment - Doctorate degree (%)
School Enrollment - Nursery, preschool (%)
School Enrollment - Kindergarten (%)
School Enrollment - Grade 1 to 4 (%)
School Enrollment - Grade 5 to 8 (%)
School Enrollment - Grade 9 to 12 (%)
School Enrollment - College undergrad (%)
School Enrollment - Graduate or professional (%)
School Enrollment - Not enrolled in school (%)
School enrollment - Public schools (%)
School enrollment - Private schools (%)
School enrollment - Not enrolled (%)
Median number of rooms in houses and condos
Median number of rooms in apartments
Housing units lacking complete plumbing facilities (%)
Housing units lacking complete kitchen facilities (%)
Density of houses
Urban houses (%)
Rural houses (%)
Households with people 60 years and over (%)
Households with people 65 years and over (%)
Households with people 75 years and over (%)
Households with one or more nonrelatives (%)
Households with no nonrelatives (%)
Population in households (%)
Family households (%)
Nonfamily households (%)
Population in families (%)
Family households with own children (%)
Median number of bedrooms in owner occupied houses
Mean number of bedrooms in owner occupied houses
Median number of bedrooms in renter occupied houses
Mean number of bedrooms in renter occupied houses
Median number of vehichles in owner occupied houses
Mean number of vehichles in owner occupied houses
Median number of vehichles in renter occupied houses
Mean number of vehichles in renter occupied houses
Mortgage status - with mortgage (%)
Mortgage status - with second mortgage (%)
Mortgage status - with home equity loan (%)
Mortgage status - with both second mortgage and home equity loan (%)
Mortgage status - without a mortgage (%)
Average family size
Average family size - White
Average family size - Black or African American
Average family size - Asian
Average family size - Hispanic or Latino
Average family size - American Indian and Alaska Native
Average family size - Multirace
Average family size - Other Race
Geographical mobility - Same house 1 year ago (%)
Geographical mobility - Moved within same county (%)
Geographical mobility - Moved from different county within same state (%)
Geographical mobility - Moved from different state (%)
Geographical mobility - Moved from abroad (%)
Place of birth - Born in state of residence (%)
Place of birth - Born in other state (%)
Place of birth - Native, outside of US (%)
Place of birth - Foreign born (%)
Housing units in structures - 1, detached (%)
Housing units in structures - 1, attached (%)
Housing units in structures - 2 (%)
Housing units in structures - 3 or 4 (%)
Housing units in structures - 5 to 9 (%)
Housing units in structures - 10 to 19 (%)
Housing units in structures - 20 to 49 (%)
Housing units in structures - 50 or more (%)
Housing units in structures - Mobile home (%)
Housing units in structures - Boat, RV, van, etc. (%)
House/condo owner moved in on average (years ago)
Renter moved in on average (years ago)
Year householder moved into unit - Moved in 1999 to March 2000 (%)
Year householder moved into unit - Moved in 1995 to 1998 (%)
Year householder moved into unit - Moved in 1990 to 1994 (%)
Year householder moved into unit - Moved in 1980 to 1989 (%)
Year householder moved into unit - Moved in 1970 to 1979 (%)
Year householder moved into unit - Moved in 1969 or earlier (%)
Means of transportation to work - Drove car alone (%)
Means of transportation to work - Carpooled (%)
Means of transportation to work - Public transportation (%)
Means of transportation to work - Bus or trolley bus (%)
Means of transportation to work - Streetcar or trolley car (%)
Means of transportation to work - Subway or elevated (%)
Means of transportation to work - Railroad (%)
Means of transportation to work - Ferryboat (%)
Means of transportation to work - Taxicab (%)
Means of transportation to work - Motorcycle (%)
Means of transportation to work - Bicycle (%)
Means of transportation to work - Walked (%)
Means of transportation to work - Other means (%)
Working at home (%)
Industry diversity
Most Common Industries - Agriculture, forestry, fishing and hunting, and mining (%)
Most Common Industries - Agriculture, forestry, fishing and hunting (%)
Most Common Industries - Mining, quarrying, and oil and gas extraction (%)
Most Common Industries - Construction (%)
Most Common Industries - Manufacturing (%)
Most Common Industries - Wholesale trade (%)
Most Common Industries - Retail trade (%)
Most Common Industries - Transportation and warehousing, and utilities (%)
Most Common Industries - Transportation and warehousing (%)
Most Common Industries - Utilities (%)
Most Common Industries - Information (%)
Most Common Industries - Finance and insurance, and real estate and rental and leasing (%)
Most Common Industries - Finance and insurance (%)
Most Common Industries - Real estate and rental and leasing (%)
Most Common Industries - Professional, scientific, and management, and administrative and waste management services (%)
Most Common Industries - Professional, scientific, and technical services (%)
Most Common Industries - Management of companies and enterprises (%)
Most Common Industries - Administrative and support and waste management services (%)
Most Common Industries - Educational services, and health care and social assistance (%)
Most Common Industries - Educational services (%)
Most Common Industries - Health care and social assistance (%)
Most Common Industries - Arts, entertainment, and recreation, and accommodation and food services (%)
Most Common Industries - Arts, entertainment, and recreation (%)
Most Common Industries - Accommodation and food services (%)
Most Common Industries - Other services, except public administration (%)
Most Common Industries - Public administration (%)
Occupation diversity
Most Common Occupations - Management, business, science, and arts occupations (%)
Most Common Occupations - Management, business, and financial occupations (%)
Most Common Occupations - Management occupations (%)
Most Common Occupations - Business and financial operations occupations (%)
Most Common Occupations - Computer, engineering, and science occupations (%)
Most Common Occupations - Computer and mathematical occupations (%)
Most Common Occupations - Architecture and engineering occupations (%)
Most Common Occupations - Life, physical, and social science occupations (%)
Most Common Occupations - Education, legal, community service, arts, and media occupations (%)
Most Common Occupations - Community and social service occupations (%)
Most Common Occupations - Legal occupations (%)
Most Common Occupations - Education, training, and library occupations (%)
Most Common Occupations - Arts, design, entertainment, sports, and media occupations (%)
Most Common Occupations - Healthcare practitioners and technical occupations (%)
Most Common Occupations - Health diagnosing and treating practitioners and other technical occupations (%)
Most Common Occupations - Health technologists and technicians (%)
Most Common Occupations - Service occupations (%)
Most Common Occupations - Healthcare support occupations (%)
Most Common Occupations - Protective service occupations (%)
Most Common Occupations - Fire fighting and prevention, and other protective service workers including supervisors (%)
Most Common Occupations - Law enforcement workers including supervisors (%)
Most Common Occupations - Food preparation and serving related occupations (%)
Most Common Occupations - Building and grounds cleaning and maintenance occupations (%)
Most Common Occupations - Personal care and service occupations (%)
Most Common Occupations - Sales and office occupations (%)
Most Common Occupations - Sales and related occupations (%)
Most Common Occupations - Office and administrative support occupations (%)
Most Common Occupations - Natural resources, construction, and maintenance occupations (%)
Most Common Occupations - Farming, fishing, and forestry occupations (%)
Most Common Occupations - Construction and extraction occupations (%)
Most Common Occupations - Installation, maintenance, and repair occupations (%)
Most Common Occupations - Production, transportation, and material moving occupations (%)
Most Common Occupations - Production occupations (%)
Most Common Occupations - Transportation occupations (%)
Most Common Occupations - Material moving occupations (%)
People in Group quarters - Institutionalized population (%)
People in Group quarters - Correctional institutions (%)
People in Group quarters - Federal prisons and detention centers (%)
People in Group quarters - Halfway houses (%)
People in Group quarters - Local jails and other confinement facilities (including police lockups) (%)
People in Group quarters - Military disciplinary barracks (%)
People in Group quarters - State prisons (%)
People in Group quarters - Other types of correctional institutions (%)
People in Group quarters - Nursing homes (%)
People in Group quarters - Hospitals/wards, hospices, and schools for the handicapped (%)
People in Group quarters - Hospitals/wards and hospices for chronically ill (%)
People in Group quarters - Hospices or homes for chronically ill (%)
People in Group quarters - Military hospitals or wards for chronically ill (%)
People in Group quarters - Other hospitals or wards for chronically ill (%)
People in Group quarters - Hospitals or wards for drug/alcohol abuse (%)
People in Group quarters - Mental (Psychiatric) hospitals or wards (%)
People in Group quarters - Schools, hospitals, or wards for the mentally retarded (%)
People in Group quarters - Schools, hospitals, or wards for the physically handicapped (%)
People in Group quarters - Institutions for the deaf (%)
People in Group quarters - Institutions for the blind (%)
People in Group quarters - Orthopedic wards and institutions for the physically handicapped (%)
People in Group quarters - Wards in general hospitals for patients who have no usual home elsewhere (%)
People in Group quarters - Wards in military hospitals for patients who have no usual home elsewhere (%)
People in Group quarters - Juvenile institutions (%)
People in Group quarters - Long-term care (%)
People in Group quarters - Homes for abused, dependent, and neglected children (%)
People in Group quarters - Residential treatment centers for emotionally disturbed children (%)
People in Group quarters - Training schools for juvenile delinquents (%)
People in Group quarters - Short-term care, detention or diagnostic centers for delinquent children (%)
People in Group quarters - Type of juvenile institution unknown (%)
People in Group quarters - Noninstitutionalized population (%)
People in Group quarters - College dormitories (includes college quarters off campus) (%)
People in Group quarters - Military quarters (%)
People in Group quarters - On base (%)
People in Group quarters - Barracks, unaccompanied personnel housing (UPH), (Enlisted/Officer), ;and similar group living quarters for military personnel (%)
People in Group quarters - Transient quarters for temporary residents (%)
People in Group quarters - Military ships (%)
People in Group quarters - Group homes (%)
People in Group quarters - Homes or halfway houses for drug/alcohol abuse (%)
People in Group quarters - Homes for the mentally ill (%)
People in Group quarters - Homes for the mentally retarded (%)
People in Group quarters - Homes for the physically handicapped (%)
People in Group quarters - Other group homes (%)
People in Group quarters - Religious group quarters (%)
People in Group quarters - Dormitories (%)
People in Group quarters - Agriculture workers' dormitories on farms (%)
People in Group quarters - Job Corps and vocational training facilities (%)
People in Group quarters - Other workers' dormitories (%)
People in Group quarters - Crews of maritime vessels (%)
People in Group quarters - Other nonhousehold living situations (%)
People in Group quarters - Other noninstitutional group quarters (%)
Residents speaking English at home (%)
Residents speaking English at home - Born in the United States (%)
Residents speaking English at home - Native, born elsewhere (%)
Residents speaking English at home - Foreign born (%)
Residents speaking Spanish at home (%)
Residents speaking Spanish at home - Born in the United States (%)
Residents speaking Spanish at home - Native, born elsewhere (%)
Residents speaking Spanish at home - Foreign born (%)
Residents speaking other language at home (%)
Residents speaking other language at home - Born in the United States (%)
Residents speaking other language at home - Native, born elsewhere (%)
Residents speaking other language at home - Foreign born (%)
Class of Workers - Employee of private company (%)
Class of Workers - Self-employed in own incorporated business (%)
Class of Workers - Private not-for-profit wage and salary workers (%)
Class of Workers - Local government workers (%)
Class of Workers - State government workers (%)
Class of Workers - Federal government workers (%)
Class of Workers - Self-employed workers in own not incorporated business and Unpaid family workers (%)
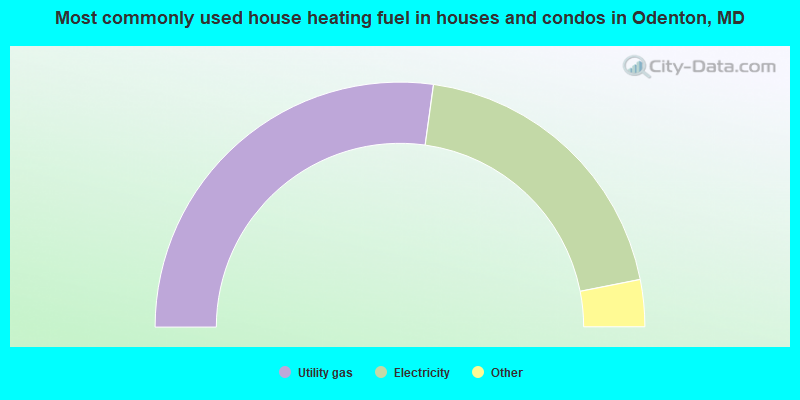
House heating fuel used in houses and condos - Utility gas (%)
House heating fuel used in houses and condos - Bottled, tank, or LP gas (%)
House heating fuel used in houses and condos - Electricity (%)
House heating fuel used in houses and condos - Fuel oil, kerosene, etc. (%)
House heating fuel used in houses and condos - Coal or coke (%)
House heating fuel used in houses and condos - Wood (%)
House heating fuel used in houses and condos - Solar energy (%)
House heating fuel used in houses and condos - Other fuel (%)
House heating fuel used in houses and condos - No fuel used (%)
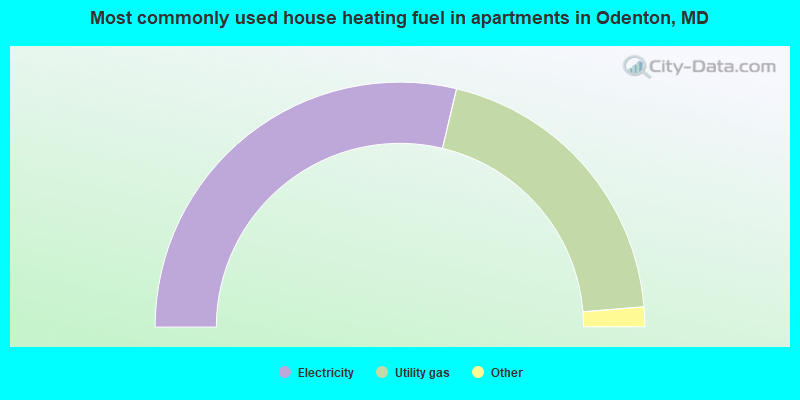
House heating fuel used in apartments - Utility gas (%)
House heating fuel used in apartments - Bottled, tank, or LP gas (%)
House heating fuel used in apartments - Electricity (%)
House heating fuel used in apartments - Fuel oil, kerosene, etc. (%)
House heating fuel used in apartments - Coal or coke (%)
House heating fuel used in apartments - Wood (%)
House heating fuel used in apartments - Solar energy (%)
House heating fuel used in apartments - Other fuel (%)
House heating fuel used in apartments - No fuel used (%)
Armed forces status - In Armed Forces (%)
Armed forces status - Civilian (%)
Armed forces status - Civilian - Veteran (%)
Armed forces status - Civilian - Nonveteran (%)
Read more: https://www.city-data.com/accidents/acc-Addison-Illinois.html
Fatal accidents locations in years 2005-2022
Fatal accidents locations in 2022
Fatal accidents locations in 2021
Fatal accidents locations in 2020
Fatal accidents locations in 2019
Fatal accidents locations in 2018
Fatal accidents locations in 2017
Fatal accidents locations in 2016
Fatal accidents locations in 2015
Fatal accidents locations in 2014
Fatal accidents locations in 2013
Fatal accidents locations in 2012
Fatal accidents locations in 2011
Fatal accidents locations in 2010
Fatal accidents locations in 2009
Fatal accidents locations in 2008
Fatal accidents locations in 2007
Fatal accidents locations in 2006
Fatal accidents locations in 2005
Alcohol use - People drinking some alcohol every month (%)
Alcohol use - People not drinking at all (%)
Alcohol use - Average days/month drinking alcohol
Alcohol use - Average drinks/week
Alcohol use - Average days/year people drink much
Audiometry - Average condition of hearing (%)
Audiometry - People that can hear a whisper from across a quiet room (%)
Audiometry - People that can hear normal voice from across a quiet room (%)
Audiometry - Ears ringing, roaring, buzzing (%)
Audiometry - Had a job exposure to loud noise (%)
Audiometry - Had off-work exposure to loud noise (%)
Blood Pressure & Cholesterol - Has high blood pressure (%)
Blood Pressure & Cholesterol - Checking blood pressure at home (%)
Blood Pressure & Cholesterol - Frequently checking blood cholesterol (%)
Blood Pressure & Cholesterol - Has high cholesterol level (%)
Consumer Behavior - Money monthly spent on food at supermarket/grocery store
Consumer Behavior - Money monthly spent on food at other stores
Consumer Behavior - Money monthly spent on eating out
Consumer Behavior - Money monthly spent on carryout/delivered foods
Consumer Behavior - Income spent on food at supermarket/grocery store (%)
Consumer Behavior - Income spent on food at other stores (%)
Consumer Behavior - Income spent on eating out (%)
Consumer Behavior - Income spent on carryout/delivered foods (%)
Current Health Status - General health condition (%)
Current Health Status - Blood donors (%)
Current Health Status - Has blood ever tested for HIV virus (%)
Current Health Status - Left-handed people (%)
Dermatology - People using sunscreen (%)
Diabetes - Diabetics (%)
Diabetes - Had a blood test for high blood sugar (%)
Diabetes - People taking insulin (%)
Diet Behavior & Nutrition - Diet health (%)
Diet Behavior & Nutrition - Milk product consumption (# of products/month)
Diet Behavior & Nutrition - Meals not home prepared (#/week)
Diet Behavior & Nutrition - Meals from fast food or pizza place (#/week)
Diet Behavior & Nutrition - Ready-to-eat foods (#/month)
Diet Behavior & Nutrition - Frozen meals/pizza (#/month)
Drug Use - People that ever used marijuana or hashish (%)
Drug Use - Ever used hard drugs (%)
Drug Use - Ever used any form of cocaine (%)
Drug Use - Ever used heroin (%)
Drug Use - Ever used methamphetamine (%)
Health Insurance - People covered by health insurance (%)
Kidney Conditions-Urology - Avg. # of times urinating at night
Medical Conditions - People with asthma (%)
Medical Conditions - People with anemia (%)
Medical Conditions - People with psoriasis (%)
Medical Conditions - People with overweight (%)
Medical Conditions - Elderly people having difficulties in thinking or remembering (%)
Medical Conditions - People who ever received blood transfusion (%)
Medical Conditions - People having trouble seeing even with glass/contacts (%)
Medical Conditions - People with arthritis (%)
Medical Conditions - People with gout (%)
Medical Conditions - People with congestive heart failure (%)
Medical Conditions - People with coronary heart disease (%)
Medical Conditions - People with angina pectoris (%)
Medical Conditions - People who ever had heart attack (%)
Medical Conditions - People who ever had stroke (%)
Medical Conditions - People with emphysema (%)
Medical Conditions - People with thyroid problem (%)
Medical Conditions - People with chronic bronchitis (%)
Medical Conditions - People with any liver condition (%)
Medical Conditions - People who ever had cancer or malignancy (%)
Mental Health - People who have little interest in doing things (%)
Mental Health - People feeling down, depressed, or hopeless (%)
Mental Health - People who have trouble sleeping or sleeping too much (%)
Mental Health - People feeling tired or having little energy (%)
Mental Health - People with poor appetite or overeating (%)
Mental Health - People feeling bad about themself (%)
Mental Health - People who have trouble concentrating on things (%)
Mental Health - People moving or speaking slowly or too fast (%)
Mental Health - People having thoughts they would be better off dead (%)
Oral Health - Average years since last visit a dentist
Oral Health - People embarrassed because of mouth (%)
Oral Health - People with gum disease (%)
Oral Health - General health of teeth and gums (%)
Oral Health - Average days a week using dental floss/device
Oral Health - Average days a week using mouthwash for dental problem
Oral Health - Average number of teeth
Pesticide Use - Households using pesticides to control insects (%)
Pesticide Use - Households using pesticides to kill weeds (%)
Physical Activity - People doing vigorous-intensity work activities (%)
Physical Activity - People doing moderate-intensity work activities (%)
Physical Activity - People walking or bicycling (%)
Physical Activity - People doing vigorous-intensity recreational activities (%)
Physical Activity - People doing moderate-intensity recreational activities (%)
Physical Activity - Average hours a day doing sedentary activities
Physical Activity - Average hours a day watching TV or videos
Physical Activity - Average hours a day using computer
Physical Functioning - People having limitations keeping them from working (%)
Physical Functioning - People limited in amount of work they can do (%)
Physical Functioning - People that need special equipment to walk (%)
Physical Functioning - People experiencing confusion/memory problems (%)
Physical Functioning - People requiring special healthcare equipment (%)
Prescription Medications - Average number of prescription medicines taking
Preventive Aspirin Use - Adults 40+ taking low-dose aspirin (%)
Reproductive Health - Vaginal deliveries (%)
Reproductive Health - Cesarean deliveries (%)
Reproductive Health - Deliveries resulted in a live birth (%)
Reproductive Health - Pregnancies resulted in a delivery (%)
Reproductive Health - Women breastfeeding newborns (%)
Reproductive Health - Women that had a hysterectomy (%)
Reproductive Health - Women that had both ovaries removed (%)
Reproductive Health - Women that have ever taken birth control pills (%)
Reproductive Health - Women taking birth control pills (%)
Reproductive Health - Women that have ever used Depo-Provera or injectables (%)
Reproductive Health - Women that have ever used female hormones (%)
Sexual Behavior - People 18+ that ever had sex (vaginal, anal, or oral) (%)
Sexual Behavior - Males 18+ that ever had vaginal sex with a woman (%)
Sexual Behavior - Males 18+ that ever performed oral sex on a woman (%)
Sexual Behavior - Males 18+ that ever had anal sex with a woman (%)
Sexual Behavior - Males 18+ that ever had any sex with a man (%)
Sexual Behavior - Females 18+ that ever had vaginal sex with a man (%)
Sexual Behavior - Females 18+ that ever performed oral sex on a man (%)
Sexual Behavior - Females 18+ that ever had anal sex with a man (%)
Sexual Behavior - Females 18+ that ever had any kind of sex with a woman (%)
Sexual Behavior - Average age people first had sex
Sexual Behavior - Average number of female sex partners in lifetime (males 18+)
Sexual Behavior - Average number of female vaginal sex partners in lifetime (males 18+)
Sexual Behavior - Average age people first performed oral sex on a woman (18+)
Sexual Behavior - Average number of woman performed oral sex on in lifetime (18+)
Sexual Behavior - Average number of male sex partners in lifetime (males 18+)
Sexual Behavior - Average number of male anal sex partners in lifetime (males 18+)
Sexual Behavior - Average age people first performed oral sex on a man (18+)
Sexual Behavior - Average number of male oral sex partners in lifetime (18+)
Sexual Behavior - People using protection when performing oral sex (%)
Sexual Behavior - Average number of times people have vaginal or anal sex a year
Sexual Behavior - People having sex without condom (%)
Sexual Behavior - Average number of male sex partners in lifetime (females 18+)
Sexual Behavior - Average number of male vaginal sex partners in lifetime (females 18+)
Sexual Behavior - Average number of female sex partners in lifetime (females 18+)
Sexual Behavior - Circumcised males 18+ (%)
Sleep Disorders - Average hours sleeping at night
Sleep Disorders - People that has trouble sleeping (%)
Smoking-Cigarette Use - People smoking cigarettes (%)
Taste & Smell - People 40+ having problems with smell (%)
Taste & Smell - People 40+ having problems with taste (%)
Taste & Smell - People 40+ that ever had wisdom teeth removed (%)
Taste & Smell - People 40+ that ever had tonsils teeth removed (%)
Taste & Smell - People 40+ that ever had a loss of consciousness because of a head injury (%)
Taste & Smell - People 40+ that ever had a broken nose or other serious injury to face or skull (%)
Taste & Smell - People 40+ that ever had two or more sinus infections (%)
Weight - Average height (inches)
Weight - Average weight (pounds)
Weight - Average BMI
Weight - People that are obese (%)
Weight - People that ever were obese (%)
Weight - People trying to lose weight (%)
According to our research of Maryland and other state lists, there were 27 registered sex offenders living in Odenton, Maryland as of April 30, 2025 . The ratio of all residents to sex offenders in Odenton is 1,495 to 1.The ratio of registered sex offenders to all residents in this city is lower than the state average.
Latest news from Odenton, MD collected exclusively by city-data.com from local newspapers, TV, and radio stations
Ancestries: German (6.5%), American (6.3%), Irish (5.7%), European (5.6%), English (5.4%), Italian (3.6%).
Current Local Time:
Land area: 12.4 square miles.
Population density: 2,990 people per square mile (average).
4,808 residents are foreign born (4.0% Asia , 2.3% Latin America , 2.0% Africa , 1.5% Europe ).
This place:
10.5%Maryland:
16.3%
Median real estate property taxes paid for housing units with mortgages in 2023: $3,537 (0.8%)Median real estate property taxes paid for housing units with no mortgage in 2023: $3,614 (0.9%)
Nearest city with pop. 50,000+: Bowie, MD (7.8 miles
Nearest city with pop. 200,000+: Baltimore, MD
Nearest city with pop. 1,000,000+: Philadelphia, PA
Nearest cities:
Georgetown, MD (2.4 miles)
Latitude: 39.07 N, Longitude: 76.70 W
Daytime population change due to commuting: -11,232 (-24.5%)Workers who live and work in this place: 6,987 (26.9%)
Property values in Odenton, MD
Unemployment in November 2024:
Most common occupations in Odenton, MD (%)
Both Males Females
Computer specialists (7.5%)
Other office and administrative support workers, including supervisors (4.8%)
Other management occupations, except farmers and farm managers (4.7%)
Secretaries and administrative assistants (4.0%)
Other sales and related occupations, including supervisors (3.8%)
Preschool, kindergarten, elementary, and middle school teachers (3.7%)
Engineers (3.0%)
Computer specialists (11.8%)
Other management occupations, except farmers and farm managers (5.4%)
Engineers (5.3%)
Other sales and related occupations, including supervisors (4.1%)
Law enforcement workers, including supervisors (3.8%)
Electrical equipment mechanics and other installation, maintenance, and repair workers, including supervisors (3.6%)
Material recording, scheduling, dispatching, and distributing workers (3.0%)
Secretaries and administrative assistants (8.0%)
Other office and administrative support workers, including supervisors (7.8%)
Preschool, kindergarten, elementary, and middle school teachers (7.1%)
Other management occupations, except farmers and farm managers (4.0%)
Information and record clerks, except customer service representatives (3.6%)
Other sales and related occupations, including supervisors (3.5%)
Child care workers (3.4%)
Tornado activity:
Odenton-area historical tornado activity is slightly above Maryland state average. It is 12% greater than the overall U.S. average.
On 6/9/1961, a category F3 (max. wind speeds 158-206 mph) tornado 9.9 miles away from the Odenton place center caused between $50,000 and $500,000 in damages.
On 9/24/2001, a category F3 tornado 13.0 miles away from the place center killed 2 people and injured 55 people and caused $101 million in damages.
Earthquake activity:
Odenton-area historical earthquake activity is significantly above Maryland state average. It is 59% smaller than the overall U.S. average. On 8/23/2011 at 17:51:04, a magnitude 5.8 (5.8 MW, Depth: 3.7 mi, Class: Moderate, Intensity: VI - VII) earthquake occurred 104.6 miles away from the city center On 1/16/1994 at 01:49:16, a magnitude 4.6 (4.6 MB, 4.6 LG, Depth: 3.1 mi, Class: Light, Intensity: IV - V) earthquake occurred 93.9 miles away from the city center On 8/25/2011 at 05:07:52, a magnitude 4.5 (4.5 ML, Depth: 4.2 mi) earthquake occurred 103.7 miles away from Odenton center On 12/9/2003 at 20:59:18, a magnitude 4.5 (4.5 ML, Depth: 6.2 mi) earthquake occurred 117.5 miles away from the city center On 9/25/1998 at 19:52:52, a magnitude 5.2 (4.8 MB, 4.3 MS, 5.2 LG, 4.5 MW, Depth: 3.1 mi) earthquake occurred 257.0 miles away from Odenton center On 12/9/2003 at 20:59:14, a magnitude 4.5 (4.5 MB, 4.5 LG) earthquake occurred 121.7 miles away from the city center Magnitude types: regional Lg-wave magnitude (LG), body-wave magnitude (MB), local magnitude (ML), surface-wave magnitude (MS), moment magnitude (MW) Natural disasters: The number of natural disasters in Anne Arundel County (21) is near the US average (19).Major Disasters (Presidential) Declared: 15Emergencies Declared: 5Hurricanes: 6, Winter Storms: 6, Snowstorms: 4, Floods: 3, Storms: 3, Tropical Storms: 2, Blizzard: 1, Heavy Rain: 1, Ice Storm: 1, Snowfall: 1, Tornado: 1, Other: 2 (Note: some incidents may be assigned to more than one category). Hospitals and medical centers near Odenton: KNOLLWOOD MANOR NURSING HOME (Nursing Home, about 3 miles away; MILLERSVILLE, MD)
CROFTON CONVALESCENT CENTER (Nursing Home, about 5 miles away; CROFTON, MD)
FAIRFIELD NRSG CNTR INC (Nursing Home, about 6 miles away; CROWNSVILLE, MD)
FAIRFIELD NURSING AND REHABILITATION CENTER (Nursing Home, about 6 miles away; CROWNSVILLE, MD)
NORTH ARUNDEL SUBACUTE (Nursing Home, about 7 miles away; GLEN BURNIE, MD)
NORTH ARUNDEL HEALTH AND REHABILITATION CENTER (Nursing Home, about 7 miles away; GLEN BURNIE, MD)
CROWNSVILLE HOSPITAL CENTER (Hospital, about 7 miles away; CROWNSVILLE, MD)
Amtrak stations near Odenton: 9 miles: BWI AIRPORT RAIL STATION (BALTIMORE, AMTRAK WAY) Services: ticket office, fully wheelchair accessible, enclosed waiting area, public restrooms, public payphones, snack bar, ATM, paid short-term parking, paid long-term parking, call for car rental service, call for taxi service, public transit connection.
13 miles: NEW CARROLLTON (4300 GARDEN CITY DR.) Services: ticket office, fully wheelchair accessible, enclosed waiting area, public restrooms, public payphones, snack bar, ATM, paid short-term parking, paid long-term parking, call for car rental service, taxi stand, public transit connection.
17 miles: BALTIMORE (1500 N. CHARLES ST.) Services: ticket office, fully wheelchair accessible, enclosed waiting area, public restrooms, public payphones, full-service food facilities, snack bar, vending machines, ATM, paid short-term parking, paid long-term parking, call for car rental service, taxi stand, public transit connection.
Colleges/universities with over 2000 students nearest to Odenton:
Bowie State University (about 5 miles; Bowie, MD ; Full-time enrollment: 4,517)
Anne Arundel Community College (about 11 miles; Arnold, MD ; FT enrollment: 10,501)
University of Maryland-Baltimore County (about 13 miles; Baltimore, MD ; FT enrollment: 11,160)
United States Naval Academy (about 14 miles; Annapolis, MD ; FT enrollment: 5,681)
Howard Community College (about 14 miles; Columbia, MD ; FT enrollment: 6,528)
University of Maryland-College Park (about 15 miles; College Park, MD ; FT enrollment: 32,734)
Prince George's Community College (about 15 miles; Largo, MD ; FT enrollment: 8,537)
Private high schools in Odenton: ODENTON CHRISTIAN ACADEMY Students: 353, Location: 8410 PINEY ORCHARD PKWY, Grades: PK-12)
LIGHTHOUSE CHRISTIAN ACADEMY Students: 7, Location: 1460 BERGER ST, Grades: 2-12)
Public elementary/middle schools in Odenton:
See full list of schools located in Odenton User-submitted facts and corrections:
The Odenton Library has been replaced by the West County Area Library, located at 1325 Annapolis Road, Odenton. The phone number 410-222-6277 remains the same.
Notable locations in Odenton: (A) , Mayfield Industrial Park (B) , Arundel Crossing West Industrial Park (C) , United States Naval Academy Dairy Farm (D) , Piney Orchard Business Park (E) , Gambrills Athletic Club (F) , Fort Meade Sewage Disposal Plant (G) , Capitol Raceway (H) , Arundel Crossing East Industrial Park (I) , Night Hawk Golf Course (J) , Regency Park Assisted Living Center (K) , Heart Homes at Piney Orchard Assisted Living Center (L) , Odenton Branch Library (M) , Odenton Volunteer Fire Department (N) . Display/hide their locations on the map
Shopping Centers: (1) , Village Center Shopping Center (2) , Odenton Shopping Center (3) , Village At Waugh Chapel Shopping Center (4) . Display/hide their locations on the map
Churches in Odenton include: (A) , Epiphany Episcopal Church (B) , First Evangelical Lutheran Church (C) , Old Bethel Methodist Church (D) , Emmanuel Mission (E) , Macedonia United Methodist Church (F) . Display/hide their locations on the map
Cemeteries: (1) , Waugh Cemetery (2) , Old Bethel Cemetery (3) , Macedonia Cemetery (4) . Display/hide their locations on the map
Streams, rivers, and creeks: (A) , Towsers Branch (B) . Display/hide their locations on the map
Parks in Odenton include: (1) , Odenton Park Recreation Area (2) , Towsers Branch Park (3) . Display/hide their locations on the map
Hotel:
Birthplace of: Darnerien McCants - 2005 NFL player (Philadelphia Eagles, born : Aug 1, 1977), Jamie Fritsch - Ice hockey player, Babe Phelps - Baseball player.
Anne Arundel County has a predicted average indoor radon screening level between 2 and 4 pCi/L (pico curies per liter) - Moderate Potential Drinking water stations with addresses in Odenton and their reported violations in the past:
BILLS NORTH ODENTON SHOPPING CENTER (Population served: 25, Groundwater):
Past health violations:
OCCT/SOWT Study/Recommendation - In JUL-01-2007, Contaminant: Lead and Copper Rule. Follow-up actions: St Violation/Reminder Notice (JAN-18-2008), Fed Violation/Reminder Notice (FEB-07-2011), Fed Formal NOV issued (FEB-07-2011), St Violation/Reminder Notice (FEB-11-2011), Fed Compliance achieved (MAR-01-2011), St Compliance achieved (MAR-11-2011)
Past monitoring violations:
Follow-up Or Routine LCR Tap M/R - In JAN-01-2010, Contaminant: Lead and Copper Rule. Follow-up actions: St Public Notif requested (MAR-03-2010), St Violation/Reminder Notice (MAR-03-2010), St Public Notif received (MAR-09-2010), St Compliance achieved (APR-07-2010)
Follow-up Or Routine LCR Tap M/R - In JUL-01-2009, Contaminant: Lead and Copper Rule. Follow-up actions: St Compliance achieved (JAN-25-2010), St Public Notif requested (MAR-03-2010)
Initial, Follow-up, or Routine Source Water M/R - In JUL-01-2007, Contaminant: Lead and Copper Rule. Follow-up actions: St Violation/Reminder Notice (JAN-18-2008), St Compliance achieved (JAN-19-2011), Fed Violation/Reminder Notice (FEB-07-2011), Fed Formal NOV issued (FEB-07-2011), St Violation/Reminder Notice (FEB-11-2011), Fed Compliance achieved (MAR-01-2011)
Water Quality Parameter M/R - Between JUL-2006 and DEC-2006, Contaminant: Lead and Copper Rule. Follow-up actions: St Violation/Reminder Notice (JAN-18-2008), Fed Violation/Reminder Notice (FEB-07-2011), St Compliance achieved (FEB-07-2011), Fed Formal NOV issued (FEB-07-2011), St Violation/Reminder Notice (FEB-11-2011), Fed Compliance achieved (MAR-01-2011)
Follow-up Or Routine LCR Tap M/R - In JAN-01-2004, Contaminant: Lead and Copper Rule. Follow-up actions: St Violation/Reminder Notice (3 times from JUN-09-2004 to JUN-03-2005), St Compliance achieved (AUG-11-2005)
Average household size: This place:
2.5 peopleMaryland:
2.6 people
Percentage of family households: This place:
66.7%Whole state:
67.1%
Percentage of households with unmarried partners: This place:
5.8%Whole state:
6.4%
Likely homosexual households (counted as self-reported same-sex unmarried-partner households)
Lesbian couples: 0.4% of all households Gay men: 0.3% of all households
6 people in group homes intended for adults in 2010people in other group homes in 2000
Banks with branches in Odenton (2011 data):
The Bank of Glen Burnie: Odenton Branch at Route 175 And Morgan Road, branch established on 1958/11/12. Info updated 2008/09/26: Bank assets: $365.3 mil, Deposits: $312.5 mil, headquarters in Glen Burnie, MD, positive income , 8 total offices , Holding Company: Glen Burnie Bancorp
First Mariner Bank: Odenton Branch at 1600 Annapolis Road, branch established on 2005/11/14. Info updated 2006/10/11: Bank assets: $1,179.4 mil, Deposits: $1,014.8 mil, headquarters in Baltimore, MD, negative income in the last year , Commercial Lending Specialization, 22 total offices , Holding Company: First Mariner Bancorp
The Washington Savings Bank, FSB: Odenton Shopping Center Branch at 1161 Annapolis Road, branch established on 1986/06/30. Info updated 2011/07/21: Bank assets: $384.0 mil, Deposits: $247.5 mil, headquarters in Bowie, MD, positive income , Commercial Lending Specialization, 5 total offices
PNC Bank, National Association: Odenton Branch at 1253 Annapolis Road, branch established on 1966/10/21. Info updated 2012/03/20: Bank assets: $263,309.6 mil, Deposits: $197,343.0 mil, headquarters in Wilmington, DE, positive income , Commercial Lending Specialization, 3085 total offices , Holding Company: Pnc Financial Services Group, Inc., The
Sandy Spring Bank: Piney Orchard At Odenton Branch at 8721 Piney Orchard Parkway, branch established on 1999/06/21. Info updated 2007/07/17: Bank assets: $3,709.4 mil, Deposits: $2,664.0 mil, headquarters in Olney, MD, positive income , Commercial Lending Specialization, 43 total offices , Holding Company: Sandy Spring Bancorp, Inc.
Branch Banking and Trust Company: Odenton Branch at 1219 Annapolis Road, branch established on 1894/01/01. Info updated 2010/03/29: Bank assets: $168,867.6 mil, Deposits: $127,549.5 mil, headquarters in Winston Salem, NC, positive income , Commercial Lending Specialization, 1793 total offices , Holding Company: Bb&T Corporation
Manufacturers and Traders Trust Company: Odenton Branch at 1351 Blair Drive, branch established on 2009/08/31. Info updated 2011/08/08: Bank assets: $76,887.1 mil, Deposits: $60,064.2 mil, headquarters in Buffalo, NY, positive income , Commercial Lending Specialization, 808 total offices , Holding Company: M&T Bank Corporation
For population 15 years and over in Odenton:
Never married: 34.8%Now married: 47.0%Separated: 1.4%Widowed: 3.7%Divorced: 13.1% For population 25 years and over in Odenton:
High school or higher: 97.1%Bachelor's degree or higher: 50.8%Graduate or professional degree: 23.9%Unemployed: 2.7%Mean travel time to work (commute): 24.1 minutes
Education Gini index (Inequality in education) Here:
9.7Maryland average:
13.0
Religion statistics for Odenton, MD (based on Anne Arundel County data)
Religion Adherents Congregations Catholic 95,116 20 Mainline Protestant 49,450 107 Evangelical Protestant 44,446 182 Other 7,076 28 Black Protestant 5,609 11 Orthodox 3,250 2 None 332,709 -
Source: Clifford Grammich, Kirk Hadaway, Richard Houseal, Dale E.Jones, Alexei Krindatch, Richie Stanley and Richard H.Taylor. 2012. 2010 U.S.Religion Census: Religious Congregations & Membership Study. Association of Statisticians of American Religious Bodies. Jones, Dale E., et al. 2002. Congregations and Membership in the United States 2000. Nashville, TN: Glenmary Research Center. Graphs represent county-level data
Food Environment Statistics: Number of grocery stores : 79This county :
1.55 / 10,000 pop.Maryland :
1.96 / 10,000 pop.
Number of supercenters and club stores : 6Anne Arundel County :
0.12 / 10,000 pop.Maryland :
0.07 / 10,000 pop.
Number of convenience stores (no gas) : 56Here :
1.10 / 10,000 pop.State :
1.22 / 10,000 pop.
Number of convenience stores (with gas) : 116Anne Arundel County :
2.27 / 10,000 pop.State :
2.05 / 10,000 pop.
Number of full-service restaurants : 297Anne Arundel County :
5.82 / 10,000 pop.State :
5.40 / 10,000 pop.
Adult diabetes rate : This county :
8.4%Maryland :
9.1%
Adult obesity rate : Anne Arundel County :
25.5%Maryland :
26.7%
Low-income preschool obesity rate : This county :
15.2%State :
15.5%
Health and Nutrition:
Average overall health of teeth and gums : Odenton:
52.9%Maryland:
47.6%
People feeling badly about themselves : This city:
19.4%Maryland:
20.0%
People not drinking alcohol at all : Average hours sleeping at night : General health condition : Odenton:
61.0%Maryland:
56.5%
Average condition of hearing : More about Health and Nutrition of Odenton, MD Residents
8.53% of this county's 2021 resident taxpayers lived in other counties in 2020 ($82,630 average adjusted gross income )
Here:
8.53%Maryland average:
7.42%
0.15% of residents moved from foreign countries ($1,366 average AGI )Anne Arundel County:
0.15%Maryland average:
0.05%
Top counties from which taxpayers relocated into this county between 2020 and 2021:
8.46% of this county's 2020 resident taxpayers moved to other counties in 2021 ($91,056 average adjusted gross income )
Here:
8.46%Maryland average:
7.91%
0.11% of residents moved to foreign countries ($1,325 average AGI )Anne Arundel County:
0.11%Maryland average:
0.04%
Top counties to which taxpayers relocated from this county between 2020 and 2021:
Businesses in Odenton, MD
Name Count Name Count
7-Eleven 1 H&R Block 1 Ace Hardware 1 KFC 1 Advance Auto Parts 1 Little Caesars Pizza 1 Baskin-Robbins 2 Long John Silver's 1 Blockbuster 1 McDonald's 1 CVS 1 Papa John's Pizza 1 Curves 1 Penske 1 DHL 1 Pizza Hut 1 Dairy Queen 1 Quiznos 1 Domino's Pizza 1 RadioShack 1 Dunkin Donuts 2 Rite Aid 1 Fashion Bug 1 Sears 1 FedEx 3 Subway 1 Firestone Complete Auto Care 1 U-Haul 2 GNC 1 UPS 5
Strongest AM radio stations in Odenton:
WBIS (1190 AM; 50 kW; ANNAPOLIS, MD; Owner: NATIONS RADIO, LLC)
WTEM (980 AM; 50 kW; WASHINGTON, DC; Owner: AMFM RADIO LICENSES, L.L.C.)
WCBM (680 AM; 50 kW; BALTIMORE, MD; Owner: WCBM MARYLAND, INC.)
WPGC (1580 AM; 50 kW; MORNINGSIDE, MD; Owner: INFINITY WPGC(AM), INC.)
WWLG (1370 AM; 50 kW; BALTIMORE, MD; Owner: M-10 BROADCASTING, INC.)
WBAL (1090 AM; 50 kW; BALTIMORE, MD; Owner: HEARST RADIO, INC.)
WTOP (1500 AM; 50 kW; WASHINGTON, DC; Owner: BONNEVILLE HOLDING COMPANY)
WGOP (700 AM; daytime; 25 kW; WALKERSVILLE, MD; Owner: BIRACH BROADCASTING CORPORATION)
WMET (1150 AM; 50 kW; GAITHERSBURG, MD; Owner: BELTWAY ACQUISITION CORPORATION)
WWGB (1030 AM; daytime; 50 kW; INDIAN HEAD, MD; Owner: GOOD BODY MEDIA, LLC)
WILC (900 AM; 2 kW; LAUREL, MD; Owner: ILC CORPORATION)
WNAV (1430 AM; 5 kW; ANNAPOLIS, MD; Owner: SAJAK BROADCASTING CORP.)
WUST (1120 AM; daytime; 20 kW; WASHINGTON, DC)
Strongest FM radio stations in Odenton:
WFSI (107.9 FM; ANNAPOLIS, MD; Owner: FAMILY STATIONS, INC.)
WWMX (106.5 FM; BALTIMORE, MD; Owner: INFINITY RADIO OPERATIONS INC.)
WPOC (93.1 FM; BALTIMORE, MD; Owner: CITICASTERS LICENSES, L.P.)
WIYY (97.9 FM; BALTIMORE, MD; Owner: HEARST RADIO, INC.)
WRBS (95.1 FM; BALTIMORE, MD; Owner: PETER & JOHN RADIO FELLOWSHIP, INC.)
WWDC-FM (101.1 FM; WASHINGTON, DC; Owner: AMFM RADIO LICENSES, L.L.C.)
WLIF (101.9 FM; BALTIMORE, MD; Owner: INFINITY WLIF, INC.)
WRQX (107.3 FM; WASHINGTON, DC; Owner: WMAL, INC.)
WASH (97.1 FM; WASHINGTON, DC; Owner: AMFM RADIO LICENSES, L.L.C.)
WHUR-FM (96.3 FM; WASHINGTON, DC; Owner: THE HOWARD UNIVERSITY)
WBIG-FM (100.3 FM; WASHINGTON, DC; Owner: AMFM RADIO LICENSES, L.L.C.)
WARW (94.7 FM; BETHESDA, MD; Owner: INFINITY BROADCASTING OPERATIONS, INC.)
WERQ-FM (92.3 FM; BALTIMORE, MD; Owner: RADIO ONE LICENSES, LLC)
WIHT (99.5 FM; WASHINGTON, DC; Owner: AMFM RADIO LICENSES, L.L.C.)
WWIN-FM (95.9 FM; GLEN BURNIE, MD; Owner: RADIO ONE LICENSES, LLC)
WPGC-FM (95.5 FM; MORNINGSIDE, MD; Owner: INFINITY BROADCASTING CORPORATION OF MARYLAND)
WKYS (93.9 FM; WASHINGTON, DC; Owner: RADIO ONE LICENSES, LLC)
WCSP-FM (90.1 FM; WASHINGTON, DC; Owner: NATIONAL CABLE SATELLITE CORPORATION)
WZBA (100.7 FM; WESTMINSTER, MD; Owner: SHAMROCK COMMUNICATIONS, INC.)
WHFS (99.1 FM; ANNAPOLIS, MD; Owner: INFINITY BROADCASTING OPERATIONS, INC.)
TV broadcast stations around Odenton:
WMPT (Channel 22; ANNAPOLIS, MD; Owner: MARYLAND PUBLIC BROADCASTING COMMISSION)
WBAL-TV (Channel 11; BALTIMORE, MD; Owner: WBAL HEARST-ARGYLE TV, INC. (CA CORP.))
WMAR-TV (Channel 2; BALTIMORE, MD; Owner: SCRIPPS HOWARD BROADCASTING COMPANY)
WBFF (Channel 45; BALTIMORE, MD; Owner: CHESAPEAKE TELEVISION LICENSEE, LLC)
WNUV (Channel 54; BALTIMORE, MD; Owner: BALTIMORE (WNUV-TV) LICENSEE, INC.)
WUTB (Channel 24; BALTIMORE, MD; Owner: FOX TELEVISION STATIONS, INC.)
WJZ-TV (Channel 13; BALTIMORE, MD; Owner: VIACOM INC.)
W63BP (Channel 63; ANNAPOLIS, MD; Owner: ANNAPOLIS BROADCASTING COMPANY, INC.)
WBDC-TV (Channel 50; WASHINGTON, DC; Owner: WBDC BROADCASTING, INC.)
WMPB (Channel 67; BALTIMORE, MD; Owner: MARYLAND PUBLIC BROADCASTING COMMISSION)
WJLA-TV (Channel 7; WASHINGTON, DC; Owner: ACC LICENSEE, INC.)
WUSA (Channel 9; WASHINGTON, DC; Owner: THE DETROIT NEWS, INC.)
W61BY (Channel 61; ANNAPOLIS, MD; Owner: ANNAPOLIS BROADCASTING COMPANY, INC.)
WTTG (Channel 5; WASHINGTON, DC; Owner: FOX TELEVISION STATIONS, INC.)
WETA-TV (Channel 26; WASHINGTON, DC; Owner: THE GREATER WASHINGTON ED TELECOMM. ASSOC)
WHUT-TV (Channel 32; WASHINGTON, DC; Owner: HOWARD UNIVERSITY)
WDCA (Channel 20; WASHINGTON, DC; Owner: FOX TELEVISION STATIONS, INC.)
WRC-TV (Channel 4; WASHINGTON, DC; Owner: NBC SUBSIDIARY (WRC-TV), INC.)
WZDC-LP (Channel 64; WASHINGTON, DC; Owner: ONDA CAPITAL, INC.)
WIAV-LP (Channel 58; WASHINGTON, DC; Owner: ASIAVISION, INC.)
W28BY (Channel 63; BALTIMORE, MD; Owner: INFORMATION SUPER STATION, L.L.C.)
WNVC (Channel 56; FAIRFAX, VA; Owner: COMMONWEALTH PUBLIC BROADCASTING CORPORATION)
WMDO-CA (Channel 30; WASHINGTON, DC; Owner: ENTRAVISION HOLDINGS, LLC)
National Bridge Inventory (NBI) Statistics 11 Number of bridges85ft / 25.5m Total length $799,000 Total costs240,908 Total average daily traffic15,691 Total average daily truck traffic
New bridges - historical statistics
1 1930-1939 2 1970-1979 6 1990-1999 2 2010-2019
See full National Bridge Inventory statistics for Odenton, MD
Home Mortgage Disclosure Act Aggregated Statistics For Year 2009(Based on 1 full and 3 partial tracts) A) FHA, FSA/RHS & VA B) Conventional C) Refinancings D) Home Improvement Loans F) Non-occupant Loans on G) Loans On Manufactured Number Average Value Number Average Value Number Average Value Number Average Value Number Average Value Number Average Value
LOANS ORIGINATED 177 $292,770 75 $250,430 908 $260,791 35 $119,066 40 $206,432 1 $103,250 APPLICATIONS APPROVED, NOT ACCEPTED 7 $302,034 7 $175,270 63 $289,718 3 $56,147 3 $246,967 2 $83,450 APPLICATIONS DENIED 12 $259,197 15 $235,026 233 $268,259 18 $69,191 14 $212,164 3 $71,173 APPLICATIONS WITHDRAWN 18 $293,529 12 $253,162 206 $285,122 3 $172,937 15 $231,029 0 $0 FILES CLOSED FOR INCOMPLETENESS 2 $251,995 3 $216,457 62 $249,751 1 $4,490 4 $389,632 1 $69,900
Aggregated Statistics For Year 2008(Based on 1 full and 3 partial tracts) A) FHA, FSA/RHS & VA B) Conventional C) Refinancings D) Home Improvement Loans F) Non-occupant Loans on G) Loans On Manufactured Number Average Value Number Average Value Number Average Value Number Average Value Number Average Value Number Average Value
LOANS ORIGINATED 133 $313,907 173 $260,724 518 $244,566 53 $73,087 51 $194,416 7 $81,824 APPLICATIONS APPROVED, NOT ACCEPTED 7 $337,343 20 $260,146 79 $229,841 12 $68,912 4 $202,840 6 $74,047 APPLICATIONS DENIED 16 $282,420 28 $250,678 255 $269,705 36 $73,841 19 $233,032 6 $86,630 APPLICATIONS WITHDRAWN 17 $297,049 19 $265,892 154 $264,325 11 $132,956 13 $218,552 2 $173,180 FILES CLOSED FOR INCOMPLETENESS 0 $0 6 $346,668 40 $261,534 3 $35,813 11 $240,563 1 $36,550
Aggregated Statistics For Year 2007(Based on 1 full and 3 partial tracts) A) FHA, FSA/RHS & VA B) Conventional C) Refinancings D) Home Improvement Loans F) Non-occupant Loans on G) Loans On Manufactured Number Average Value Number Average Value Number Average Value Number Average Value Number Average Value Number Average Value
LOANS ORIGINATED 61 $310,989 502 $250,842 720 $236,283 109 $105,273 104 $209,904 4 $63,100 APPLICATIONS APPROVED, NOT ACCEPTED 2 $303,255 39 $210,520 109 $213,732 23 $72,835 11 $171,632 6 $51,363 APPLICATIONS DENIED 4 $255,038 85 $231,591 426 $256,852 57 $119,675 33 $212,761 10 $58,845 APPLICATIONS WITHDRAWN 4 $235,155 46 $224,097 245 $250,639 23 $179,254 15 $183,029 0 $0 FILES CLOSED FOR INCOMPLETENESS 0 $0 10 $218,907 76 $274,098 8 $91,398 5 $262,754 0 $0
Aggregated Statistics For Year 2006(Based on 1 full and 3 partial tracts) A) FHA, FSA/RHS & VA B) Conventional C) Refinancings D) Home Improvement Loans E) Loans on Dwellings For 5+ Families F) Non-occupant Loans on G) Loans On Manufactured Number Average Value Number Average Value Number Average Value Number Average Value Number Average Value Number Average Value Number Average Value
LOANS ORIGINATED 48 $296,709 969 $218,812 1,108 $223,677 132 $111,364 0 $0 159 $190,169 6 $98,270 APPLICATIONS APPROVED, NOT ACCEPTED 0 $0 99 $215,916 149 $207,495 18 $52,647 0 $0 14 $178,421 3 $64,757 APPLICATIONS DENIED 6 $253,593 136 $219,699 461 $231,147 62 $95,309 0 $0 30 $200,421 6 $98,758 APPLICATIONS WITHDRAWN 6 $258,178 123 $232,113 361 $233,865 16 $206,032 1 $75,000 31 $210,877 0 $0 FILES CLOSED FOR INCOMPLETENESS 0 $0 22 $267,545 80 $239,839 6 $113,652 0 $0 6 $193,607 0 $0
Aggregated Statistics For Year 2005(Based on 1 full and 3 partial tracts) A) FHA, FSA/RHS & VA B) Conventional C) Refinancings D) Home Improvement Loans E) Loans on Dwellings For 5+ Families F) Non-occupant Loans on G) Loans On Manufactured Number Average Value Number Average Value Number Average Value Number Average Value Number Average Value Number Average Value Number Average Value
LOANS ORIGINATED 45 $235,764 1,478 $214,195 1,409 $211,480 144 $110,319 3 $155,627 258 $180,118 5 $54,278 APPLICATIONS APPROVED, NOT ACCEPTED 4 $177,340 107 $203,990 143 $202,609 34 $47,855 0 $0 20 $147,220 7 $59,914 APPLICATIONS DENIED 3 $220,110 189 $175,059 430 $204,915 75 $104,996 0 $0 33 $157,234 10 $50,629 APPLICATIONS WITHDRAWN 1 $271,830 167 $199,844 478 $204,682 52 $161,749 1 $181,230 31 $167,843 1 $120,340 FILES CLOSED FOR INCOMPLETENESS 0 $0 42 $208,212 72 $231,199 10 $77,122 0 $0 4 $191,765 0 $0
Aggregated Statistics For Year 2004(Based on 1 full and 3 partial tracts) A) FHA, FSA/RHS & VA B) Conventional C) Refinancings D) Home Improvement Loans E) Loans on Dwellings For 5+ Families F) Non-occupant Loans on G) Loans On Manufactured Number Average Value Number Average Value Number Average Value Number Average Value Number Average Value Number Average Value Number Average Value
LOANS ORIGINATED 107 $208,652 982 $198,503 1,266 $182,305 126 $76,692 0 $0 131 $163,189 5 $62,326 APPLICATIONS APPROVED, NOT ACCEPTED 4 $189,868 73 $187,953 155 $168,003 28 $42,092 0 $0 10 $173,940 2 $44,725 APPLICATIONS DENIED 9 $172,684 95 $184,115 404 $168,699 81 $57,779 1 $153,000 24 $119,974 3 $59,413 APPLICATIONS WITHDRAWN 12 $203,512 91 $201,412 382 $171,803 36 $81,264 0 $0 21 $146,867 2 $68,680 FILES CLOSED FOR INCOMPLETENESS 5 $193,516 15 $180,517 88 $182,971 9 $51,726 0 $0 5 $127,696 0 $0
Aggregated Statistics For Year 2003(Based on 1 full and 3 partial tracts) A) FHA, FSA/RHS & VA B) Conventional C) Refinancings D) Home Improvement Loans E) Loans on Dwellings For 5+ Families F) Non-occupant Loans on Number Average Value Number Average Value Number Average Value Number Average Value Number Average Value Number Average Value
LOANS ORIGINATED 225 $192,753 705 $176,489 2,286 $158,161 75 $22,125 1 $12,415,570 118 $127,402 APPLICATIONS APPROVED, NOT ACCEPTED 5 $208,090 58 $167,286 240 $151,102 28 $20,448 0 $0 11 $125,792 APPLICATIONS DENIED 15 $194,150 37 $135,251 419 $131,707 59 $26,147 0 $0 18 $108,386 APPLICATIONS WITHDRAWN 15 $196,755 54 $173,113 353 $151,254 6 $30,215 0 $0 14 $125,320 FILES CLOSED FOR INCOMPLETENESS 0 $0 12 $184,866 82 $149,745 3 $39,840 0 $0 2 $120,600
Aggregated Statistics For Year 2002(Based on 1 full and 3 partial tracts) A) FHA, FSA/RHS & VA B) Conventional C) Refinancings D) Home Improvement Loans F) Non-occupant Loans on Number Average Value Number Average Value Number Average Value Number Average Value Number Average Value
LOANS ORIGINATED 324 $169,838 515 $140,322 1,388 $149,374 63 $27,361 54 $115,698 APPLICATIONS APPROVED, NOT ACCEPTED 13 $160,895 28 $134,350 136 $136,730 15 $31,281 6 $127,268 APPLICATIONS DENIED 19 $155,066 31 $134,937 275 $119,594 34 $20,495 6 $124,370 APPLICATIONS WITHDRAWN 22 $168,606 32 $147,496 249 $140,655 10 $33,860 7 $89,241 FILES CLOSED FOR INCOMPLETENESS 0 $0 4 $134,555 47 $144,697 2 $42,500 2 $155,610
Aggregated Statistics For Year 2001(Based on 1 full and 3 partial tracts) A) FHA, FSA/RHS & VA B) Conventional C) Refinancings D) Home Improvement Loans F) Non-occupant Loans on Number Average Value Number Average Value Number Average Value Number Average Value Number Average Value
LOANS ORIGINATED 416 $149,833 447 $130,617 1,001 $141,813 63 $18,447 27 $102,021 APPLICATIONS APPROVED, NOT ACCEPTED 11 $134,312 31 $102,764 105 $111,190 16 $25,334 3 $117,807 APPLICATIONS DENIED 15 $158,663 57 $101,291 234 $89,821 50 $16,072 7 $86,266 APPLICATIONS WITHDRAWN 25 $155,374 50 $148,564 187 $124,738 13 $34,955 4 $185,732 FILES CLOSED FOR INCOMPLETENESS 2 $155,105 8 $86,868 43 $118,148 1 $4,840 2 $86,835
Aggregated Statistics For Year 2000(Based on 1 full and 3 partial tracts) A) FHA, FSA/RHS & VA B) Conventional C) Refinancings D) Home Improvement Loans E) Loans on Dwellings For 5+ Families F) Non-occupant Loans on Number Average Value Number Average Value Number Average Value Number Average Value Number Average Value Number Average Value
LOANS ORIGINATED 329 $139,411 351 $127,613 147 $109,787 72 $21,729 1 $4,809,750 10 $90,931 APPLICATIONS APPROVED, NOT ACCEPTED 5 $132,852 50 $93,350 46 $94,203 25 $18,390 0 $0 1 $265,000 APPLICATIONS DENIED 20 $134,908 51 $107,534 184 $70,483 48 $21,310 0 $0 4 $52,840 APPLICATIONS WITHDRAWN 27 $146,086 61 $160,971 58 $112,079 11 $23,383 0 $0 2 $68,050 FILES CLOSED FOR INCOMPLETENESS 3 $181,487 5 $186,086 11 $131,406 1 $15,540 0 $0 0 $0
Aggregated Statistics For Year 1999(Based on 1 full and 3 partial tracts) A) FHA, FSA/RHS & VA B) Conventional C) Refinancings D) Home Improvement Loans F) Non-occupant Loans on Number Average Value Number Average Value Number Average Value Number Average Value Number Average Value
LOANS ORIGINATED 356 $138,114 248 $129,291 424 $115,979 57 $21,106 19 $85,586 APPLICATIONS APPROVED, NOT ACCEPTED 9 $131,304 32 $88,858 81 $104,515 19 $18,629 1 $123,940 APPLICATIONS DENIED 15 $136,831 30 $97,348 162 $109,151 41 $24,403 5 $66,666 APPLICATIONS WITHDRAWN 28 $151,448 43 $136,826 109 $109,150 10 $90,142 7 $95,479 FILES CLOSED FOR INCOMPLETENESS 5 $161,388 4 $118,830 33 $112,767 1 $14,710 2 $108,445
Detailed HMDA statistics for the following Tracts:
7403.01
, 7407.00 , 7408.00 , 7409.00
Private Mortgage Insurance Companies Aggregated Statistics For Year 2009(Based on 1 full and 3 partial tracts) A) Conventional B) Refinancings C) Non-occupant Loans on Number Average Value Number Average Value Number Average Value
LOANS ORIGINATED 19 $298,755 23 $305,196 1 $121,850 APPLICATIONS APPROVED, NOT ACCEPTED 2 $306,380 4 $371,622 0 $0 APPLICATIONS DENIED 3 $248,037 4 $358,750 0 $0 APPLICATIONS WITHDRAWN 2 $314,260 3 $388,987 0 $0 FILES CLOSED FOR INCOMPLETENESS 0 $0 0 $0 0 $0
Aggregated Statistics For Year 2008(Based on 1 full and 3 partial tracts) A) Conventional B) Refinancings C) Non-occupant Loans on Number Average Value Number Average Value Number Average Value
LOANS ORIGINATED 52 $299,342 37 $305,698 4 $252,015 APPLICATIONS APPROVED, NOT ACCEPTED 14 $255,749 29 $303,739 4 $205,272 APPLICATIONS DENIED 5 $268,050 4 $334,282 2 $297,820 APPLICATIONS WITHDRAWN 2 $331,270 3 $367,867 1 $319,510 FILES CLOSED FOR INCOMPLETENESS 1 $245,140 1 $277,230 0 $0
Aggregated Statistics For Year 2007(Based on 1 full and 3 partial tracts) A) Conventional B) Refinancings C) Non-occupant Loans on Number Average Value Number Average Value Number Average Value
LOANS ORIGINATED 113 $296,842 69 $316,946 8 $224,376 APPLICATIONS APPROVED, NOT ACCEPTED 7 $333,647 20 $314,488 2 $336,400 APPLICATIONS DENIED 2 $328,195 2 $317,140 0 $0 APPLICATIONS WITHDRAWN 7 $280,630 7 $411,856 0 $0 FILES CLOSED FOR INCOMPLETENESS 1 $182,770 0 $0 1 $182,770
Aggregated Statistics For Year 2006(Based on 1 full and 3 partial tracts) A) Conventional B) Refinancings C) Non-occupant Loans on Number Average Value Number Average Value Number Average Value
LOANS ORIGINATED 61 $274,474 42 $315,448 3 $283,087 APPLICATIONS APPROVED, NOT ACCEPTED 10 $289,910 9 $249,181 1 $465,120 APPLICATIONS DENIED 1 $330,910 1 $248,000 0 $0 APPLICATIONS WITHDRAWN 4 $341,628 5 $302,650 0 $0 FILES CLOSED FOR INCOMPLETENESS 0 $0 1 $124,410 0 $0
Aggregated Statistics For Year 2005(Based on 1 full and 3 partial tracts) A) Conventional B) Refinancings C) Non-occupant Loans on Number Average Value Number Average Value Number Average Value
LOANS ORIGINATED 65 $284,844 43 $275,516 8 $251,689 APPLICATIONS APPROVED, NOT ACCEPTED 16 $279,969 15 $219,989 2 $107,675 APPLICATIONS DENIED 0 $0 2 $491,895 1 $157,760 APPLICATIONS WITHDRAWN 4 $248,872 4 $209,632 0 $0 FILES CLOSED FOR INCOMPLETENESS 1 $126,340 1 $224,390 0 $0
Aggregated Statistics For Year 2004(Based on 1 full and 3 partial tracts) A) Conventional B) Refinancings C) Non-occupant Loans on Number Average Value Number Average Value Number Average Value
LOANS ORIGINATED 111 $240,905 73 $212,265 14 $175,413 APPLICATIONS APPROVED, NOT ACCEPTED 19 $232,002 22 $205,996 1 $55,150 APPLICATIONS DENIED 1 $131,000 4 $167,988 2 $95,640 APPLICATIONS WITHDRAWN 2 $237,245 5 $201,352 2 $180,155 FILES CLOSED FOR INCOMPLETENESS 2 $184,780 1 $150,000 1 $42,330
Aggregated Statistics For Year 2003(Based on 1 full and 3 partial tracts) A) Conventional B) Refinancings C) Non-occupant Loans on Number Average Value Number Average Value Number Average Value
LOANS ORIGINATED 135 $192,537 139 $173,909 20 $141,152 APPLICATIONS APPROVED, NOT ACCEPTED 14 $201,066 32 $186,712 4 $148,202 APPLICATIONS DENIED 2 $139,150 1 $125,690 0 $0 APPLICATIONS WITHDRAWN 6 $200,005 10 $194,150 2 $111,005 FILES CLOSED FOR INCOMPLETENESS 0 $0 0 $0 0 $0
Aggregated Statistics For Year 2002(Based on 1 full and 3 partial tracts) A) Conventional B) Refinancings C) Non-occupant Loans on Number Average Value Number Average Value Number Average Value
LOANS ORIGINATED 94 $179,809 126 $181,657 5 $140,474 APPLICATIONS APPROVED, NOT ACCEPTED 19 $172,343 17 $169,756 3 $121,270 APPLICATIONS DENIED 2 $167,690 5 $132,606 0 $0 APPLICATIONS WITHDRAWN 7 $189,706 13 $184,734 3 $107,927 FILES CLOSED FOR INCOMPLETENESS 1 $175,000 0 $0 0 $0
Aggregated Statistics For Year 2001(Based on 1 full and 3 partial tracts) A) Conventional B) Refinancings C) Non-occupant Loans on Number Average Value Number Average Value Number Average Value
LOANS ORIGINATED 83 $176,985 77 $167,481 7 $79,093 APPLICATIONS APPROVED, NOT ACCEPTED 12 $152,015 9 $173,492 3 $87,780 APPLICATIONS DENIED 2 $151,630 2 $158,410 0 $0 APPLICATIONS WITHDRAWN 2 $177,105 3 $147,977 0 $0 FILES CLOSED FOR INCOMPLETENESS 0 $0 0 $0 0 $0
Aggregated Statistics For Year 2000(Based on 1 full and 3 partial tracts) A) Conventional B) Refinancings C) Non-occupant Loans on Number Average Value Number Average Value Number Average Value
LOANS ORIGINATED 70 $162,874 11 $133,152 4 $69,378 APPLICATIONS APPROVED, NOT ACCEPTED 14 $180,980 4 $123,830 0 $0 APPLICATIONS DENIED 3 $166,147 2 $174,330 1 $46,810 APPLICATIONS WITHDRAWN 4 $167,945 2 $228,850 1 $33,350 FILES CLOSED FOR INCOMPLETENESS 0 $0 0 $0 0 $0
Aggregated Statistics For Year 1999(Based on 1 full and 3 partial tracts) A) Conventional B) Refinancings C) Non-occupant Loans on Number Average Value Number Average Value Number Average Value
LOANS ORIGINATED 71 $169,163 45 $150,236 3 $79,530 APPLICATIONS APPROVED, NOT ACCEPTED 6 $122,640 16 $149,318 1 $70,460 APPLICATIONS DENIED 3 $130,470 1 $105,640 0 $0 APPLICATIONS WITHDRAWN 4 $180,468 1 $127,030 0 $0 FILES CLOSED FOR INCOMPLETENESS 0 $0 0 $0 0 $0
Detailed PMIC statistics for the following Tracts:
7403.01
, 7407.00 , 7408.00 , 7409.00
Most common first names in Odenton, MD among deceased individuals Name Count Lived (average)
John 62 70.6 years William 54 73.1 years Mary 54 73.6 years Robert 43 66.9 years James 43 67.2 years Charles 29 72.5 years George 26 73.1 years Joseph 22 70.5 years Ruth 21 78.9 years Elizabeth 19 82.4 years
Most common last names in Odenton, MD among deceased individuals Last name Count Lived (average)
Brown 16 73.2 years Hood 15 72.6 years Johnson 15 71.3 years Miller 14 70.8 years Clark 11 74.2 years King 10 70.0 years Meyer 9 78.3 years Smith 9 65.6 years Chaney 8 69.7 years Martin 8 71.3 years
Odenton compared to Maryland state average:
Unemployed percentage significantly below state average. Black race population percentage above state average. Hispanic race population percentage above state average. Length of stay since moving in significantly above state average. House age significantly below state average. Number of college students above state average. Percentage of population with a bachelor's degree or higher above state average.
#14 on the list of "Top 101 cities with the smallest racial income disparities between White and Black householders (with at least 2,000 householders)"
#40 on the list of "Top 101 cities with largest percentage of females in industries: public administration (population 5,000+)"
#41 on the list of "Top 101 cities with largest percentage of males in occupations: computer and mathematical occupations (population 5,000+)"
#42 on the list of "Top 101 cities with largest percentage of males in industries: public administration (population 5,000+)"
#91 on the list of "Top 101 cities with the smallest racial income disparities between White and Black householders (with at least 200 householders)"
#33 on the list of "Top 101 counties with the highest percentage of residents that visited a dentist within the past year"
#36 on the list of "Top 101 counties with the largest decrease in the number of infant deaths per 1000 residents 2000-2006 to 2007-2013 (pop. 50,000+)"
#56 on the list of "Top 101 counties with the lowest Particulate Matter (PM10 ) Annual air pollution readings in 2012 (µg/m3 )"
#59 on the list of "Top 101 counties with the best general health status score of residents (1-5), 3 years of data"
#71 on the list of "Top 101 counties with the lowest percentage of residents that keep firearms around their homes"
Top Patent Applicants
Dara Ung (16)
James E. Baumgardner (14)
Patrick Mish (11)
Adam Ashley (11)
Igor Vurgaftman (9)
Danielle N. Dickinson (7)
Russell Hester (6)
Fei Yang (5)
Russell D. Hester (4)
Xiaohui Yang (4)
Total of 184 patent applications in 2008-2025.


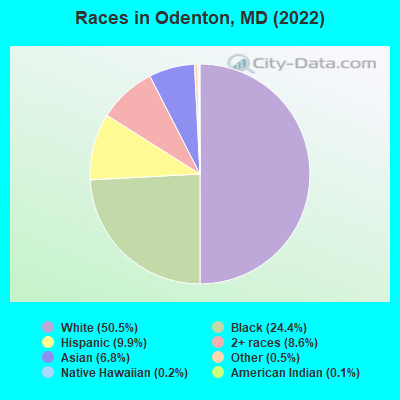
 Recent articles from our blog. Our writers, many of them Ph.D. graduates or candidates, create easy-to-read articles on a wide variety of topics.


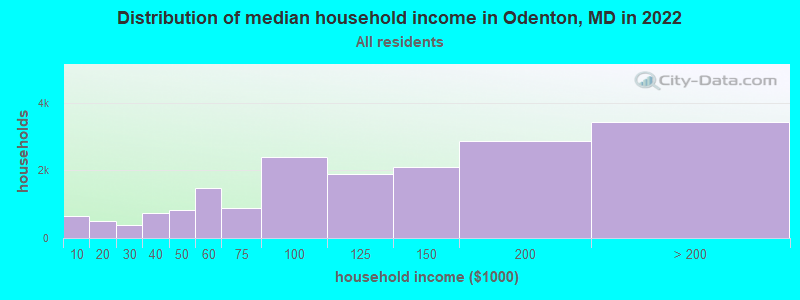
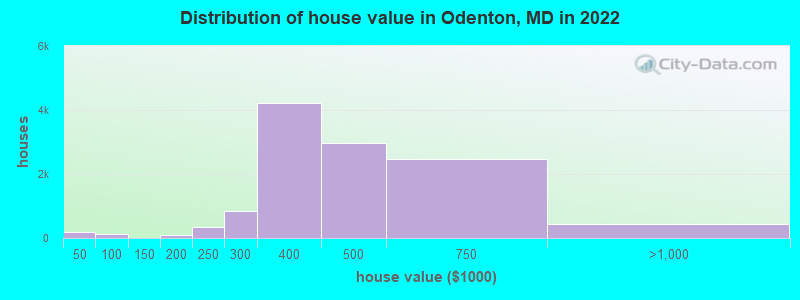

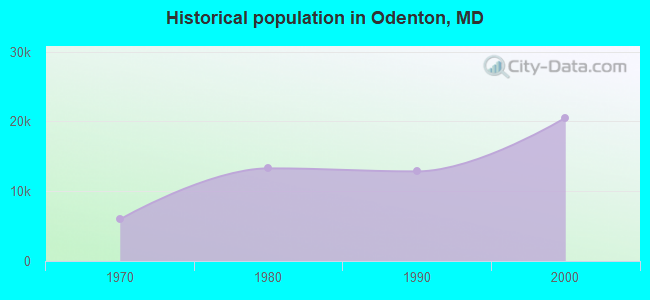
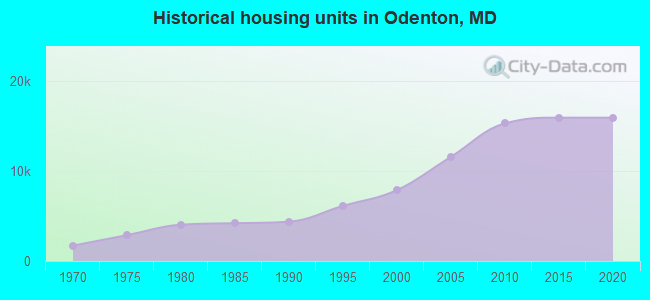


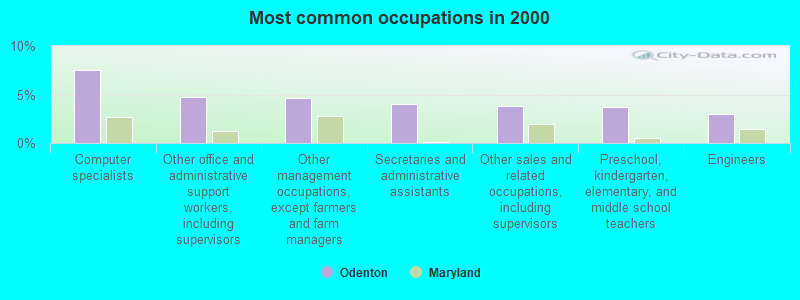
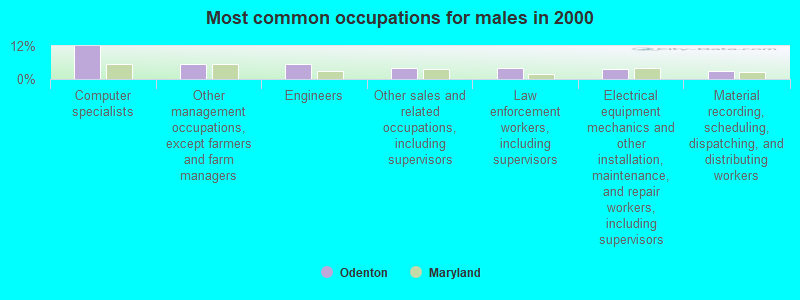
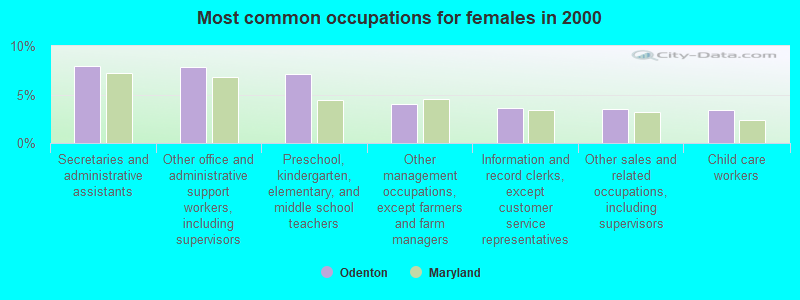


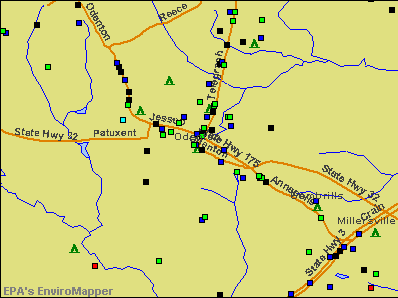

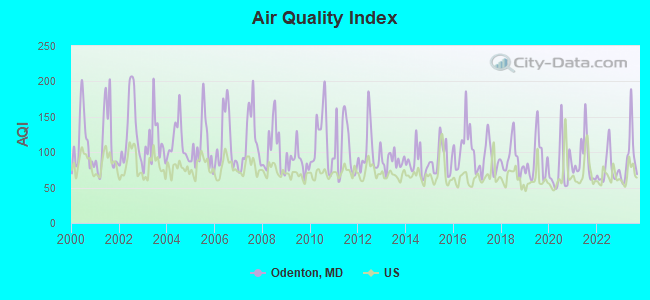
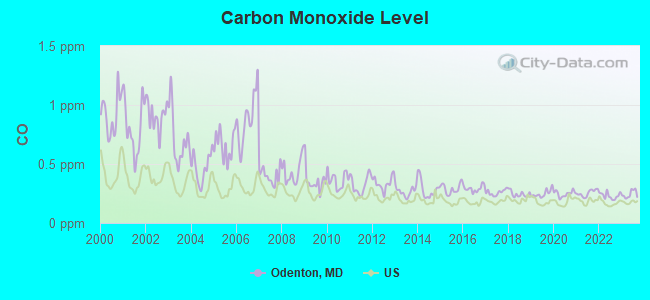
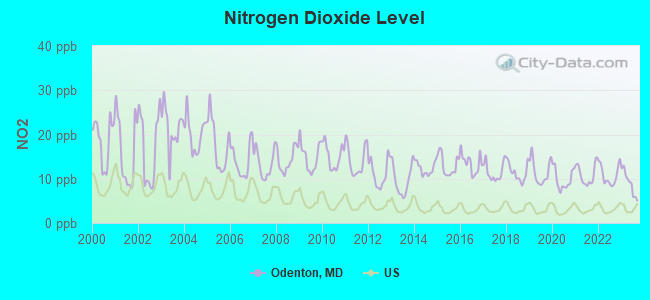
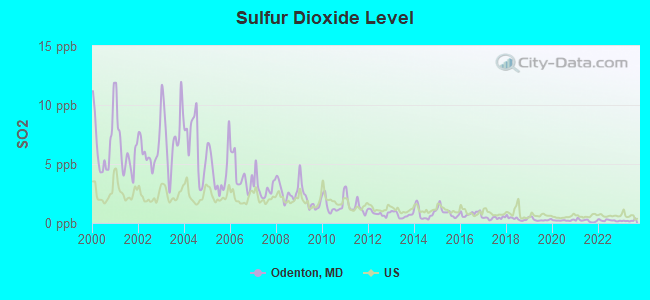
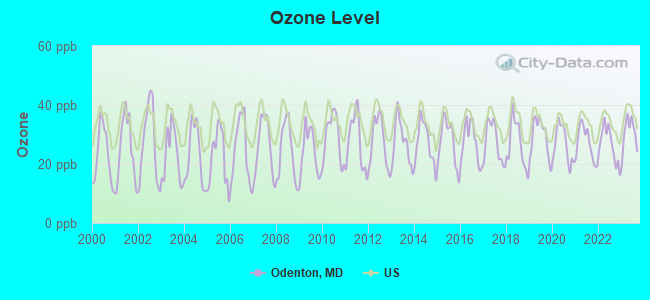

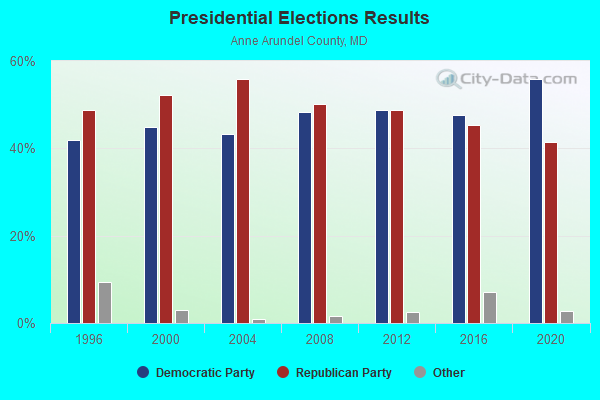
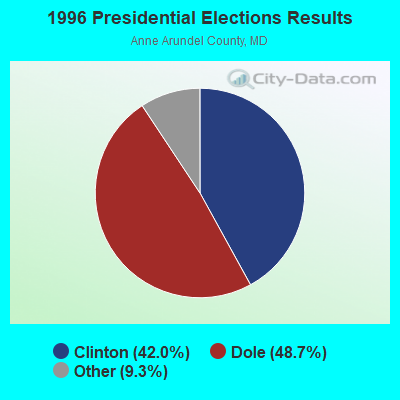
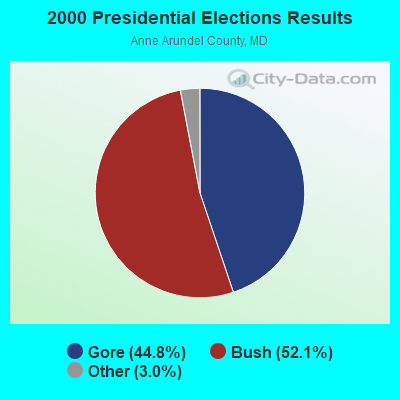
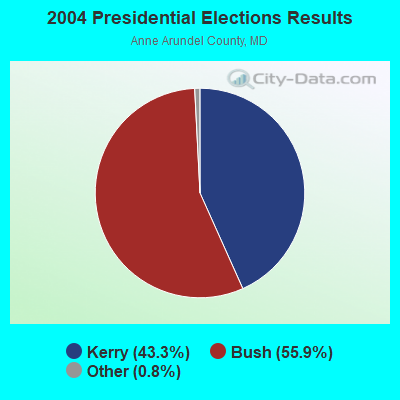
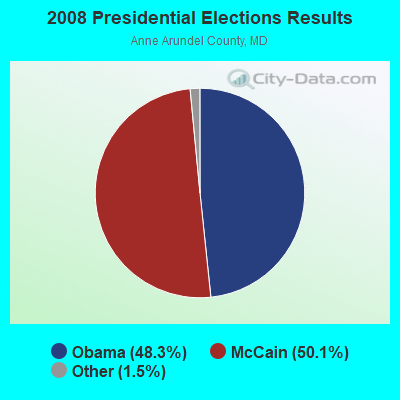
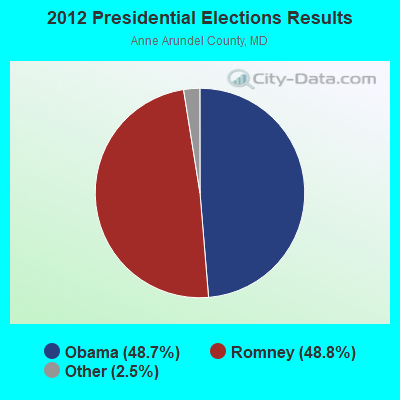
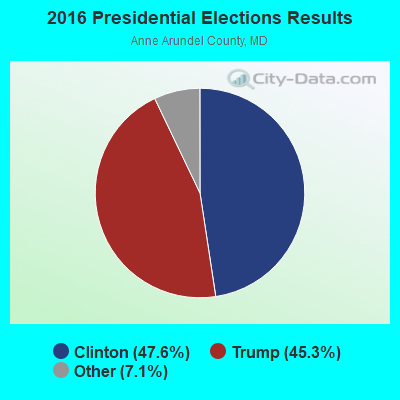
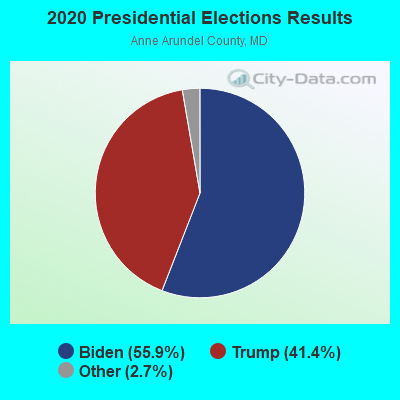

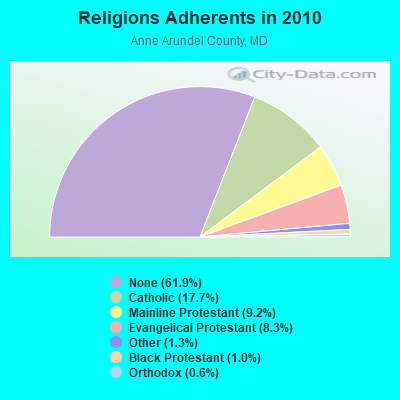
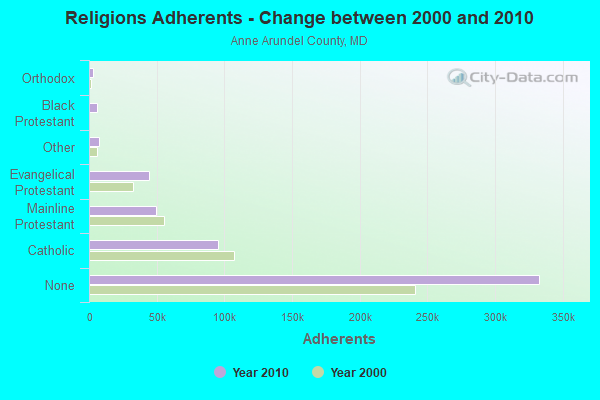
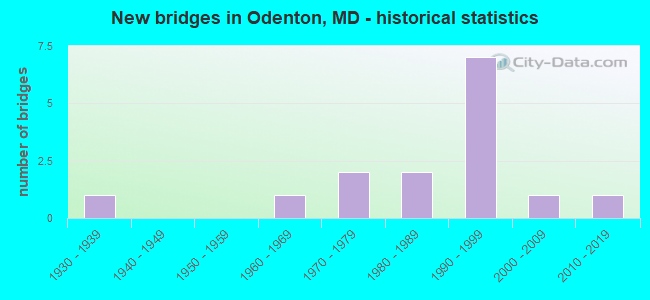
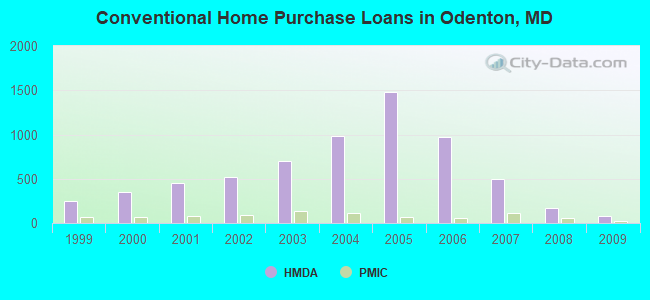
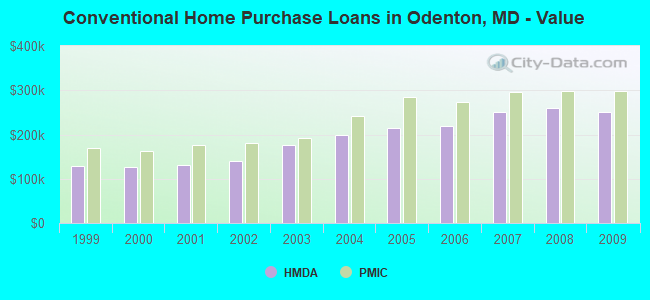
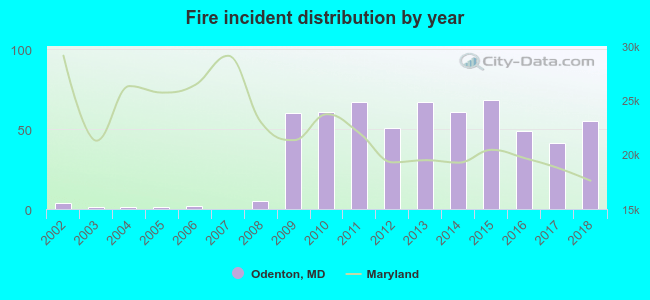 According to the data from the years 2002 - 2018 the average number of fires per year is 35. The highest number of reported fires - 68 took place in 2015, and the least - 0 in 2007. The data has a rising trend.
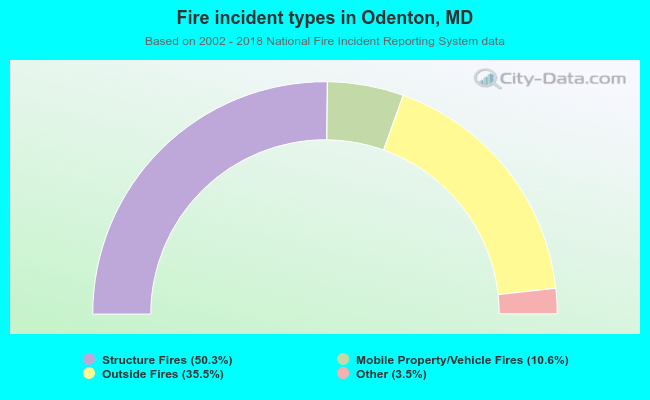 When looking into fire subcategories, the most reports belonged to: Structure Fires (50.3%), and Outside Fires (35.5%).