Palm Coast, Florida Submit your own pictures of this city and show them to the world
OSM Map
General Map
Google Map
MSN Map
OSM Map
General Map
Google Map
MSN Map
OSM Map
General Map
Google Map
MSN Map
OSM Map
General Map
Google Map
MSN Map
Please wait while loading the map...
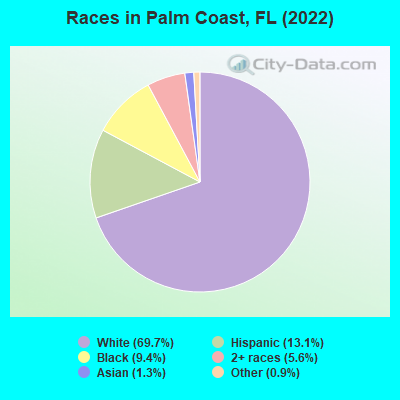
Population in 2022: 98,411 (99% urban, 1% rural). Population change since 2000: +200.7%Males: 48,678 Females: 49,733
December 2024 cost of living index in Palm Coast: 93.6 (less than average, U.S. average is 100) Percentage of residents living in poverty in 2023: 10.3%for White Non-Hispanic residents , 11.9% for Black residents , 14.2% for Hispanic or Latino residents , 17.4% for American Indian residents , 12.7% for other race residents , 11.7% for two or more races residents )
Profiles of local businesses
Business Search - 14 Million verified businesses
Data:
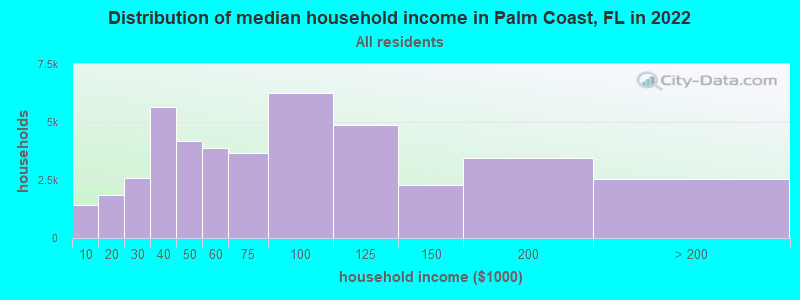
Median household income ($)
Median household income (% change since 2000)
Household income diversity
Ratio of average income to average house value (%)
Ratio of average income to average rent
Median household income ($) - White
Median household income ($) - Black or African American
Median household income ($) - Asian
Median household income ($) - Hispanic or Latino
Median household income ($) - American Indian and Alaska Native
Median household income ($) - Multirace
Median household income ($) - Other Race
Median household income for houses/condos with a mortgage ($)
Median household income for apartments without a mortgage ($)
Races - White alone (%)
Races - White alone (% change since 2000)
Races - Black alone (%)
Races - Black alone (% change since 2000)
Races - American Indian alone (%)
Races - American Indian alone (% change since 2000)
Races - Asian alone (%)
Races - Asian alone (% change since 2000)
Races - Hispanic (%)
Races - Hispanic (% change since 2000)
Races - Native Hawaiian and Other Pacific Islander alone (%)
Races - Native Hawaiian and Other Pacific Islander alone (% change since 2000)
Races - Two or more races (%)
Races - Two or more races (% change since 2000)
Races - Other race alone (%)
Races - Other race alone (% change since 2000)
Racial diversity
Unemployment (%)
Unemployment (% change since 2000)
Unemployment (%) - White
Unemployment (%) - Black or African American
Unemployment (%) - Asian
Unemployment (%) - Hispanic or Latino
Unemployment (%) - American Indian and Alaska Native
Unemployment (%) - Multirace
Unemployment (%) - Other Race
Population density (people per square mile)
Population - Males (%)
Population - Females (%)
Population - Males (%) - White
Population - Males (%) - Black or African American
Population - Males (%) - Asian
Population - Males (%) - Hispanic or Latino
Population - Males (%) - American Indian and Alaska Native
Population - Males (%) - Multirace
Population - Males (%) - Other Race
Population - Females (%) - White
Population - Females (%) - Black or African American
Population - Females (%) - Asian
Population - Females (%) - Hispanic or Latino
Population - Females (%) - American Indian and Alaska Native
Population - Females (%) - Multirace
Population - Females (%) - Other Race
Coronavirus confirmed cases (Apr 19, 2025)
Deaths caused by coronavirus (Apr 19, 2025)
Coronavirus confirmed cases (per 100k population) (Apr 19, 2025)
Deaths caused by coronavirus (per 100k population) (Apr 19, 2025)
Daily increase in number of cases (Apr 19, 2025)
Weekly increase in number of cases (Apr 19, 2025)
Cases doubled (in days) (Apr 19, 2025)
Hospitalized patients (Apr 18, 2022)
Negative test results (Apr 18, 2022)
Total test results (Apr 18, 2022)
COVID Vaccine doses distributed (per 100k population) (Sep 19, 2023)
COVID Vaccine doses administered (per 100k population) (Sep 19, 2023)
COVID Vaccine doses distributed (Sep 19, 2023)
COVID Vaccine doses administered (Sep 19, 2023)
Likely homosexual households (%)
Likely homosexual households (% change since 2000)
Likely homosexual households - Lesbian couples (%)
Likely homosexual households - Lesbian couples (% change since 2000)
Likely homosexual households - Gay men (%)
Likely homosexual households - Gay men (% change since 2000)
Cost of living index
Median gross rent ($)
Median contract rent ($)
Median monthly housing costs ($)
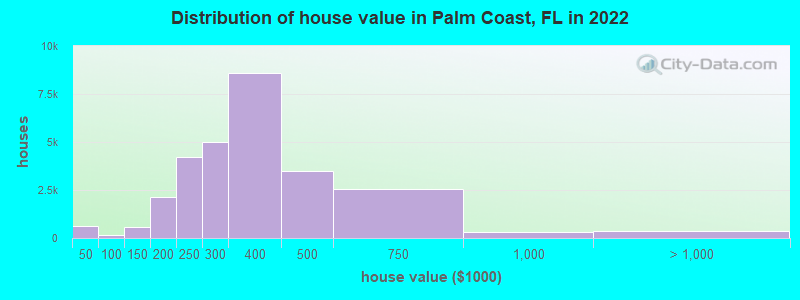
Median house or condo value ($)
Median house or condo value ($ change since 2000)
Mean house or condo value by units in structure - 1, detached ($)
Mean house or condo value by units in structure - 1, attached ($)
Mean house or condo value by units in structure - 2 ($)
Mean house or condo value by units in structure by units in structure - 3 or 4 ($)
Mean house or condo value by units in structure - 5 or more ($)
Mean house or condo value by units in structure - Boat, RV, van, etc. ($)
Mean house or condo value by units in structure - Mobile home ($)
Median house or condo value ($) - White
Median house or condo value ($) - Black or African American
Median house or condo value ($) - Asian
Median house or condo value ($) - Hispanic or Latino
Median house or condo value ($) - American Indian and Alaska Native
Median house or condo value ($) - Multirace
Median house or condo value ($) - Other Race
Median resident age
Resident age diversity
Median resident age - Males
Median resident age - Females
Median resident age - White
Median resident age - Black or African American
Median resident age - Asian
Median resident age - Hispanic or Latino
Median resident age - American Indian and Alaska Native
Median resident age - Multirace
Median resident age - Other Race
Median resident age - Males - White
Median resident age - Males - Black or African American
Median resident age - Males - Asian
Median resident age - Males - Hispanic or Latino
Median resident age - Males - American Indian and Alaska Native
Median resident age - Males - Multirace
Median resident age - Males - Other Race
Median resident age - Females - White
Median resident age - Females - Black or African American
Median resident age - Females - Asian
Median resident age - Females - Hispanic or Latino
Median resident age - Females - American Indian and Alaska Native
Median resident age - Females - Multirace
Median resident age - Females - Other Race
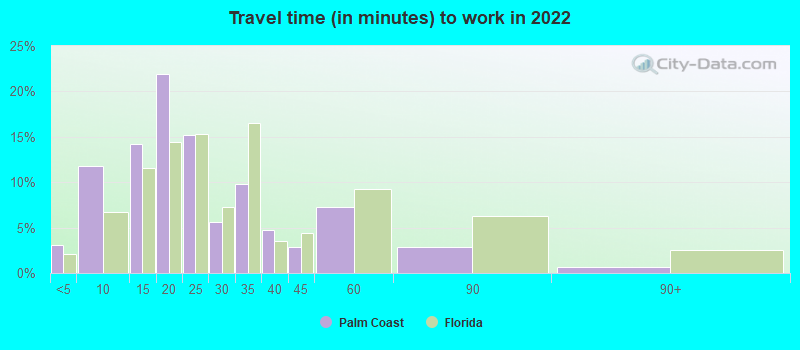
Commute - mean travel time to work (minutes)
Travel time to work - Less than 5 minutes (%)
Travel time to work - Less than 5 minutes (% change since 2000)
Travel time to work - 5 to 9 minutes (%)
Travel time to work - 5 to 9 minutes (% change since 2000)
Travel time to work - 10 to 19 minutes (%)
Travel time to work - 10 to 19 minutes (% change since 2000)
Travel time to work - 20 to 29 minutes (%)
Travel time to work - 20 to 29 minutes (% change since 2000)
Travel time to work - 30 to 39 minutes (%)
Travel time to work - 30 to 39 minutes (% change since 2000)
Travel time to work - 40 to 59 minutes (%)
Travel time to work - 40 to 59 minutes (% change since 2000)
Travel time to work - 60 to 89 minutes (%)
Travel time to work - 60 to 89 minutes (% change since 2000)
Travel time to work - 90 or more minutes (%)
Travel time to work - 90 or more minutes (% change since 2000)
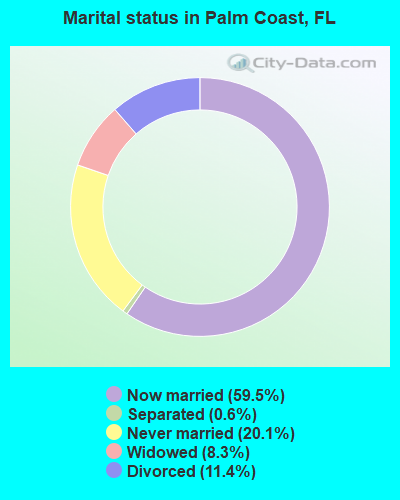
Marital status - Never married (%)
Marital status - Now married (%)
Marital status - Separated (%)
Marital status - Widowed (%)
Marital status - Divorced (%)
Median family income ($)
Median family income (% change since 2000)
Median non-family income ($)
Median non-family income (% change since 2000)
Median per capita income ($)
Median per capita income (% change since 2000)
Median family income ($) - White
Median family income ($) - Black or African American
Median family income ($) - Asian
Median family income ($) - Hispanic or Latino
Median family income ($) - American Indian and Alaska Native
Median family income ($) - Multirace
Median family income ($) - Other Race
Median year house/condo built
Median year apartment built
Year house built - Built 2005 or later (%)
Year house built - Built 2000 to 2004 (%)
Year house built - Built 1990 to 1999 (%)
Year house built - Built 1980 to 1989 (%)
Year house built - Built 1970 to 1979 (%)
Year house built - Built 1960 to 1969 (%)
Year house built - Built 1950 to 1959 (%)
Year house built - Built 1940 to 1949 (%)
Year house built - Built 1939 or earlier (%)
Average household size
Household density (households per square mile)
Average household size - White
Average household size - Black or African American
Average household size - Asian
Average household size - Hispanic or Latino
Average household size - American Indian and Alaska Native
Average household size - Multirace
Average household size - Other Race
Occupied housing units (%)
Vacant housing units (%)
Owner occupied housing units (%)
Renter occupied housing units (%)
Vacancy status - For rent (%)
Vacancy status - For sale only (%)
Vacancy status - Rented or sold, not occupied (%)
Vacancy status - For seasonal, recreational, or occasional use (%)
Vacancy status - For migrant workers (%)
Vacancy status - Other vacant (%)
Residents with income below the poverty level (%)
Residents with income below 50% of the poverty level (%)
Children below poverty level (%)
Poor families by family type - Married-couple family (%)
Poor families by family type - Male, no wife present (%)
Poor families by family type - Female, no husband present (%)
Poverty status for native-born residents (%)
Poverty status for foreign-born residents (%)
Poverty among high school graduates not in families (%)
Poverty among people who did not graduate high school not in families (%)
Residents with income below the poverty level (%) - White
Residents with income below the poverty level (%) - Black or African American
Residents with income below the poverty level (%) - Asian
Residents with income below the poverty level (%) - Hispanic or Latino
Residents with income below the poverty level (%) - American Indian and Alaska Native
Residents with income below the poverty level (%) - Multirace
Residents with income below the poverty level (%) - Other Race
Air pollution - Air Quality Index (AQI)
Air pollution - CO
Air pollution - NO2
Air pollution - SO2
Air pollution - Ozone
Air pollution - PM10
Air pollution - PM25
Air pollution - Pb
Crime - Murders per 100,000 population
Crime - Rapes per 100,000 population
Crime - Robberies per 100,000 population
Crime - Assaults per 100,000 population
Crime - Burglaries per 100,000 population
Crime - Thefts per 100,000 population
Crime - Auto thefts per 100,000 population
Crime - Arson per 100,000 population
Crime - City-data.com crime index
Crime - Violent crime index
Crime - Property crime index
Crime - Murders per 100,000 population (5 year average)
Crime - Rapes per 100,000 population (5 year average)
Crime - Robberies per 100,000 population (5 year average)
Crime - Assaults per 100,000 population (5 year average)
Crime - Burglaries per 100,000 population (5 year average)
Crime - Thefts per 100,000 population (5 year average)
Crime - Auto thefts per 100,000 population (5 year average)
Crime - Arson per 100,000 population (5 year average)
Crime - City-data.com crime index (5 year average)
Crime - Violent crime index (5 year average)
Crime - Property crime index (5 year average)
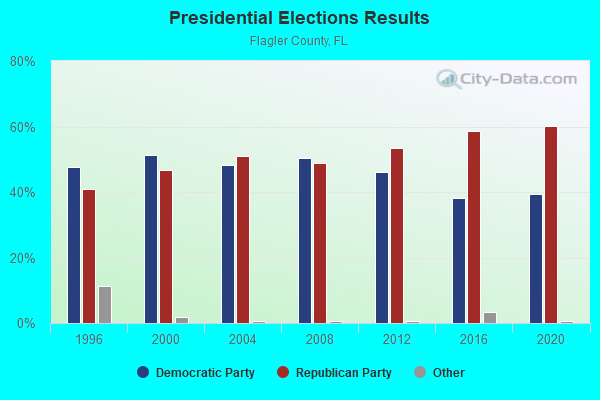
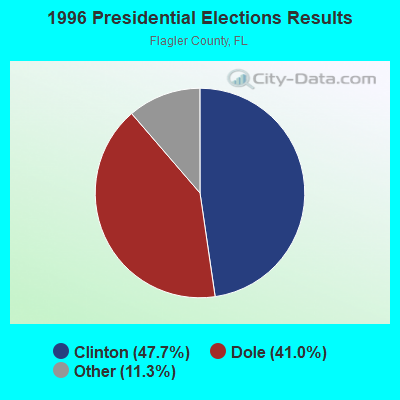
1996 Presidential Elections Results (%) - Democratic Party (Clinton)
1996 Presidential Elections Results (%) - Republican Party (Dole)
1996 Presidential Elections Results (%) - Other
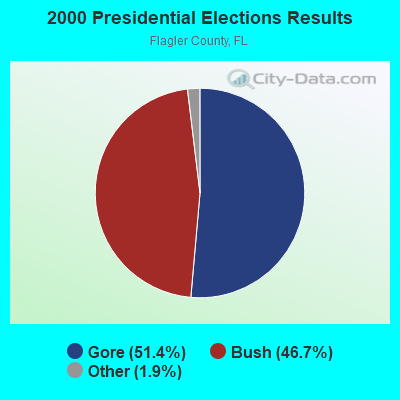
2000 Presidential Elections Results (%) - Democratic Party (Gore)
2000 Presidential Elections Results (%) - Republican Party (Bush)
2000 Presidential Elections Results (%) - Other
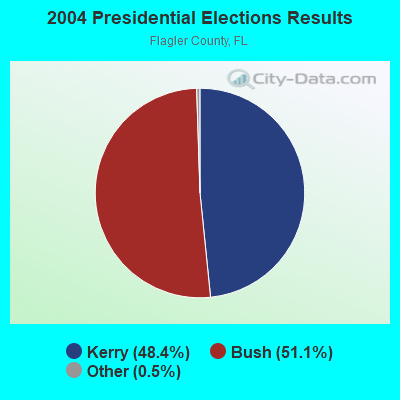
2004 Presidential Elections Results (%) - Democratic Party (Kerry)
2004 Presidential Elections Results (%) - Republican Party (Bush)
2004 Presidential Elections Results (%) - Other
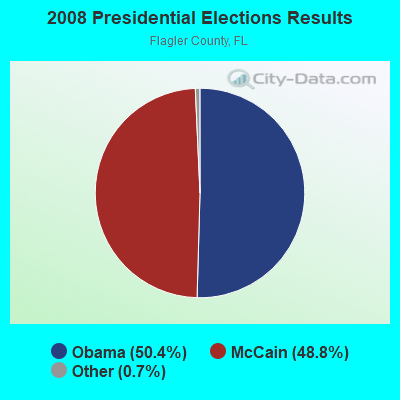
2008 Presidential Elections Results (%) - Democratic Party (Obama)
2008 Presidential Elections Results (%) - Republican Party (McCain)
2008 Presidential Elections Results (%) - Other
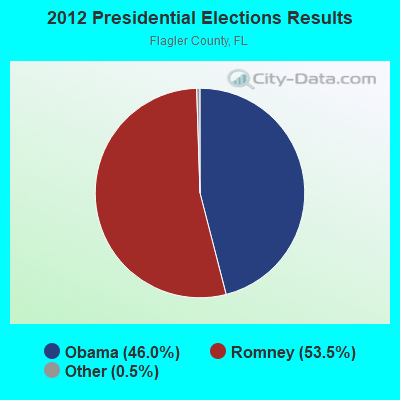
2012 Presidential Elections Results (%) - Democratic Party (Obama)
2012 Presidential Elections Results (%) - Republican Party (Romney)
2012 Presidential Elections Results (%) - Other
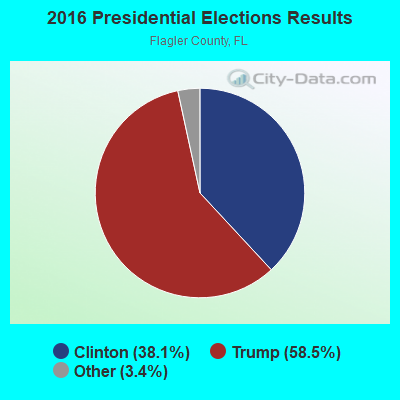
2016 Presidential Elections Results (%) - Democratic Party (Clinton)
2016 Presidential Elections Results (%) - Republican Party (Trump)
2016 Presidential Elections Results (%) - Other
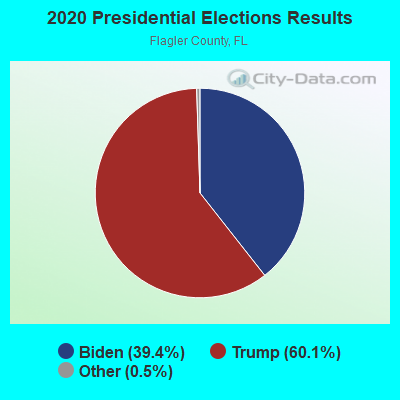
2020 Presidential Elections Results (%) - Democratic Party (Biden)
2020 Presidential Elections Results (%) - Republican Party (Trump)
2020 Presidential Elections Results (%) - Other
Ancestries Reported - Arab (%)
Ancestries Reported - Czech (%)
Ancestries Reported - Danish (%)
Ancestries Reported - Dutch (%)
Ancestries Reported - English (%)
Ancestries Reported - French (%)
Ancestries Reported - French Canadian (%)
Ancestries Reported - German (%)
Ancestries Reported - Greek (%)
Ancestries Reported - Hungarian (%)
Ancestries Reported - Irish (%)
Ancestries Reported - Italian (%)
Ancestries Reported - Lithuanian (%)
Ancestries Reported - Norwegian (%)
Ancestries Reported - Polish (%)
Ancestries Reported - Portuguese (%)
Ancestries Reported - Russian (%)
Ancestries Reported - Scotch-Irish (%)
Ancestries Reported - Scottish (%)
Ancestries Reported - Slovak (%)
Ancestries Reported - Subsaharan African (%)
Ancestries Reported - Swedish (%)
Ancestries Reported - Swiss (%)
Ancestries Reported - Ukrainian (%)
Ancestries Reported - United States (%)
Ancestries Reported - Welsh (%)
Ancestries Reported - West Indian (%)
Ancestries Reported - Other (%)
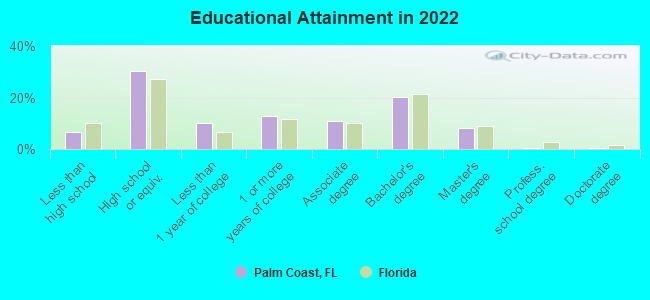
Educational Attainment - No schooling completed (%)
Educational Attainment - Less than high school (%)
Educational Attainment - High school or equivalent (%)
Educational Attainment - Less than 1 year of college (%)
Educational Attainment - 1 or more years of college (%)
Educational Attainment - Associate degree (%)
Educational Attainment - Bachelor's degree (%)
Educational Attainment - Master's degree (%)
Educational Attainment - Professional school degree (%)
Educational Attainment - Doctorate degree (%)
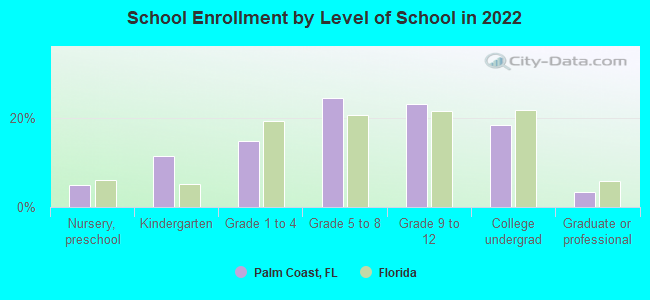
School Enrollment - Nursery, preschool (%)
School Enrollment - Kindergarten (%)
School Enrollment - Grade 1 to 4 (%)
School Enrollment - Grade 5 to 8 (%)
School Enrollment - Grade 9 to 12 (%)
School Enrollment - College undergrad (%)
School Enrollment - Graduate or professional (%)
School Enrollment - Not enrolled in school (%)
School enrollment - Public schools (%)
School enrollment - Private schools (%)
School enrollment - Not enrolled (%)
Median number of rooms in houses and condos
Median number of rooms in apartments
Housing units lacking complete plumbing facilities (%)
Housing units lacking complete kitchen facilities (%)
Density of houses
Urban houses (%)
Rural houses (%)
Households with people 60 years and over (%)
Households with people 65 years and over (%)
Households with people 75 years and over (%)
Households with one or more nonrelatives (%)
Households with no nonrelatives (%)
Population in households (%)
Family households (%)
Nonfamily households (%)
Population in families (%)
Family households with own children (%)
Median number of bedrooms in owner occupied houses
Mean number of bedrooms in owner occupied houses
Median number of bedrooms in renter occupied houses
Mean number of bedrooms in renter occupied houses
Median number of vehichles in owner occupied houses
Mean number of vehichles in owner occupied houses
Median number of vehichles in renter occupied houses
Mean number of vehichles in renter occupied houses
Mortgage status - with mortgage (%)
Mortgage status - with second mortgage (%)
Mortgage status - with home equity loan (%)
Mortgage status - with both second mortgage and home equity loan (%)
Mortgage status - without a mortgage (%)
Average family size
Average family size - White
Average family size - Black or African American
Average family size - Asian
Average family size - Hispanic or Latino
Average family size - American Indian and Alaska Native
Average family size - Multirace
Average family size - Other Race
Geographical mobility - Same house 1 year ago (%)
Geographical mobility - Moved within same county (%)
Geographical mobility - Moved from different county within same state (%)
Geographical mobility - Moved from different state (%)
Geographical mobility - Moved from abroad (%)
Place of birth - Born in state of residence (%)
Place of birth - Born in other state (%)
Place of birth - Native, outside of US (%)
Place of birth - Foreign born (%)
Housing units in structures - 1, detached (%)
Housing units in structures - 1, attached (%)
Housing units in structures - 2 (%)
Housing units in structures - 3 or 4 (%)
Housing units in structures - 5 to 9 (%)
Housing units in structures - 10 to 19 (%)
Housing units in structures - 20 to 49 (%)
Housing units in structures - 50 or more (%)
Housing units in structures - Mobile home (%)
Housing units in structures - Boat, RV, van, etc. (%)
House/condo owner moved in on average (years ago)
Renter moved in on average (years ago)
Year householder moved into unit - Moved in 1999 to March 2000 (%)
Year householder moved into unit - Moved in 1995 to 1998 (%)
Year householder moved into unit - Moved in 1990 to 1994 (%)
Year householder moved into unit - Moved in 1980 to 1989 (%)
Year householder moved into unit - Moved in 1970 to 1979 (%)
Year householder moved into unit - Moved in 1969 or earlier (%)
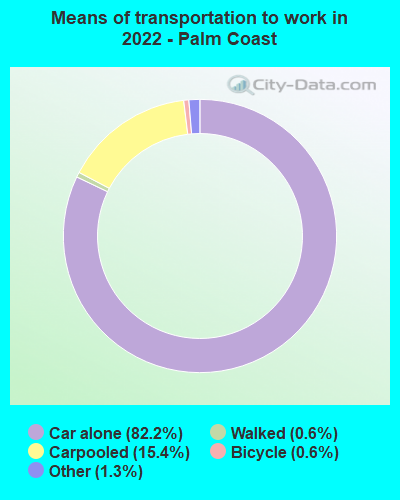
Means of transportation to work - Drove car alone (%)
Means of transportation to work - Carpooled (%)
Means of transportation to work - Public transportation (%)
Means of transportation to work - Bus or trolley bus (%)
Means of transportation to work - Streetcar or trolley car (%)
Means of transportation to work - Subway or elevated (%)
Means of transportation to work - Railroad (%)
Means of transportation to work - Ferryboat (%)
Means of transportation to work - Taxicab (%)
Means of transportation to work - Motorcycle (%)
Means of transportation to work - Bicycle (%)
Means of transportation to work - Walked (%)
Means of transportation to work - Other means (%)
Working at home (%)
Industry diversity
Most Common Industries - Agriculture, forestry, fishing and hunting, and mining (%)
Most Common Industries - Agriculture, forestry, fishing and hunting (%)
Most Common Industries - Mining, quarrying, and oil and gas extraction (%)
Most Common Industries - Construction (%)
Most Common Industries - Manufacturing (%)
Most Common Industries - Wholesale trade (%)
Most Common Industries - Retail trade (%)
Most Common Industries - Transportation and warehousing, and utilities (%)
Most Common Industries - Transportation and warehousing (%)
Most Common Industries - Utilities (%)
Most Common Industries - Information (%)
Most Common Industries - Finance and insurance, and real estate and rental and leasing (%)
Most Common Industries - Finance and insurance (%)
Most Common Industries - Real estate and rental and leasing (%)
Most Common Industries - Professional, scientific, and management, and administrative and waste management services (%)
Most Common Industries - Professional, scientific, and technical services (%)
Most Common Industries - Management of companies and enterprises (%)
Most Common Industries - Administrative and support and waste management services (%)
Most Common Industries - Educational services, and health care and social assistance (%)
Most Common Industries - Educational services (%)
Most Common Industries - Health care and social assistance (%)
Most Common Industries - Arts, entertainment, and recreation, and accommodation and food services (%)
Most Common Industries - Arts, entertainment, and recreation (%)
Most Common Industries - Accommodation and food services (%)
Most Common Industries - Other services, except public administration (%)
Most Common Industries - Public administration (%)
Occupation diversity
Most Common Occupations - Management, business, science, and arts occupations (%)
Most Common Occupations - Management, business, and financial occupations (%)
Most Common Occupations - Management occupations (%)
Most Common Occupations - Business and financial operations occupations (%)
Most Common Occupations - Computer, engineering, and science occupations (%)
Most Common Occupations - Computer and mathematical occupations (%)
Most Common Occupations - Architecture and engineering occupations (%)
Most Common Occupations - Life, physical, and social science occupations (%)
Most Common Occupations - Education, legal, community service, arts, and media occupations (%)
Most Common Occupations - Community and social service occupations (%)
Most Common Occupations - Legal occupations (%)
Most Common Occupations - Education, training, and library occupations (%)
Most Common Occupations - Arts, design, entertainment, sports, and media occupations (%)
Most Common Occupations - Healthcare practitioners and technical occupations (%)
Most Common Occupations - Health diagnosing and treating practitioners and other technical occupations (%)
Most Common Occupations - Health technologists and technicians (%)
Most Common Occupations - Service occupations (%)
Most Common Occupations - Healthcare support occupations (%)
Most Common Occupations - Protective service occupations (%)
Most Common Occupations - Fire fighting and prevention, and other protective service workers including supervisors (%)
Most Common Occupations - Law enforcement workers including supervisors (%)
Most Common Occupations - Food preparation and serving related occupations (%)
Most Common Occupations - Building and grounds cleaning and maintenance occupations (%)
Most Common Occupations - Personal care and service occupations (%)
Most Common Occupations - Sales and office occupations (%)
Most Common Occupations - Sales and related occupations (%)
Most Common Occupations - Office and administrative support occupations (%)
Most Common Occupations - Natural resources, construction, and maintenance occupations (%)
Most Common Occupations - Farming, fishing, and forestry occupations (%)
Most Common Occupations - Construction and extraction occupations (%)
Most Common Occupations - Installation, maintenance, and repair occupations (%)
Most Common Occupations - Production, transportation, and material moving occupations (%)
Most Common Occupations - Production occupations (%)
Most Common Occupations - Transportation occupations (%)
Most Common Occupations - Material moving occupations (%)
People in Group quarters - Institutionalized population (%)
People in Group quarters - Correctional institutions (%)
People in Group quarters - Federal prisons and detention centers (%)
People in Group quarters - Halfway houses (%)
People in Group quarters - Local jails and other confinement facilities (including police lockups) (%)
People in Group quarters - Military disciplinary barracks (%)
People in Group quarters - State prisons (%)
People in Group quarters - Other types of correctional institutions (%)
People in Group quarters - Nursing homes (%)
People in Group quarters - Hospitals/wards, hospices, and schools for the handicapped (%)
People in Group quarters - Hospitals/wards and hospices for chronically ill (%)
People in Group quarters - Hospices or homes for chronically ill (%)
People in Group quarters - Military hospitals or wards for chronically ill (%)
People in Group quarters - Other hospitals or wards for chronically ill (%)
People in Group quarters - Hospitals or wards for drug/alcohol abuse (%)
People in Group quarters - Mental (Psychiatric) hospitals or wards (%)
People in Group quarters - Schools, hospitals, or wards for the mentally retarded (%)
People in Group quarters - Schools, hospitals, or wards for the physically handicapped (%)
People in Group quarters - Institutions for the deaf (%)
People in Group quarters - Institutions for the blind (%)
People in Group quarters - Orthopedic wards and institutions for the physically handicapped (%)
People in Group quarters - Wards in general hospitals for patients who have no usual home elsewhere (%)
People in Group quarters - Wards in military hospitals for patients who have no usual home elsewhere (%)
People in Group quarters - Juvenile institutions (%)
People in Group quarters - Long-term care (%)
People in Group quarters - Homes for abused, dependent, and neglected children (%)
People in Group quarters - Residential treatment centers for emotionally disturbed children (%)
People in Group quarters - Training schools for juvenile delinquents (%)
People in Group quarters - Short-term care, detention or diagnostic centers for delinquent children (%)
People in Group quarters - Type of juvenile institution unknown (%)
People in Group quarters - Noninstitutionalized population (%)
People in Group quarters - College dormitories (includes college quarters off campus) (%)
People in Group quarters - Military quarters (%)
People in Group quarters - On base (%)
People in Group quarters - Barracks, unaccompanied personnel housing (UPH), (Enlisted/Officer), ;and similar group living quarters for military personnel (%)
People in Group quarters - Transient quarters for temporary residents (%)
People in Group quarters - Military ships (%)
People in Group quarters - Group homes (%)
People in Group quarters - Homes or halfway houses for drug/alcohol abuse (%)
People in Group quarters - Homes for the mentally ill (%)
People in Group quarters - Homes for the mentally retarded (%)
People in Group quarters - Homes for the physically handicapped (%)
People in Group quarters - Other group homes (%)
People in Group quarters - Religious group quarters (%)
People in Group quarters - Dormitories (%)
People in Group quarters - Agriculture workers' dormitories on farms (%)
People in Group quarters - Job Corps and vocational training facilities (%)
People in Group quarters - Other workers' dormitories (%)
People in Group quarters - Crews of maritime vessels (%)
People in Group quarters - Other nonhousehold living situations (%)
People in Group quarters - Other noninstitutional group quarters (%)
Residents speaking English at home (%)
Residents speaking English at home - Born in the United States (%)
Residents speaking English at home - Native, born elsewhere (%)
Residents speaking English at home - Foreign born (%)
Residents speaking Spanish at home (%)
Residents speaking Spanish at home - Born in the United States (%)
Residents speaking Spanish at home - Native, born elsewhere (%)
Residents speaking Spanish at home - Foreign born (%)
Residents speaking other language at home (%)
Residents speaking other language at home - Born in the United States (%)
Residents speaking other language at home - Native, born elsewhere (%)
Residents speaking other language at home - Foreign born (%)
Class of Workers - Employee of private company (%)
Class of Workers - Self-employed in own incorporated business (%)
Class of Workers - Private not-for-profit wage and salary workers (%)
Class of Workers - Local government workers (%)
Class of Workers - State government workers (%)
Class of Workers - Federal government workers (%)
Class of Workers - Self-employed workers in own not incorporated business and Unpaid family workers (%)
House heating fuel used in houses and condos - Utility gas (%)
House heating fuel used in houses and condos - Bottled, tank, or LP gas (%)
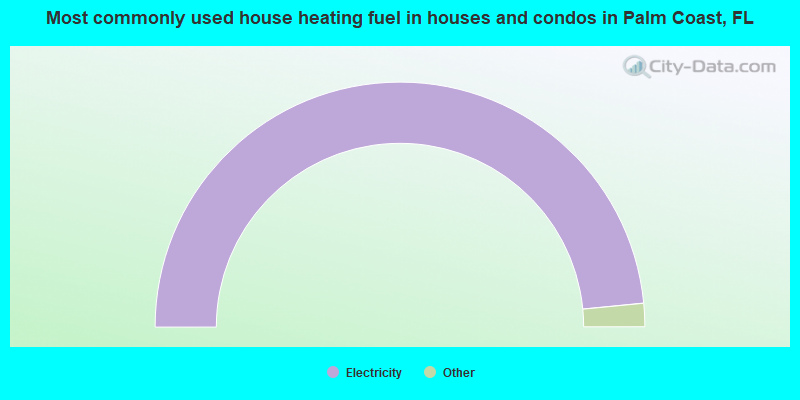
House heating fuel used in houses and condos - Electricity (%)
House heating fuel used in houses and condos - Fuel oil, kerosene, etc. (%)
House heating fuel used in houses and condos - Coal or coke (%)
House heating fuel used in houses and condos - Wood (%)
House heating fuel used in houses and condos - Solar energy (%)
House heating fuel used in houses and condos - Other fuel (%)
House heating fuel used in houses and condos - No fuel used (%)
House heating fuel used in apartments - Utility gas (%)
House heating fuel used in apartments - Bottled, tank, or LP gas (%)
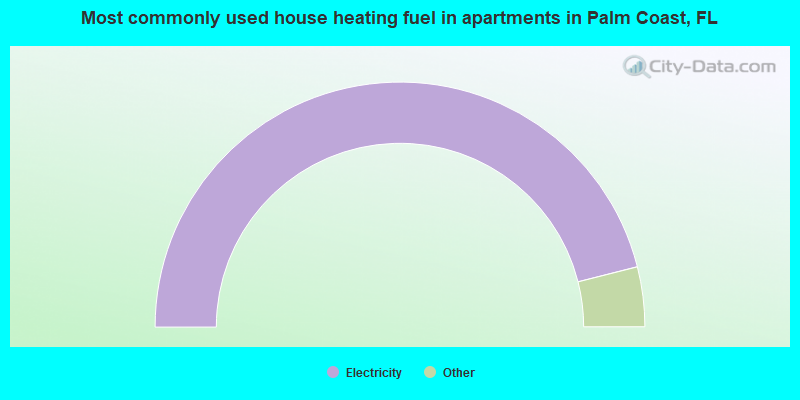
House heating fuel used in apartments - Electricity (%)
House heating fuel used in apartments - Fuel oil, kerosene, etc. (%)
House heating fuel used in apartments - Coal or coke (%)
House heating fuel used in apartments - Wood (%)
House heating fuel used in apartments - Solar energy (%)
House heating fuel used in apartments - Other fuel (%)
House heating fuel used in apartments - No fuel used (%)
Armed forces status - In Armed Forces (%)
Armed forces status - Civilian (%)
Armed forces status - Civilian - Veteran (%)
Armed forces status - Civilian - Nonveteran (%)
Read more: https://www.city-data.com/accidents/acc-Addison-Illinois.html
Fatal accidents locations in years 2005-2022
Fatal accidents locations in 2022
Fatal accidents locations in 2021
Fatal accidents locations in 2020
Fatal accidents locations in 2019
Fatal accidents locations in 2018
Fatal accidents locations in 2017
Fatal accidents locations in 2016
Fatal accidents locations in 2015
Fatal accidents locations in 2014
Fatal accidents locations in 2013
Fatal accidents locations in 2012
Fatal accidents locations in 2011
Fatal accidents locations in 2010
Fatal accidents locations in 2009
Fatal accidents locations in 2008
Fatal accidents locations in 2007
Fatal accidents locations in 2006
Fatal accidents locations in 2005
Alcohol use - People drinking some alcohol every month (%)
Alcohol use - People not drinking at all (%)
Alcohol use - Average days/month drinking alcohol
Alcohol use - Average drinks/week
Alcohol use - Average days/year people drink much
Audiometry - Average condition of hearing (%)
Audiometry - People that can hear a whisper from across a quiet room (%)
Audiometry - People that can hear normal voice from across a quiet room (%)
Audiometry - Ears ringing, roaring, buzzing (%)
Audiometry - Had a job exposure to loud noise (%)
Audiometry - Had off-work exposure to loud noise (%)
Blood Pressure & Cholesterol - Has high blood pressure (%)
Blood Pressure & Cholesterol - Checking blood pressure at home (%)
Blood Pressure & Cholesterol - Frequently checking blood cholesterol (%)
Blood Pressure & Cholesterol - Has high cholesterol level (%)
Consumer Behavior - Money monthly spent on food at supermarket/grocery store
Consumer Behavior - Money monthly spent on food at other stores
Consumer Behavior - Money monthly spent on eating out
Consumer Behavior - Money monthly spent on carryout/delivered foods
Consumer Behavior - Income spent on food at supermarket/grocery store (%)
Consumer Behavior - Income spent on food at other stores (%)
Consumer Behavior - Income spent on eating out (%)
Consumer Behavior - Income spent on carryout/delivered foods (%)
Current Health Status - General health condition (%)
Current Health Status - Blood donors (%)
Current Health Status - Has blood ever tested for HIV virus (%)
Current Health Status - Left-handed people (%)
Dermatology - People using sunscreen (%)
Diabetes - Diabetics (%)
Diabetes - Had a blood test for high blood sugar (%)
Diabetes - People taking insulin (%)
Diet Behavior & Nutrition - Diet health (%)
Diet Behavior & Nutrition - Milk product consumption (# of products/month)
Diet Behavior & Nutrition - Meals not home prepared (#/week)
Diet Behavior & Nutrition - Meals from fast food or pizza place (#/week)
Diet Behavior & Nutrition - Ready-to-eat foods (#/month)
Diet Behavior & Nutrition - Frozen meals/pizza (#/month)
Drug Use - People that ever used marijuana or hashish (%)
Drug Use - Ever used hard drugs (%)
Drug Use - Ever used any form of cocaine (%)
Drug Use - Ever used heroin (%)
Drug Use - Ever used methamphetamine (%)
Health Insurance - People covered by health insurance (%)
Kidney Conditions-Urology - Avg. # of times urinating at night
Medical Conditions - People with asthma (%)
Medical Conditions - People with anemia (%)
Medical Conditions - People with psoriasis (%)
Medical Conditions - People with overweight (%)
Medical Conditions - Elderly people having difficulties in thinking or remembering (%)
Medical Conditions - People who ever received blood transfusion (%)
Medical Conditions - People having trouble seeing even with glass/contacts (%)
Medical Conditions - People with arthritis (%)
Medical Conditions - People with gout (%)
Medical Conditions - People with congestive heart failure (%)
Medical Conditions - People with coronary heart disease (%)
Medical Conditions - People with angina pectoris (%)
Medical Conditions - People who ever had heart attack (%)
Medical Conditions - People who ever had stroke (%)
Medical Conditions - People with emphysema (%)
Medical Conditions - People with thyroid problem (%)
Medical Conditions - People with chronic bronchitis (%)
Medical Conditions - People with any liver condition (%)
Medical Conditions - People who ever had cancer or malignancy (%)
Mental Health - People who have little interest in doing things (%)
Mental Health - People feeling down, depressed, or hopeless (%)
Mental Health - People who have trouble sleeping or sleeping too much (%)
Mental Health - People feeling tired or having little energy (%)
Mental Health - People with poor appetite or overeating (%)
Mental Health - People feeling bad about themself (%)
Mental Health - People who have trouble concentrating on things (%)
Mental Health - People moving or speaking slowly or too fast (%)
Mental Health - People having thoughts they would be better off dead (%)
Oral Health - Average years since last visit a dentist
Oral Health - People embarrassed because of mouth (%)
Oral Health - People with gum disease (%)
Oral Health - General health of teeth and gums (%)
Oral Health - Average days a week using dental floss/device
Oral Health - Average days a week using mouthwash for dental problem
Oral Health - Average number of teeth
Pesticide Use - Households using pesticides to control insects (%)
Pesticide Use - Households using pesticides to kill weeds (%)
Physical Activity - People doing vigorous-intensity work activities (%)
Physical Activity - People doing moderate-intensity work activities (%)
Physical Activity - People walking or bicycling (%)
Physical Activity - People doing vigorous-intensity recreational activities (%)
Physical Activity - People doing moderate-intensity recreational activities (%)
Physical Activity - Average hours a day doing sedentary activities
Physical Activity - Average hours a day watching TV or videos
Physical Activity - Average hours a day using computer
Physical Functioning - People having limitations keeping them from working (%)
Physical Functioning - People limited in amount of work they can do (%)
Physical Functioning - People that need special equipment to walk (%)
Physical Functioning - People experiencing confusion/memory problems (%)
Physical Functioning - People requiring special healthcare equipment (%)
Prescription Medications - Average number of prescription medicines taking
Preventive Aspirin Use - Adults 40+ taking low-dose aspirin (%)
Reproductive Health - Vaginal deliveries (%)
Reproductive Health - Cesarean deliveries (%)
Reproductive Health - Deliveries resulted in a live birth (%)
Reproductive Health - Pregnancies resulted in a delivery (%)
Reproductive Health - Women breastfeeding newborns (%)
Reproductive Health - Women that had a hysterectomy (%)
Reproductive Health - Women that had both ovaries removed (%)
Reproductive Health - Women that have ever taken birth control pills (%)
Reproductive Health - Women taking birth control pills (%)
Reproductive Health - Women that have ever used Depo-Provera or injectables (%)
Reproductive Health - Women that have ever used female hormones (%)
Sexual Behavior - People 18+ that ever had sex (vaginal, anal, or oral) (%)
Sexual Behavior - Males 18+ that ever had vaginal sex with a woman (%)
Sexual Behavior - Males 18+ that ever performed oral sex on a woman (%)
Sexual Behavior - Males 18+ that ever had anal sex with a woman (%)
Sexual Behavior - Males 18+ that ever had any sex with a man (%)
Sexual Behavior - Females 18+ that ever had vaginal sex with a man (%)
Sexual Behavior - Females 18+ that ever performed oral sex on a man (%)
Sexual Behavior - Females 18+ that ever had anal sex with a man (%)
Sexual Behavior - Females 18+ that ever had any kind of sex with a woman (%)
Sexual Behavior - Average age people first had sex
Sexual Behavior - Average number of female sex partners in lifetime (males 18+)
Sexual Behavior - Average number of female vaginal sex partners in lifetime (males 18+)
Sexual Behavior - Average age people first performed oral sex on a woman (18+)
Sexual Behavior - Average number of woman performed oral sex on in lifetime (18+)
Sexual Behavior - Average number of male sex partners in lifetime (males 18+)
Sexual Behavior - Average number of male anal sex partners in lifetime (males 18+)
Sexual Behavior - Average age people first performed oral sex on a man (18+)
Sexual Behavior - Average number of male oral sex partners in lifetime (18+)
Sexual Behavior - People using protection when performing oral sex (%)
Sexual Behavior - Average number of times people have vaginal or anal sex a year
Sexual Behavior - People having sex without condom (%)
Sexual Behavior - Average number of male sex partners in lifetime (females 18+)
Sexual Behavior - Average number of male vaginal sex partners in lifetime (females 18+)
Sexual Behavior - Average number of female sex partners in lifetime (females 18+)
Sexual Behavior - Circumcised males 18+ (%)
Sleep Disorders - Average hours sleeping at night
Sleep Disorders - People that has trouble sleeping (%)
Smoking-Cigarette Use - People smoking cigarettes (%)
Taste & Smell - People 40+ having problems with smell (%)
Taste & Smell - People 40+ having problems with taste (%)
Taste & Smell - People 40+ that ever had wisdom teeth removed (%)
Taste & Smell - People 40+ that ever had tonsils teeth removed (%)
Taste & Smell - People 40+ that ever had a loss of consciousness because of a head injury (%)
Taste & Smell - People 40+ that ever had a broken nose or other serious injury to face or skull (%)
Taste & Smell - People 40+ that ever had two or more sinus infections (%)
Weight - Average height (inches)
Weight - Average weight (pounds)
Weight - Average BMI
Weight - People that are obese (%)
Weight - People that ever were obese (%)
Weight - People trying to lose weight (%)
According to our research of Florida and other state lists, there were 96 registered sex offenders living in Palm Coast, Florida as of April 19, 2025 . The ratio of all residents to sex offenders in Palm Coast is 872 to 1.The ratio of registered sex offenders to all residents in this city is lower than the state average.
Latest news from Palm Coast, FL collected exclusively by city-data.com from local newspapers, TV, and radio stations
Ancestries: American (17.3%), Italian (9.3%), Irish (7.2%), English (7.0%), German (5.0%), Portuguese (3.7%).
Current Local Time:
Land area: 50.7 square miles.
Population density: 1,940 people per square mile (low).
15,206 residents are foreign born (6.5% Latin America , 5.7% Europe , 2.5% Asia ).
This city:
14.9%Florida:
21.4%
Median real estate property taxes paid for housing units with mortgages in 2023: $2,907 (0.8%)Median real estate property taxes paid for housing units with no mortgage in 2023: $3,084 (0.8%)
Nearest city with pop. 50,000+: Daytona Beach, FL
Nearest city with pop. 200,000+: Jacksonville, FL
Nearest city with pop. 1,000,000+: Philadelphia, PA
Nearest cities:
Marineland, FL (3.0 miles),
Latitude: 29.54 N, Longitude: 81.22 W
Daytime population change due to commuting: -13,662 (-13.4%)Workers who live and work in this city: 21,589 (51.5%)
Palm Coast tourist attractions:
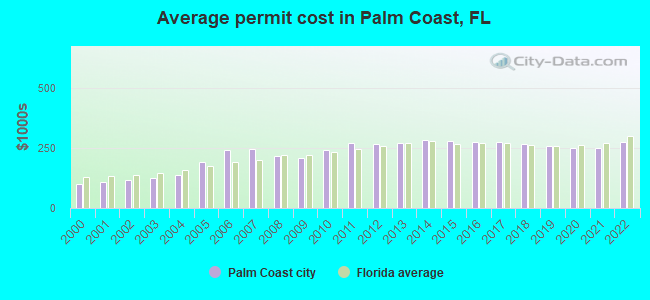
Single-family new house construction building permits:
2023: 1524 buildings , average cost: $251,6002022: 1910 buildings , average cost: $273,2002021: 1938 buildings , average cost: $248,8002020: 1246 buildings , average cost: $249,8002019: 817 buildings , average cost: $256,2002018: 755 buildings , average cost: $266,4002017: 631 buildings , average cost: $275,9002016: 538 buildings , average cost: $274,0002015: 355 buildings , average cost: $279,8002014: 339 buildings , average cost: $281,1002013: 265 buildings , average cost: $271,4002012: 155 buildings , average cost: $264,5002011: 80 buildings , average cost: $270,5002010: 117 buildings , average cost: $241,9002009: 130 buildings , average cost: $206,9002008: 189 buildings , average cost: $217,7002007: 405 buildings , average cost: $243,5002006: 1283 buildings , average cost: $238,6002005: 3043 buildings , average cost: $191,8002004: 3951 buildings , average cost: $138,2002003: 3481 buildings , average cost: $123,5002002: 2057 buildings , average cost: $116,0002001: 1524 buildings , average cost: $110,0002000: 232 buildings , average cost: $97,600Unemployment in November 2024:
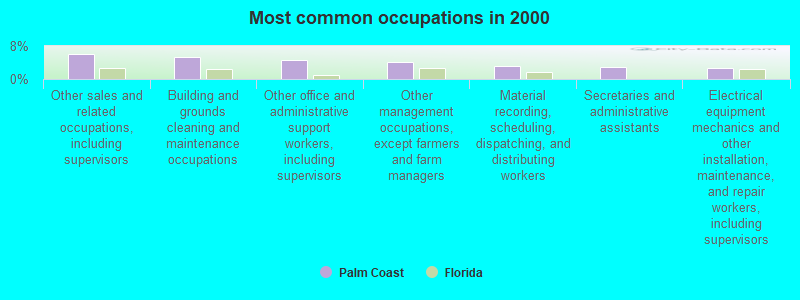
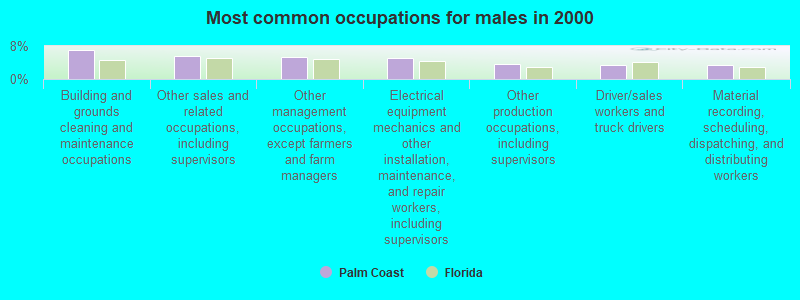
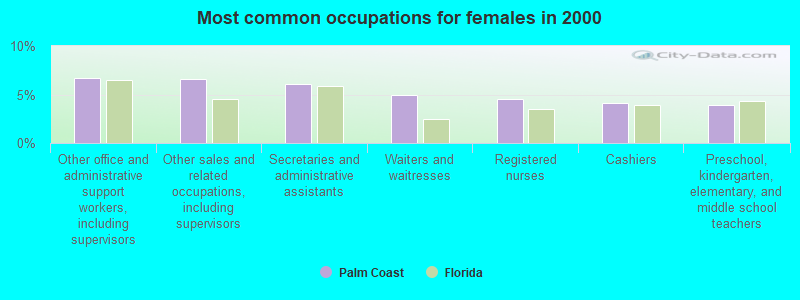
Most common occupations in Palm Coast, FL (%)
Both Males Females
Other sales and related occupations, including supervisors (6.1%)
Building and grounds cleaning and maintenance occupations (5.4%)
Other office and administrative support workers, including supervisors (4.6%)
Other management occupations, except farmers and farm managers (4.1%)
Material recording, scheduling, dispatching, and distributing workers (3.1%)
Secretaries and administrative assistants (2.9%)
Electrical equipment mechanics and other installation, maintenance, and repair workers, including supervisors (2.8%)
Building and grounds cleaning and maintenance occupations (7.1%)
Other sales and related occupations, including supervisors (5.7%)
Other management occupations, except farmers and farm managers (5.3%)
Electrical equipment mechanics and other installation, maintenance, and repair workers, including supervisors (5.0%)
Other production occupations, including supervisors (3.5%)
Driver/sales workers and truck drivers (3.4%)
Material recording, scheduling, dispatching, and distributing workers (3.4%)
Other office and administrative support workers, including supervisors (6.7%)
Other sales and related occupations, including supervisors (6.6%)
Secretaries and administrative assistants (6.0%)
Waiters and waitresses (4.9%)
Registered nurses (4.5%)
Cashiers (4.1%)
Preschool, kindergarten, elementary, and middle school teachers (3.9%)
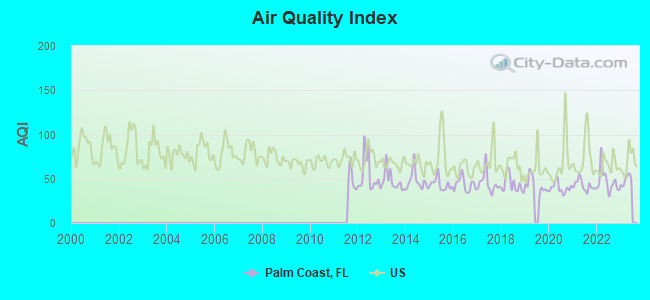
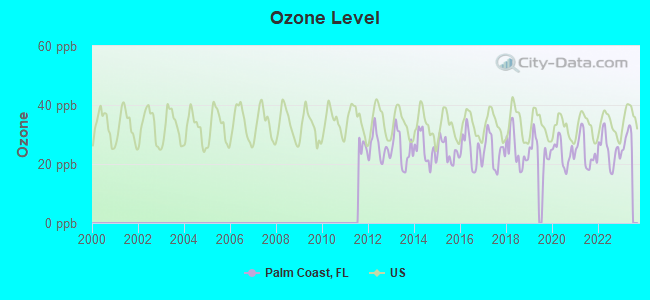
Air pollution and air quality trends(lower is better)
AQI Ozone
Tornado activity:
Palm Coast-area historical tornado activity is near Florida state average. It is 4% smaller than the overall U.S. average.
On 4/15/1958, a category F3 (max. wind speeds 158-206 mph) tornado 23.4 miles away from the Palm Coast city center injured 9 people and caused between $50,000 and $500,000 in damages.
On 2/7/1971, a category F3 tornado 27.2 miles away from the city center caused between $50,000 and $500,000 in damages.
Earthquake activity:
Palm Coast-area historical earthquake activity is significantly above Florida state average. It is 86% smaller than the overall U.S. average. On 9/10/2006 at 14:56:08, a magnitude 5.9 (5.9 MB, 5.5 MS, 5.8 MW, Class: Moderate, Intensity: VI - VII) earthquake occurred 401.1 miles away from Palm Coast center On 11/22/1974 at 05:25:55, a magnitude 4.7 (4.7 MB, Class: Light, Intensity: IV - V) earthquake occurred 241.1 miles away from the city center On 8/2/1974 at 08:52:09, a magnitude 4.9 (4.3 MB, 4.9 LG) earthquake occurred 308.9 miles away from Palm Coast center On 9/4/2016 at 18:29:29, a magnitude 3.8 (3.8 ML, Class: Light, Intensity: II - III) earthquake occurred 108.0 miles away from the city center On 9/21/2016 at 16:30:52, a magnitude 3.8 (3.8 ML) earthquake occurred 109.6 miles away from the city center On 6/23/2016 at 17:20:29, a magnitude 3.8 (3.8 ML) earthquake occurred 111.1 miles away from Palm Coast center Magnitude types: regional Lg-wave magnitude (LG), body-wave magnitude (MB), local magnitude (ML), surface-wave magnitude (MS), moment magnitude (MW) Natural disasters: The number of natural disasters in Flagler County (36) is a lot greater than the US average (19).Major Disasters (Presidential) Declared: 12Emergencies Declared: 5Hurricanes: 22, Tropical Storms: 8, Fires: 3, Tornadoes: 2, Flood: 1, Storm: 1, Wind: 1, Other: 2 (Note: some incidents may be assigned to more than one category). Hospitals and medical centers in Palm Coast: FLORIDA HOSPITAL FLAGLER (Voluntary non-profit - Church, 60 MEMORIAL MEDICAL PKWY) GRAND OAKS HEALTH AND REHABILITATION CENTER (3001 PALM COAST PARKWAY SE)
DIALYSIS CARE CENTER OF PALM COAST (515 PALM COAST PARKWAY SW)
PALM COAST DIALYSIS (13 KINGSWOOD DR SUITE A)
CONFIDENT CARE OF FLORIDA CORP (160 CYPRESS POINT PKWY, BLDG A STE 208)
College/University in Palm Coast: Flagler Technical Institute Full-time enrollment: 126; Location: 1 Corporate Drive Suite 2-J; Public; Website: FTI.FlaglerSchools.com)
Colleges/universities with over 2000 students nearest to Palm Coast:
Wyotech-Daytona (about 15 miles; Ormond Beach, FL ; Full-time enrollment: 2,295)
Flagler College-St Augustine (about 26 miles; Saint Augustine, FL ; FT enrollment: 2,644)
Daytona State College (about 26 miles; Daytona Beach, FL ; FT enrollment: 11,389)
Bethune-Cookman University (about 26 miles; Daytona Beach, FL ; FT enrollment: 3,733)
Embry-Riddle Aeronautical University-Worldwide (about 27 miles; Daytona Beach, FL ; FT enrollment: 9,244)
Embry-Riddle Aeronautical University-Daytona Beach (about 27 miles; Daytona Beach, FL ; FT enrollment: 4,932)
Saint Johns River State College (about 29 miles; Palatka, FL ; FT enrollment: 4,698)
Public high schools in Palm Coast:
Public elementary/middle schools in Palm Coast: PALM HARBOR ACADEMY Students: 1,377, Location: 95 OLD KINGS RD N, Grades: KG-6, Charter school )BUDDY TAYLOR MIDDLE SCHOOL Students: 440, Location: 4500 BELLE TERRE PKWY, Grades: 6-8)INDIAN TRAILS MIDDLE SCHOOL Students: 382, Location: 5505 BELLE TERRE PKWY, Grades: 6-8)IMAGINE SCHOOL AT TOWN CENTER Students: 275, Location: 775 TOWN CENTER BLVD, Grades: KG-8, Charter school )RYMFIRE ELEMENTARY SCHOOL Students: 202, Location: 1425 RYMFIRE DR, Grades: PK-6)BELLE TERRE ELEMENTARY SCHOOL Students: 61, Location: 5545 BELLE TERRE PKWY, Grades: PK-8)LEWIS E. WADSWORTH ELEMENTARY Students: 22, Location: 4550 BELLE TERRE PKWY, Grades: PK-6)PHOENIX ACADEMY Location: 5400 E HIGHWAY 100, Grades: 4-6)
Private elementary/middle schools in Palm Coast: ST ELIZABETH ANN SETON CATHOLIC SCHOOL Students: 214, Location: 4600 BELLE TERRE PKWY, Grades: PK-8)
CHRIST THE KING LUTHERAN SCHOOL Students: 208, Location: 5625 N US HIGHWAY 1, Grades: PK-5)
FIRST BAPTIST CHRISTIAN ACADEMY Students: 60, Location: 6052 PALM COAST PKWY NW, Grades: PK-2)
See full list of schools located in Palm Coast Library in Palm Coast: FLAGLER COUNTY PUBLIC LIBRARY Operating income: $1,256,341; Location: 2500 PALM COAST PARKWAY NW; 123,103 books ; 2,554 audio materials ; 6,587 video materials ; 25 local licensed databases ; 62 state licensed databases ; 157 print serial subscriptions ; 2 electronic serial subscriptions )
User-submitted facts and corrections:
PCMA TV99 (Municipal/Educational Cable Channel; PALM COAST, FL; Owner: CITY OF PALM COAST)
Notable locations in Palm Coast: (A) , Sabal Springs Golf and Racquet Club (B) , Sabal Palm Golf Course (C) , Royal Wood Golf and Country Club (D) , Flagler County Palm Coast Community Center (E) , Palm Coast Fire Department Station 21 (F) , Flagler County Fire Rescue 21 (G) , Palm Coast Fire Department Station 25 (H) , Palm Coast Fire Department Station 23 (I) , Flagler County Fire Rescue 22 (J) , Palm Coast Fire Department Station 22 (K) , Palm Coast Fire Department Station 21 (L) , Flagler County Fire Rescue 21 (M) , Flagler County Sheriff's Department Palm Coast Substation (N) , Flagler Auditorium (O) . Display/hide their locations on the map
Cemetery: (1) . Display/hide its location on the map
Lakes and swamps: (A) , Lehigh Cement Company Lake (B) , Black Branch Swamp (C) , Hulett Swamp (D) . Display/hide their locations on the map
Streams, rivers, and creeks: (A) , Big Mulberry Branch (B) . Display/hide their locations on the map
Tourist attraction: (1) . Display/hide its approximate location on the map
Hotel: (1) . Display/hide its approximate location on the map
Flagler County has a predicted average indoor radon screening level less than 2 pCi/L (pico curies per liter) - Low Potential Drinking water stations with addresses in Palm Coast that have no violations reported:
DUNES COMMUNITY DEVELOPMENT DISTRICT (Population served: 4,017, Primary Water Source Type: Groundwater)
GREENTREE ACRES (Address: 34 Palmyra Lane Serves NY, Population served: 118, Primary Water Source Type: Groundwater)
Average household size: This city:
2.5 peopleFlorida:
2.5 people
Percentage of family households: This city:
73.0%Whole state:
65.2%
Percentage of households with unmarried partners: This city:
6.9%Whole state:
7.3%
Likely homosexual households (counted as self-reported same-sex unmarried-partner households)
Lesbian couples: 0.4% of all households Gay men: 0.3% of all households
People in group quarters in Palm Coast in 2010:
144 people in nursing facilities/skilled-nursing facilities
138 people in state prisons
30 people in group homes intended for adults
7 people in workers' group living quarters and job corps centers
People in group quarters in Palm Coast in 2000:
241 people in nursing homes
29 people in other noninstitutional group quarters
5 people in homes for the physically handicapped
Banks with most branches in Palm Coast (2011 data):
SunTrust Bank: Palm Coast West Branch, Flagler Plaza Branch, The Hammock Branch, Palm Coast Branch. Info updated 2010/05/27: Bank assets: $171,291.7 mil, Deposits: $129,833.2 mil, headquarters in Atlanta, GA, positive income , Commercial Lending Specialization, 1716 total offices , Holding Company: Suntrust Banks, Inc.
Wells Fargo Bank, National Association: Cypress Point Branch, Palm Coast Town Center Branch, Palm Coast Parkway Branch. Info updated 2011/04/05: Bank assets: $1,161,490.0 mil, Deposits: $905,653.0 mil, headquarters in Sioux Falls, SD, positive income , 6395 total offices , Holding Company: Wells Fargo & Company
PNC Bank, National Association: Palm Coast Branch, Cypress Point Parkway, Belle Terre @ Town Center Branch. Info updated 2012/03/20: Bank assets: $263,309.6 mil, Deposits: $197,343.0 mil, headquarters in Wilmington, DE, positive income , Commercial Lending Specialization, 3085 total offices , Holding Company: Pnc Financial Services Group, Inc., The
Intracoastal Bank: at 1290 Palm Coast Parkway Nw, branch established on 2008/06/16; Courier Service at 1290 Palm Coast Parkway, branch established on 2008/06/16. Info updated 2009/08/11: Bank assets: $155.0 mil, Deposits: $138.4 mil, local headquarters , positive income , Commercial Lending Specialization, 2 total offices
Branch Banking and Trust Company: Palm Coast Branch at 1300 Palm Coast Parkway Sw, branch established on 2006/03/27; Hammock Branch at 5182 N Oceanshore Blvd Ste 1, branch established on 2003/03/20. Info updated 2010/03/29: Bank assets: $168,867.6 mil, Deposits: $127,549.5 mil, headquarters in Winston Salem, NC, positive income , Commercial Lending Specialization, 1793 total offices , Holding Company: Bb&T Corporation
Bank of America, National Association: Old Kings Road Branch at 2 Old Kings Road North, branch established on 1981/11/04; Belle Terre Branch at 4850 Belle Terre Parkway, branch established on 1995/10/10. Info updated 2009/11/18: Bank assets: $1,451,969.3 mil, Deposits: $1,077,176.8 mil, headquarters in Charlotte, NC, positive income , 5782 total offices , Holding Company: Bank Of America Corporation
Hancock Bank: Palm Coast Branch at 300 Palm Coast Parkway Northeast, branch established on 1998/05/18. Info updated 2011/06/14: Bank assets: $4,988.4 mil, Deposits: $4,121.5 mil, headquarters in Gulfport, MS, positive income , Commercial Lending Specialization, 81 total offices , Holding Company: Hancock Holding Company
Prosperity Bank: Palm Coast Branch at 181 Cypress Point Parkway, branch established on 1997/07/01. Info updated 2010/09/01: Bank assets: $779.3 mil, Deposits: $533.6 mil, headquarters in Saint Augustine, FL, positive income , Commercial Lending Specialization, 16 total offices , Holding Company: Prosperity Banking Company, The
Floridian Bank: Palm Coast Branch at 7 Boulder Rock Drive, branch established on 2007/03/26. Info updated 2007/03/26: Bank assets: $145.8 mil, Deposits: $125.7 mil, headquarters in Daytona Beach, FL, negative income in the last year , Commercial Lending Specialization, 5 total offices , Holding Company: Floridian Financial Group, Inc.
For population 15 years and over in Palm Coast:
Never married: 25.8%Now married: 53.1%Separated: 0.9%Widowed: 7.6%Divorced: 12.5% For population 25 years and over in Palm Coast:
High school or higher: 95.6%Bachelor's degree or higher: 31.5%Graduate or professional degree: 10.1%Unemployed: 3.2%Mean travel time to work (commute): 23.2 minutes
Education Gini index (Inequality in education) Here:
9.7Florida average:
12.1
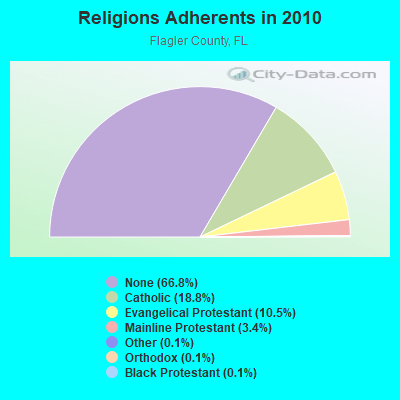
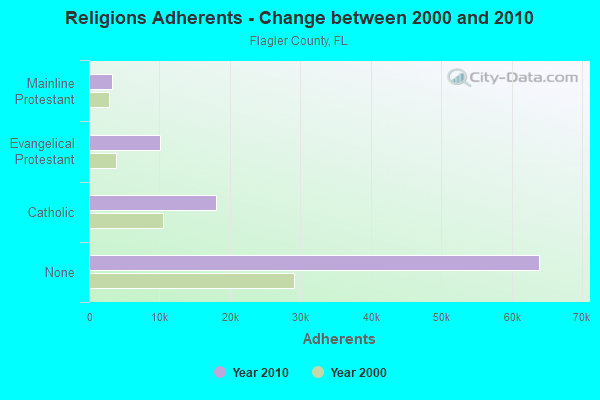
Religion statistics for Palm Coast, FL (based on Flagler County data)
Religion Adherents Congregations Catholic 18,033 4 Evangelical Protestant 10,014 52 Mainline Protestant 3,299 6 Other 142 4 Orthodox 140 3 Black Protestant 118 1 None 63,950 -
Source: Clifford Grammich, Kirk Hadaway, Richard Houseal, Dale E.Jones, Alexei Krindatch, Richie Stanley and Richard H.Taylor. 2012. 2010 U.S.Religion Census: Religious Congregations & Membership Study. Association of Statisticians of American Religious Bodies. Jones, Dale E., et al. 2002. Congregations and Membership in the United States 2000. Nashville, TN: Glenmary Research Center. Graphs represent county-level data
Food Environment Statistics: Number of grocery stores : 12This county :
1.36 / 10,000 pop.Florida :
2.04 / 10,000 pop.
Number of supercenters and club stores : 1Flagler County :
0.11 / 10,000 pop.State :
0.11 / 10,000 pop.
Number of convenience stores (no gas) : 4This county :
0.45 / 10,000 pop.Florida :
1.28 / 10,000 pop.
Number of convenience stores (with gas) : 20Flagler County :
2.27 / 10,000 pop.State :
3.04 / 10,000 pop.
Number of full-service restaurants : 66This county :
7.48 / 10,000 pop.Florida :
7.45 / 10,000 pop.
Low-income preschool obesity rate : Flagler County :
11.4%State :
14.0%
Health and Nutrition: Healthy diet rate : This city:
52.3%Florida:
51.4%
Average overall health of teeth and gums : Palm Coast:
48.0%Florida:
49.4%
Average BMI : Palm Coast:
28.9State:
28.6
People feeling badly about themselves : People not drinking alcohol at all : This city:
12.6%State:
10.7%
Average hours sleeping at night : Palm Coast:
6.9Florida:
6.9
Overweight people : Palm Coast:
37.1%Florida:
34.7%
General health condition : This city:
55.0%State:
57.0%
Average condition of hearing : This city:
75.1%Florida:
79.2%
More about Health and Nutrition of Palm Coast, FL Residents
Local government employment and payroll (March 2022)
Function
Full-time employees
Monthly full-time payroll
Average yearly full-time wage
Part-time employees
Monthly part-time payroll
Other and Unallocable
142 $641,333 $54,197 1 $2,213 Sewerage
101 $499,985 $59,404 0 $0 Firefighters
64 $416,226 $78,042 0 $0 Water Supply
62 $304,760 $58,986 0 $0 Financial Administration
41 $228,307 $66,822 1 $491 Other Government Administration
40 $229,209 $68,763 1 $843 Parks and Recreation
35 $141,353 $48,464 40 $41,008 Fire - Other
1 $4,527 $54,324 0 $0
Totals for Government
486 $2,465,700 $60,881 43 $44,556
Palm Coast government finances - Expenditure in 2022 (per resident):
Construction - Sewerage: $8,813,000 ($89.55)
Water Utilities: $8,813,000 ($89.55)Regular Highways: $6,639,000 ($67.46)General - Other: $6,265,000 ($63.66)Parks and Recreation: $2,608,000 ($26.50)Local Fire Protection: $129,000 ($1.31)Natural Resources - Other: $28,000 ($0.28)Current Operations - Sewerage: $28,090,000 ($285.44)
Natural Resources - Other: $11,098,000 ($112.77)Water Utilities: $10,245,000 ($104.10)Regular Highways: $10,033,000 ($101.95)Local Fire Protection: $9,340,000 ($94.91)Solid Waste Management: $9,132,000 ($92.79)Parks and Recreation: $5,818,000 ($59.12)General - Other: $5,623,000 ($57.14)Police Protection: $4,253,000 ($43.22)Central Staff Services: $3,856,000 ($39.18)Protective Inspection and Regulation - Other: $2,570,000 ($26.11)Financial Administration: $1,421,000 ($14.44)Judicial and Legal Services: $566,000 ($5.75)General - Interest on Debt: $691,000 ($7.02)
Water Utilities - Interest on Debt: $3,806,000 ($38.67)
Palm Coast government finances - Revenue in 2022 (per resident):
Charges - Natural Resources - Other: $12,748,000 ($129.54)
Solid Waste Management: $9,303,000 ($94.53)Other: $5,355,000 ($54.41)Parks and Recreation: $1,998,000 ($20.30)Regular Highways: $244,000 ($2.48)Federal Intergovernmental - Other: $1,635,000 ($16.61)
Local Intergovernmental - Other: $3,493,000 ($35.49)
Miscellaneous - Sale of Property: $608,000 ($6.18)
Fines and Forfeits: $561,000 ($5.70)Rents: $398,000 ($4.04)Interest Earnings: $392,000 ($3.98)Special Assessments: $318,000 ($3.23)General Revenue - Other: $251,000 ($2.55)Donations From Private Sources: $10,000 ($0.10)Revenue - Water Utilities: $48,824,000 ($496.12)
State Intergovernmental - Other: $8,857,000 ($90.00)
Tax - Property: $27,725,000 ($281.73)
General Sales and Gross Receipts: $4,060,000 ($41.26)Public Utilities Sales: $2,411,000 ($24.50)Motor Fuels Sales: $2,119,000 ($21.53)Occupation and Business License - Other: $1,503,000 ($15.27)Insurance Premiums Sales: $308,000 ($3.13)Other License: $11,000 ($0.11)
Palm Coast government finances - Debt in 2022 (per resident):
Long Term Debt - Beginning Outstanding - Unspecified Public Purpose: $154,841,000 ($1573.41)
Outstanding Unspecified Public Purpose: $150,849,000 ($1532.85)Retired Unspecified Public Purpose: $5,241,000 ($53.26)
Businesses in Palm Coast, FL
Name Count Name Count
AT&T 3 McDonald's 2 Ace Hardware 2 Microtel 1 Advance Auto Parts 1 Nike 3 AutoZone 1 Olive Garden 1 Baskin-Robbins 2 Outback 1 Best Western 1 Outback Steakhouse 1 Blockbuster 1 Panda Express 1 CVS 2 Payless 1 Chevrolet 1 Penske 1 Cracker Barrel 1 PetSmart 1 Curves 1 Pizza Hut 1 DHL 2 Publix Super Markets 4 Days Inn 1 Quiznos 1 Decora Cabinetry 2 RadioShack 1 Dennys 1 Red Lobster 1 Domino's Pizza 2 Ruby Tuesday 1 Dunkin Donuts 3 Sears 1 Famous Footwear 1 Sleep Inn 1 FedEx 8 Sprint Nextel 1 Ford 1 Staples 1 GNC 1 Starbucks 2 GameStop 1 Steak 'n Shake 1 Goodwill 2 Subway 5 H&R Block 1 T-Mobile 2 Hilton 2 Taco Bell 1 Holiday Inn 1 Target 1 Home Depot 1 Tire Kingdom 1 Jones New York 3 U-Haul 4 KFC 1 UPS 11 Kohl's 1 Walgreens 3 Lowe's 1 Walmart 1 Marriott 1 YMCA 1 MasterBrand Cabinets 6
Strongest AM radio stations in Palm Coast:
WOKV (690 AM; 50 kW; JACKSONVILLE, FL; Owner: COX RADIO, INC.)
WONQ (1030 AM; 45 kW; OVIEDO, FL; Owner: FLORIDA BROADCASTERS)
WIXC (1060 AM; 50 kW; TITUSVILLE, FL; Owner: GENESIS COMMUNICATIONS I, INC.)
WFLF (540 AM; 50 kW; PINE HILLS, FL; Owner: CLEAR CHANNEL BROADCASTING LICENSES, INC.)
WDYZ (990 AM; 50 kW; ORLANDO, FL; Owner: ABC, INC.)
WQTM (740 AM; 50 kW; ORLANDO, FL; Owner: CLEAR CHANNEL BROADCASTING LICENSES, INC.)
WGSR (1570 AM; 50 kW; FERNANDINA BEACH, FL; Owner: RJM COMMUNICATIONS, INC)
WELE (1380 AM; 5 kW; ORMOND BEACH, FL; Owner: WINGS COMMUNICATIONS, INCORPORATED)
WOBS (1530 AM; daytime; 50 kW; JACKSONVILLE, FL; Owner: WORD BROADCASTING NETWORK, INC.)
WSOS (1170 AM; daytime; 5 kW; ST. AUGUSTINE BEACH, FL; Owner: 3 POINT MEDIA - FLORIDA, LLC)
WFVR (910 AM; 50 kW; VALDOSTA, GA; Owner: RAMA COMMUNICATIONS, INC.)
WHOO (1080 AM; daytime; 35 kW; KISSIMMEE, FL; Owner: GENESIS COMMUNICATIONS I, INC.)
WYND (1310 AM; 8 kW; DELAND, FL; Owner: BUDDY TUCKER ASSOCIATION, INC.)
Strongest FM radio stations in Palm Coast:
WGNE-FM (99.9 FM; PALATKA, FL; Owner: RENDA BROADCASTING CORP. OF NEVADA)
W247AJ (97.3 FM; PALM COAST, FL; Owner: BIBLE BROADCASTING NETWORK, INC.)
WJHM (101.9 FM; DAYTONA BEACH, FL; Owner: INFINITY RADIO OPERATIONS INC.)
WOCL (105.9 FM; DELAND, FL; Owner: INFINITY RADIO OPERATIONS INC.)
WMGF (107.7 FM; MOUNT DORA, FL; Owner: CLEAR CHANNEL BROADCASTING LICENSES, INC.)
WCFB (94.5 FM; DAYTONA BEACH, FL; Owner: COX RADIO, INC.)
WJLH (90.3 FM; FLAGLER BEACH, FL; Owner: CORNERSTONE BROADCASTING CORPORATION)
WSJF (105.5 FM; ST. AUGUSTINE BEACH, FL; Owner: TAMA BROADCASTING, INC.)
WHOG-FM (95.7 FM; ORMOND-BY-THE-SEA, FL; Owner: BLACK CROW RADIO, LLC)
WVYB (103.3 FM; HOLLY HILL, FL; Owner: BLACK CROW MEDIA, LLC)
WAPN (91.5 FM; HOLLY HILL, FL; Owner: PUBLIC RADIO, INC.)
WFBO-LP (93.3 FM; FLAGLER BEACH, FL; Owner: HALIFAX CHRISTIAN COMMUNITY CHURCH INC.)
TV broadcast stations around Palm Coast:
WCEU (Channel 15; NEW SMYRNA BEACH, FL; Owner: DAYTONA BEACH COMMUNITY COLLEGE)
WESH (Channel 2; DAYTONA BEACH, FL; Owner: ORLANDO HEARST-ARGYLE TELEVISION, INC.)
WXXU-LP (Channel 12; ALTAMONTE SPRINGS, FL; Owner: RAMA COMMUNICATIONS)
WVEN-TV (Channel 26; DAYTONA BEACH, FL; Owner: ENTRAVISION HOLDINGS, LLC)
WJWB (Channel 17; JACKSONVILLE, FL; Owner: MEDIA GENERAL COMMUNICATIONS, INC.)
WQXT-CA (Channel 22; ST. AUGUSTINE, FL; Owner: AIA TV, INC.)
WDYB-LP (Channel 53; DAYTONA BEACH, FL; Owner: TIGER EYE BROADCASTING CORPORATION)
WPXB-LP (Channel 57; DAYTONA BEACH, FL; Owner: PAXSON COMMUNICATIONS LPTV, INC.)
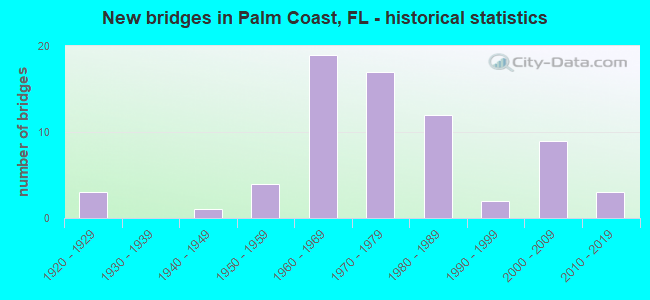
National Bridge Inventory (NBI) Statistics 50 Number of bridges614ft / 187m Total length $331,000 Total costs1,000,561 Total average daily traffic152,240 Total average daily truck traffic
New bridges - historical statistics
1 1920-1929 2 1950-1959 7 1960-1969 16 1970-1979 12 1980-1989 2 1990-1999 6 2000-2009 4 2010-2019
See full National Bridge Inventory statistics for Palm Coast, FL
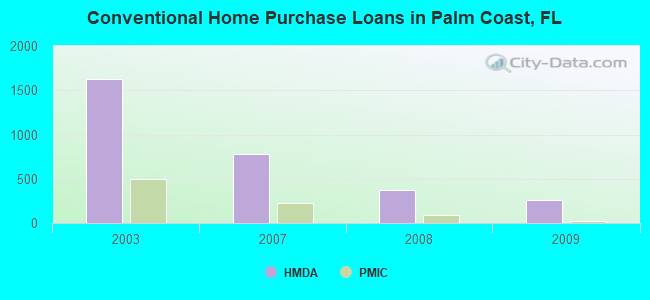
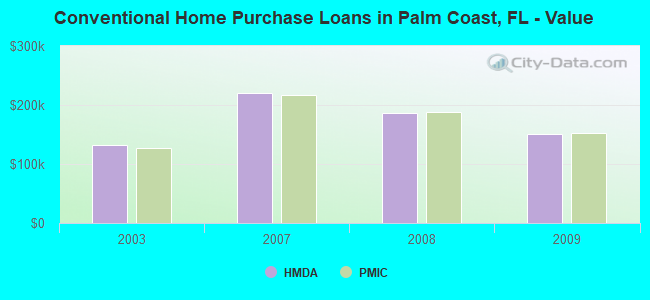
Home Mortgage Disclosure Act Aggregated Statistics For Year 2009(Based on 5 partial tracts) A) FHA, FSA/RHS & VA B) Conventional C) Refinancings D) Home Improvement Loans F) Non-occupant Loans on G) Loans On Manufactured Number Average Value Number Average Value Number Average Value Number Average Value Number Average Value Number Average Value
LOANS ORIGINATED 148 $138,376 260 $150,396 488 $160,790 15 $78,350 201 $166,264 2 $57,145 APPLICATIONS APPROVED, NOT ACCEPTED 15 $136,219 29 $142,299 67 $150,264 2 $53,495 22 $147,387 1 $58,640 APPLICATIONS DENIED 49 $130,933 60 $178,663 339 $197,513 23 $55,490 75 $229,744 4 $101,722 APPLICATIONS WITHDRAWN 16 $145,456 43 $186,713 154 $176,880 4 $101,520 32 $189,076 0 $0 FILES CLOSED FOR INCOMPLETENESS 11 $138,865 12 $209,362 60 $167,369 3 $156,127 23 $138,941 0 $0
Aggregated Statistics For Year 2008(Based on 5 partial tracts) A) FHA, FSA/RHS & VA B) Conventional C) Refinancings D) Home Improvement Loans E) Loans on Dwellings For 5+ Families F) Non-occupant Loans on G) Loans On Manufactured Number Average Value Number Average Value Number Average Value Number Average Value Number Average Value Number Average Value Number Average Value
LOANS ORIGINATED 150 $148,588 375 $186,607 378 $168,488 31 $90,367 0 $0 248 $195,778 2 $93,815 APPLICATIONS APPROVED, NOT ACCEPTED 9 $168,906 61 $174,850 112 $169,616 14 $71,221 0 $0 51 $183,631 1 $32,690 APPLICATIONS DENIED 60 $149,196 113 $184,383 448 $202,800 61 $120,656 1 $2,229,250 137 $195,261 5 $58,476 APPLICATIONS WITHDRAWN 19 $155,403 80 $192,411 172 $200,715 9 $124,817 1 $142,670 75 $225,829 2 $32,395 FILES CLOSED FOR INCOMPLETENESS 11 $134,345 21 $170,208 55 $202,511 3 $100,190 0 $0 20 $218,456 0 $0
Aggregated Statistics For Year 2007(Based on 5 partial tracts) A) FHA, FSA/RHS & VA B) Conventional C) Refinancings D) Home Improvement Loans F) Non-occupant Loans on G) Loans On Manufactured Number Average Value Number Average Value Number Average Value Number Average Value Number Average Value Number Average Value
LOANS ORIGINATED 41 $172,618 775 $219,637 1,062 $181,519 107 $84,356 541 $229,433 5 $88,530 APPLICATIONS APPROVED, NOT ACCEPTED 0 $0 170 $233,813 315 $191,661 46 $78,566 156 $230,999 2 $89,480 APPLICATIONS DENIED 12 $185,200 301 $220,884 917 $212,185 131 $91,895 296 $225,293 4 $109,675 APPLICATIONS WITHDRAWN 4 $197,742 108 $224,008 401 $206,138 23 $124,465 113 $223,511 1 $77,830 FILES CLOSED FOR INCOMPLETENESS 3 $157,430 50 $223,846 147 $213,836 4 $289,278 44 $251,662 0 $0
Aggregated Statistics For Year 2003(Based on 5 partial tracts) A) FHA, FSA/RHS & VA B) Conventional C) Refinancings D) Home Improvement Loans E) Loans on Dwellings For 5+ Families F) Non-occupant Loans on Number Average Value Number Average Value Number Average Value Number Average Value Number Average Value Number Average Value
LOANS ORIGINATED 90 $118,626 1,629 $132,736 1,761 $110,939 54 $42,662 3 $8,089,200 885 $140,778 APPLICATIONS APPROVED, NOT ACCEPTED 3 $91,163 155 $140,806 250 $109,466 18 $35,359 0 $0 87 $162,247 APPLICATIONS DENIED 23 $119,039 252 $141,822 562 $106,285 90 $38,885 1 $14,270 135 $136,761 APPLICATIONS WITHDRAWN 30 $122,452 188 $146,770 444 $118,939 11 $50,600 1 $120,380 108 $153,175 FILES CLOSED FOR INCOMPLETENESS 8 $119,156 58 $129,518 74 $117,796 13 $39,520 0 $0 20 $134,558
Detailed HMDA statistics for the following Tracts:
0601.01
, 0601.02 , 0602.02 , 0602.03 , 0603.00
Private Mortgage Insurance Companies Aggregated Statistics For Year 2009(Based on 5 partial tracts) A) Conventional B) Refinancings C) Non-occupant Loans on Number Average Value Number Average Value Number Average Value
LOANS ORIGINATED 19 $152,976 4 $185,330 4 $158,565 APPLICATIONS APPROVED, NOT ACCEPTED 11 $204,198 1 $293,410 6 $163,840 APPLICATIONS DENIED 5 $160,330 2 $147,620 1 $392,270 APPLICATIONS WITHDRAWN 0 $0 0 $0 0 $0 FILES CLOSED FOR INCOMPLETENESS 1 $175,750 1 $174,770 0 $0
Aggregated Statistics For Year 2008(Based on 5 partial tracts) A) Conventional B) Refinancings C) Non-occupant Loans on Number Average Value Number Average Value Number Average Value
LOANS ORIGINATED 88 $187,917 33 $222,954 39 $184,724 APPLICATIONS APPROVED, NOT ACCEPTED 47 $245,050 46 $220,235 29 $252,014 APPLICATIONS DENIED 9 $268,659 8 $231,309 6 $275,778 APPLICATIONS WITHDRAWN 3 $279,940 4 $254,335 4 $300,615 FILES CLOSED FOR INCOMPLETENESS 7 $188,977 2 $252,520 5 $201,258
Aggregated Statistics For Year 2007(Based on 5 partial tracts) A) Conventional B) Refinancings C) Non-occupant Loans on Number Average Value Number Average Value Number Average Value
LOANS ORIGINATED 228 $217,626 96 $238,888 105 $238,518 APPLICATIONS APPROVED, NOT ACCEPTED 64 $264,814 27 $275,823 37 $272,541 APPLICATIONS DENIED 4 $270,785 2 $267,510 3 $169,423 APPLICATIONS WITHDRAWN 11 $238,695 14 $230,469 8 $262,579 FILES CLOSED FOR INCOMPLETENESS 3 $296,757 0 $0 2 $250,410
Aggregated Statistics For Year 2003(Based on 5 partial tracts) A) Conventional B) Refinancings C) Non-occupant Loans on Number Average Value Number Average Value Number Average Value
LOANS ORIGINATED 501 $126,687 110 $125,847 238 $125,196 APPLICATIONS APPROVED, NOT ACCEPTED 116 $130,539 23 $137,383 54 $131,749 APPLICATIONS DENIED 11 $136,370 3 $174,237 9 $125,410 APPLICATIONS WITHDRAWN 45 $125,759 13 $143,390 23 $131,446 FILES CLOSED FOR INCOMPLETENESS 5 $107,556 1 $94,520 4 $119,265
Detailed PMIC statistics for the following Tracts:
0601.01
, 0601.02 , 0602.02 , 0602.03 , 0603.00 Fire-safe hotels and motels in Palm Coast, Florida:
Sleep Inn, 10 Kingswood Dr, Palm Coast, Florida 32137 Phone: (904) 466-8180
Harborside Inn Palm Coast Res, 300 Clubhouse Dr, Palm Coast, Florida 32137
Microtel Inn & Suites By Wyndham, 16 Kingswood Dr, Palm Coast, Florida 32137 Phone: (386) 445-9150, Fax: (386) 445-8977
Hampton Inn Palm Coast, 5 Kingswood Dr, Palm Coast, Florida 32137 Phone: (386) 446-4457, Fax: (386) 445-1438
Holiday Inn Express Hotel And Suites Palm Coast, 200 Flagler Plaza Dr, Palm Coast, Florida 32137 Phone: (386) 439-3939, Fax: (386) 439-4300
Hampton Inn & Suites Palm Coast, 150 Flagler Plaza Dr, Palm Coast, Florida 32137 Phone: (386) 439-8999, Fax: (386) 439-8989
Hilton Garden Inn Palm Coast/Town Center, 55 Town Center Blvd, Palm Coast, Florida 32164 Phone: (386) 586-2463
Fairfield Inn And Suites, 400 Old Kings Rd N, Palm Coast, Florida 32137 Phone: (386) 445-3450, Fax: (386) 446-4608
All 8 fire-safe hotels and motels in Palm Coast, Florida
Most common first names in Palm Coast, FL among deceased individuals Name Count Lived (average)
John 262 76.7 years Robert 185 75.0 years William 169 76.7 years Mary 152 82.6 years Joseph 146 76.5 years James 125 74.9 years Margaret 91 83.5 years Charles 90 77.6 years Thomas 78 71.5 years Dorothy 78 81.6 years
Most common last names in Palm Coast, FL among deceased individuals Last name Count Lived (average)
Smith 57 74.5 years Brown 33 71.8 years Johnson 33 79.8 years Williams 24 80.6 years Martin 23 77.1 years Wilson 23 79.6 years Davis 22 75.9 years Miller 21 76.7 years Jones 21 79.9 years Taylor 19 81.8 years
Palm Coast compared to Florida state average:
Unemployed percentage significantly below state average. Black race population percentage above state average. Median age above state average. Foreign-born population percentage above state average. House age significantly below state average. Number of college students above state average. Palm Coast on our top lists :
#1 on the list of "Top 101 cities with largest percentage of females in industries: real estate and rental and leasing (population 50,000+)"
#1 on the list of "Top 101 cities with largest percentage of males in industries: management of companies and enterprises (population 50,000+)"
#8 on the list of "Top 101 cities with the most people born in other U.S. states (population 50,000+)"
#8 on the list of "Top 101 cities with largest percentage of males in industries: other services, except public administration (population 50,000+)"
#9 on the list of "Top 101 cities with largest percentage of males in occupations: building and grounds cleaning and maintenance occupations (population 50,000+)"
#10 on the list of "Top 101 cities with largest percentage of males in industries: real estate and rental and leasing (population 50,000+)"
#17 on the list of "Top 101 cities with largest percentage of males in industries: arts, entertainment, and recreation (population 50,000+)"
#18 on the list of "Top 101 cities with the lowest average snowfall in a year (population 50,000+)"
#18 on the list of "Top 100 cities with oldest residents (pop. 50,000+)"
#22 on the list of "Top 100 fastest growing cities from 2000 to 2014 (pop. 50,000+)"
#24 on the list of "Top 101 cities with largest percentage of females in occupations: sales and related occupations (population 50,000+)"
#25 on the list of "Top 101 cities with largest percentage of workers with very short commute times (9 minutes or less) (population 50,000+)"
#27 on the list of "Top 100 cities with newest houses (pop. 50,000+)"
#31 on the list of "Top 101 cities with the least people having Doctorate degrees (population 50,000+)"
#43 on the list of "Top 101 cities with largest percentage of males in industries: administrative and support and waste management services (population 50,000+)"
#47 on the list of "Top 101 cities with largest percentage of females in industries: fuel dealers (population 50,000+)"
#49 on the list of "Top 101 cities with largest percentage of females in industries: farm supplies merchant wholesalers (population 50,000+)"
#50 on the list of "Top 101 cities with largest percentage of females in occupations: pipelayers, plumbers, pipefitters, and steamfitters (population 50,000+)"
#50 on the list of "Top 101 cities with largest percentage of females in industries: farm product raw materials merchant wholesalers (population 50,000+)"
#50 on the list of "Top 101 cities with largest percentage of males in industries: farm product raw materials merchant wholesalers (population 50,000+)"
Top Patent Applicants
Robert Todd Swinderman (13)
Robert M. Stockman (13)
R. Todd Swinderman (8)
Robert Stockman (4)
Mikhail Vladimirovitch Matz (3)
Joseph Brifman (3)
Dennis W. Coolidge (3)
David K. Brainard (3)
Christopher J. Cunningham (2)
Naila Omar Khayyam Alieva (2)
Total of 125 patent applications in 2008-2025.


 Recent articles from our blog. Our writers, many of them Ph.D. graduates or candidates, create easy-to-read articles on a wide variety of topics.


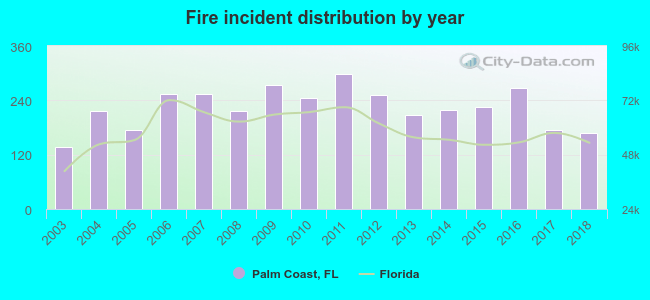 According to the data from the years 2003 - 2018 the average number of fires per year is 224. The highest number of reported fire incidents - 299 took place in 2011, and the least - 138 in 2003. The data has a rising trend.
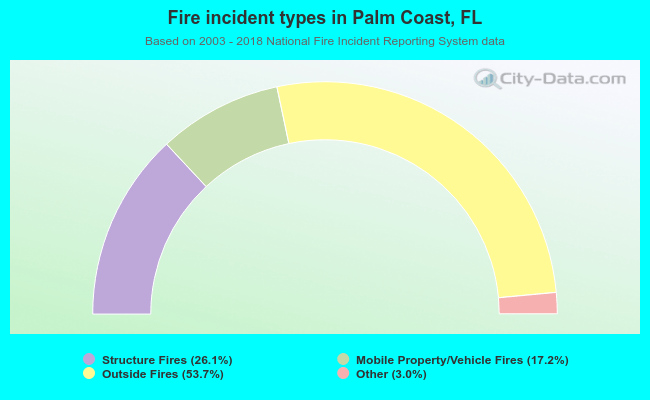 When looking into fire subcategories, the most reports belonged to: Outside Fires (53.7%), and Structure Fires (26.1%).