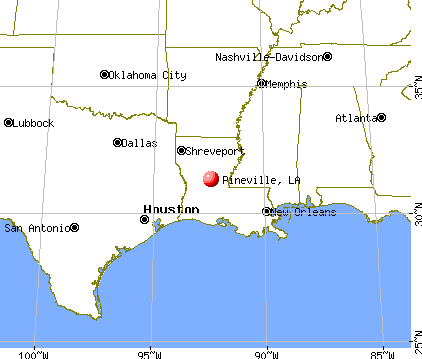
Pineville, Louisiana
Pineville: Moss covered tree at Lake Bulow.

Pineville: Icey Pine Feb 2011

Pineville: Wall street sign

Pineville: Sunset over Procter & Gamble in Pineville Louisiana
- add
your
Submit your own pictures of this city and show them to the world
See promotion details and to upload your Pineville, Louisiana photos
- OSM Map
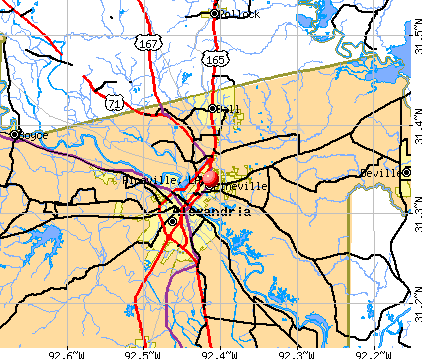
- General Map
- Google Map
- MSN Map

Pressure: 30.17 in
Humidity: 38%
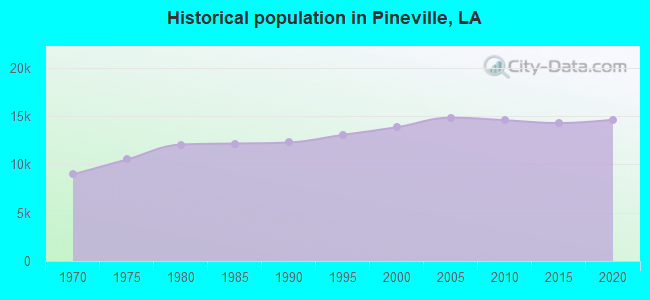
Population change since 2000: +2.0%
| Males: 6,897 | |
| Females: 7,212 |
| Median resident age: | 35.1 years |
| Louisiana median age: | 38.2 years |
Zip codes: 71360.
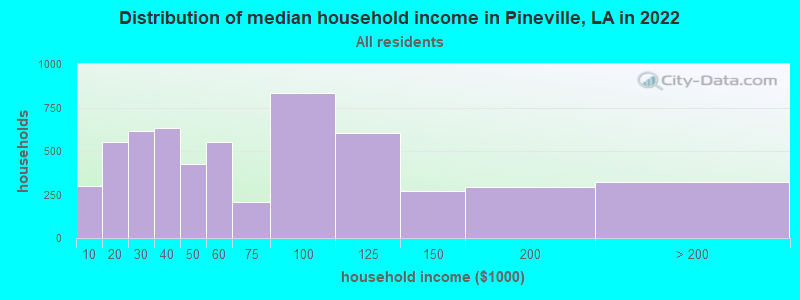
| Pineville: | $54,324 |
| LA: | $55,416 |
Estimated per capita income in 2022: $30,888 (it was $15,969 in 2000)
Pineville city income, earnings, and wages data
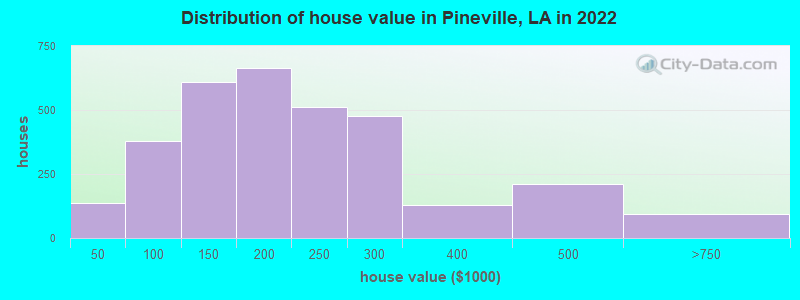
Estimated median house or condo value in 2022: $197,872 (it was $66,500 in 2000)
| Pineville: | $197,872 |
| LA: | $209,200 |
Mean prices in 2022: all housing units: $254,758; detached houses: $274,604; townhouses or other attached units: $297,686; in 2-unit structures: $81,455; in 3-to-4-unit structures: $260,085; in 5-or-more-unit structures: $176,166; mobile homes: $87,944; occupied boats, rvs, vans, etc.: $42,842
Median gross rent in 2022: $821.
(10.4% for White Non-Hispanic residents, 27.2% for Black residents, 10.7% for Hispanic or Latino residents, 16.3% for two or more races residents)
Detailed information about poverty and poor residents in Pineville, LA

Compare current foreclosures in Pineville, LA:
| Photo | Address | Area | Beds / Baths | Price | Details |
|---|---|---|---|---|---|

|
#1
Jenkins Dr
Pineville, LA 71360
|
- sq. feet
|
1 baths 2 beds |
$117,000
|
show details |

|
#2
Susek Dr
Pineville, LA 71360
|
3,129 sq. feet
|
3 baths 5 beds |
$379,900
|
show details |

|
#3
Old Marksville Hwy
Pineville, LA 71360
|
2,100 sq. feet
|
2 baths 3 beds |
$234,900
|
show details |

|
#4
Rifle Range Rd
Pineville, LA 71360
|
- sq. feet
|
2 baths 3 beds |
$50,000
|
show details |

|
#5
12 Aubrey St
Pineville, LA 71360
|
- sq. feet
|
2 baths 3 beds |
$39,900
|
show details |

|
#6
Melrose St
Pineville, LA 71360
|
- sq. feet
|
- baths - beds |
$6,085
|
show details |

|
#7
Wayne St
Pineville, LA 71360
|
- sq. feet
|
- baths - beds |
$6,085
|
show details |

|
#8
St
Pineville, LA 71360
|
- sq. feet
|
- baths - beds |
$6,085
|
show details |

|
#9
St
Pineville, LA 71360
|
- sq. feet
|
- baths - beds |
$6,085
|
show details |

|
#10
Wadley St
Pineville, LA 71360
|
- sq. feet
|
- baths - beds |
$6,085
|
show details |
| Photo | Address | Area | Beds / Baths | Price | Details |
|---|---|---|---|---|---|

|
#11
St
Pineville, LA 71360
|
- sq. feet
|
- baths - beds |
$6,085
|
show details |

|
#12
St
Pineville, LA 71360
|
- sq. feet
|
- baths - beds |
$6,085
|
show details |

|
#13
Barron St
Pineville, LA 71360
|
- sq. feet
|
- baths - beds |
$6,085
|
show details |

|
#14
St
Pineville, LA 71360
|
- sq. feet
|
- baths - beds |
$6,085
|
show details |

|
#15
Church St
Pineville, LA 71360
|
- sq. feet
|
- baths - beds |
$6,085
|
show details |

|
#16
St
Pineville, LA 71360
|
- sq. feet
|
- baths - beds |
$6,085
|
show details |

|
#17
Johnny Johnson St
Pineville, LA 71360
|
- sq. feet
|
- baths - beds |
$6,085
|
show details |

|
#18
Dr
Pineville, LA 71360
|
- sq. feet
|
- baths - beds |
$6,085
|
show details |

|
#19
St
Pineville, LA 71360
|
- sq. feet
|
- baths - beds |
$6,085
|
show details |

|
#20
Myers St
Pineville, LA 71360
|
- sq. feet
|
- baths - beds |
$6,085
|
show details |
| Photo | Address | Area | Beds / Baths | Price | Details |
|---|---|---|---|---|---|

|
#21
Desoto St
Pineville, LA 71360
|
- sq. feet
|
- baths - beds |
$6,085
|
show details |

|
#22
Hillcrest Blvd
Pineville, LA 71360
|
- sq. feet
|
- baths - beds |
$6,085
|
show details |

|
#23
Harlem St
Pineville, LA 71360
|
- sq. feet
|
- baths - beds |
$6,085
|
show details |

|
#24
Pryor St
Pineville, LA 71360
|
- sq. feet
|
- baths - beds |
$6,085
|
show details |

|
#25
Hardtner St
Pineville, LA 71360
|
- sq. feet
|
- baths - beds |
$6,085
|
show details |

|
#26
John Thomas St
Pineville, LA 71360
|
- sq. feet
|
- baths - beds |
$6,085
|
show details |

|
#27
Mason St
Pineville, LA 71360
|
- sq. feet
|
- baths - beds |
$6,085
|
show details |

|
#28
Lakeview St
Pineville, LA 71360
|
- sq. feet
|
- baths - beds |
$6,085
|
show details |

|
#29
Chandler St
Pineville, LA 71360
|
- sq. feet
|
- baths - beds |
$6,085
|
show details |

|
#30
Buchanan St
Pineville, LA 71360
|
- sq. feet
|
- baths - beds |
$6,085
|
show details |
| Photo | Address | Area | Beds / Baths | Price | Details |
|---|---|---|---|---|---|

|
#31
First St
Pineville, LA 71360
|
- sq. feet
|
- baths - beds |
$6,085
|
show details |

|
#32
Mason St
Pineville, LA 71360
|
- sq. feet
|
- baths - beds |
$6,085
|
show details |

|
#33
Second St
Pineville, LA 71360
|
- sq. feet
|
- baths - beds |
$6,085
|
show details |

|
#34
John Thomas St
Pineville, LA 71360
|
- sq. feet
|
- baths - beds |
$6,085
|
show details |

|
#35
Cedar Ln
Pineville, LA 71360
|
- sq. feet
|
- baths - beds |
$6,085
|
show details |

|
#36
Lakeview St
Pineville, LA 71360
|
- sq. feet
|
- baths - beds |
$6,085
|
show details |

|
#37
St
Pineville, LA 71360
|
- sq. feet
|
- baths - beds |
$6,085
|
show details |

|
#38
Baker St
Pineville, LA 71360
|
- sq. feet
|
- baths - beds |
$6,085
|
show details |

|
#39
3rd St
Pineville, LA 71360
|
- sq. feet
|
- baths - beds |
$6,085
|
show details |

|
#40
Wood St
Pineville, LA 71360
|
- sq. feet
|
- baths - beds |
$6,085
|
show details |
| Photo | Address | Area | Beds / Baths | Price | Details |
|---|---|---|---|---|---|

|
#41
Wayne St
Pineville, LA 71360
|
- sq. feet
|
- baths - beds |
$6,085
|
show details |

|
#42
Effie St
Pineville, LA 71360
|
- sq. feet
|
- baths - beds |
$6,085
|
show details |

|
#43
St
Pineville, LA 71360
|
- sq. feet
|
- baths - beds |
$6,085
|
show details |

|
#44
Ave
Pineville, LA 71360
|
- sq. feet
|
- baths - beds |
$6,085
|
show details |

|
#45
Reagan St
Pineville, LA 71360
|
- sq. feet
|
- baths - beds |
$6,085
|
show details |

|
#46
Smith St
Pineville, LA 71360
|
- sq. feet
|
- baths - beds |
$6,085
|
show details |

|
#47
Ruth St
Pineville, LA 71360
|
- sq. feet
|
- baths - beds |
$6,085
|
show details |

|
#48
St
Pineville, LA 71360
|
- sq. feet
|
- baths - beds |
$6,085
|
show details |

|
#49
Wayne St
Pineville, LA 71360
|
- sq. feet
|
- baths - beds |
$6,085
|
show details |

|
Check over 1 million property listings on Foreclosure.com!
|
browse all offers | |||


- 8,77262.2%White alone
- 4,32430.7%Black alone
- 6774.8%Two or more races
- 2822.0%Hispanic
- 190.1%American Indian alone
- 170.1%Other race alone
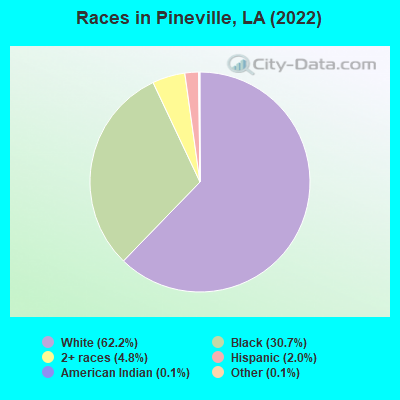
Races in Pineville detailed stats: ancestries, foreign born residents, place of birth
According to our research of Louisiana and other state lists, there were 128 registered sex offenders living in Pineville, Louisiana as of February 17, 2025.
The ratio of all residents to sex offenders in Pineville is 114 to 1.
Type |
2009 |
2010 |
2011 |
2012 |
2013 |
2014 |
2015 |
2016 |
2017 |
2018 |
2019 |
2020 |
|---|---|---|---|---|---|---|---|---|---|---|---|---|
| Murders (per 100,000) | 0 (0.0) | 1 (6.9) | 0 (0.0) | 0 (0.0) | 0 (0.0) | 0 (0.0) | 0 (0.0) | 0 (0.0) | 0 (0.0) | 0 (0.0) | 0 (0.0) | 1 (7.1) |
| Rapes (per 100,000) | 1 (6.7) | 0 (0.0) | 6 (40.8) | 6 (40.8) | 4 (27.5) | 11 (76.1) | 16 (111.1) | 13 (90.4) | 10 (69.1) | 7 (48.6) | 11 (77.1) | 14 (99.4) |
| Robberies (per 100,000) | 7 (47.0) | 7 (48.1) | 4 (27.2) | 13 (88.3) | 9 (61.8) | 11 (76.1) | 10 (69.4) | 10 (69.5) | 13 (89.8) | 7 (48.6) | 6 (42.1) | 10 (71.0) |
| Assaults (per 100,000) | 36 (241.9) | 39 (267.9) | 40 (272.3) | 107 (726.9) | 68 (467.2) | 73 (504.7) | 118 (819.4) | 113 (785.9) | 125 (863.7) | 77 (534.2) | 97 (680.2) | 108 (767.1) |
| Burglaries (per 100,000) | 172 (1,156) | 119 (817.6) | 134 (912.3) | 161 (1,094) | 158 (1,086) | 155 (1,072) | 168 (1,167) | 137 (952.8) | 200 (1,382) | 152 (1,054) | 138 (967.7) | 140 (994.4) |
| Thefts (per 100,000) | 425 (2,855) | 552 (3,793) | 507 (3,452) | 631 (4,286) | 711 (4,885) | 689 (4,764) | 681 (4,729) | 715 (4,973) | 805 (5,562) | 609 (4,225) | 554 (3,885) | 514 (3,651) |
| Auto thefts (per 100,000) | 19 (127.6) | 22 (151.2) | 22 (149.8) | 18 (122.3) | 28 (192.4) | 41 (283.5) | 37 (256.9) | 46 (319.9) | 42 (290.2) | 35 (242.8) | 44 (308.5) | 48 (340.9) |
| Arson (per 100,000) | 0 (0.0) | 2 (13.7) | 0 (0.0) | 2 (13.6) | 2 (13.7) | 1 (6.9) | 0 (0.0) | 1 (7.0) | 2 (13.8) | 0 (0.0) | 0 (0.0) | 2 (14.2) |
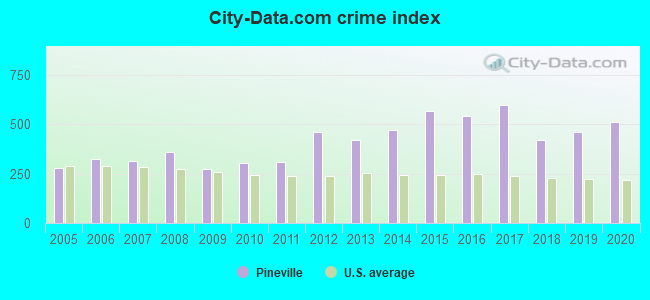
| City-Data.com crime index | 273.2 | 302.8 | 309.2 | 462.3 | 420.7 | 472.8 | 565.0 | 541.6 | 597.4 | 422.5 | 458.2 | 511.4 |
The City-Data.com crime index weighs serious crimes and violent crimes more heavily. Higher means more crime, U.S. average is 246.1. It adjusts for the number of visitors and daily workers commuting into cities.
Crime rate in Pineville detailed stats: murders, rapes, robberies, assaults, burglaries, thefts, arson
Full-time law enforcement employees in 2020, including police officers: 77 (69 officers - 57 male; 12 female).
| Officers per 1,000 residents here: | 4.90 |
| Louisiana average: | 3.56 |
 Recent articles from our blog. Our writers, many of them Ph.D. graduates or candidates, create easy-to-read articles on a wide variety of topics.

 | I miss Louisiana. Home sick!!! (38 replies) |
| Louisiana is the WORST STATE in the U.S. ever!!!!! (221 replies) |
| MOVING to Louisiana but never been ! (37 replies) |
| Louisiana thread calling for input from those living in Shreveport/Bossier City, Baton Rouge, and Lake Charles areas. (80 replies) |
| childcare in Alexandria/Pineville (0 replies) |
| Plastipak Pineville - Is This A Ruse? (0 replies) |
Latest news from Pineville, LA collected exclusively by city-data.com from local newspapers, TV, and radio stations
Ancestries: American (7.3%), French (3.9%), English (3.2%), German (2.7%), Irish (1.7%), Italian (1.5%).
Current Local Time: CST time zone
Incorporated on 03/14/1878
Elevation: 123 feet
Land area: 11.5 square miles.
Population density: 1,229 people per square mile (low).
248 residents are foreign born
| This city: | 1.8% |
| Louisiana: | 4.2% |
Median real estate property taxes paid for housing units with mortgages in 2022: $1,361 (0.6%)
Median real estate property taxes paid for housing units with no mortgage in 2022: $176 (0.1%)
Nearest city with pop. 50,000+: Lafayette, LA (81.1 miles
, pop. 110,257).
Nearest city with pop. 200,000+: Baton Rouge, LA (97.0 miles
, pop. 227,818).
Nearest city with pop. 1,000,000+: Houston, TX (207.8 miles
, pop. 1,953,631).
Nearest cities:
Latitude: 31.34 N, Longitude: 92.41 W
Daytime population change due to commuting: +3,714 (+26.3%)
Workers who live and work in this city: 2,881 (41.5%)
Area code commonly used in this area: 318

Pineville, Louisiana accommodation & food services, waste management - Economy and Business Data
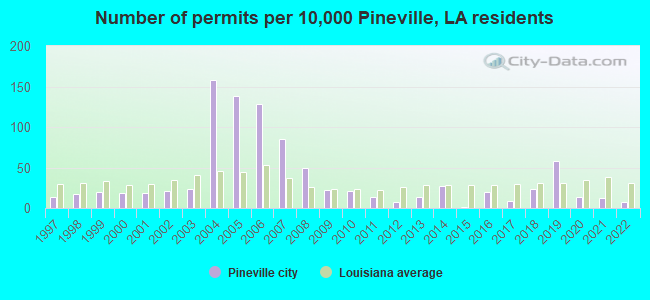
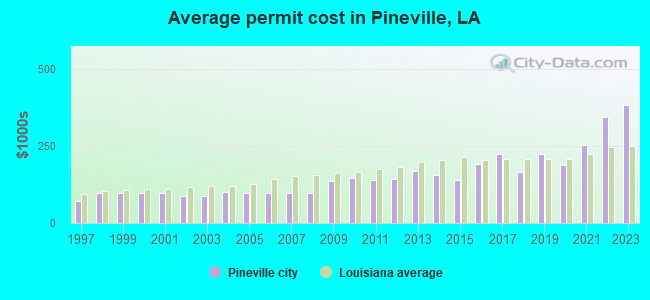
Single-family new house construction building permits:
- 2022: 9 buildings, average cost: $342,900
- 2021: 16 buildings, average cost: $251,900
- 2020: 19 buildings, average cost: $186,500
- 2019: 80 buildings, average cost: $223,600
- 2018: 33 buildings, average cost: $163,600
- 2017: 12 buildings, average cost: $221,600
- 2016: 28 buildings, average cost: $189,500
- 2015: 1 building, cost: $138,300
- 2014: 38 buildings, average cost: $155,700
- 2013: 18 buildings, average cost: $167,200
- 2012: 9 buildings, average cost: $144,000
- 2011: 18 buildings, average cost: $139,700
- 2010: 29 buildings, average cost: $147,100
- 2009: 30 buildings, average cost: $135,100
- 2008: 69 buildings, average cost: $98,200
- 2007: 118 buildings, average cost: $98,200
- 2006: 178 buildings, average cost: $98,300
- 2005: 191 buildings, average cost: $98,100
- 2004: 219 buildings, average cost: $98,600
- 2003: 32 buildings, average cost: $86,700
- 2002: 29 buildings, average cost: $86,700
- 2001: 25 buildings, average cost: $95,800
- 2000: 25 buildings, average cost: $95,800
- 1999: 27 buildings, average cost: $95,800
- 1998: 24 buildings, average cost: $95,800
- 1997: 18 buildings, average cost: $71,100
| Here: | 3.7% |
| Louisiana: | 3.8% |
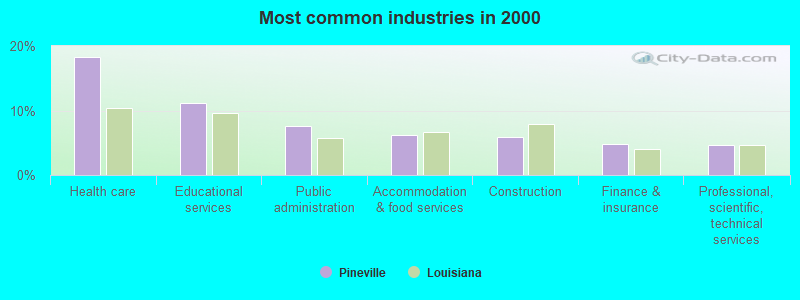
- Health care (18.3%)
- Educational services (11.1%)
- Public administration (7.7%)
- Accommodation & food services (6.2%)
- Construction (5.8%)
- Finance & insurance (4.7%)
- Professional, scientific, technical services (4.6%)
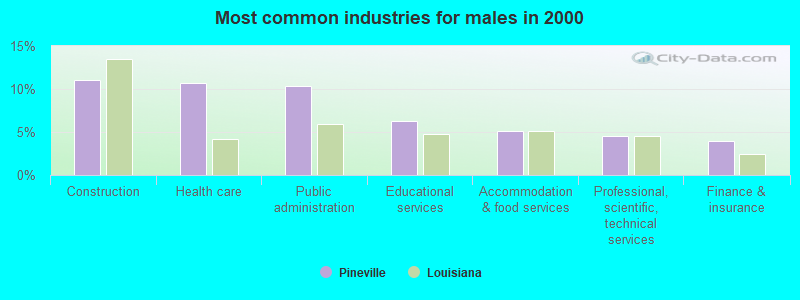
- Construction (11.0%)
- Health care (10.7%)
- Public administration (10.3%)
- Educational services (6.3%)
- Accommodation & food services (5.1%)
- Professional, scientific, technical services (4.5%)
- Finance & insurance (3.9%)
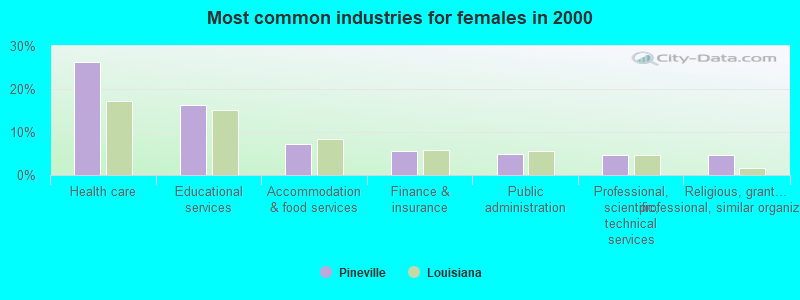
- Health care (26.3%)
- Educational services (16.2%)
- Accommodation & food services (7.3%)
- Finance & insurance (5.6%)
- Public administration (4.9%)
- Professional, scientific, technical services (4.7%)
- Religious, grantmaking, civic, professional, similar organizations (4.6%)
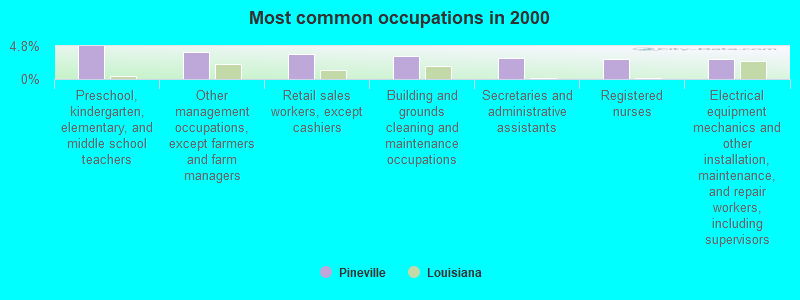
- Preschool, kindergarten, elementary, and middle school teachers (4.8%)
- Other management occupations, except farmers and farm managers (4.0%)
- Retail sales workers, except cashiers (3.7%)
- Building and grounds cleaning and maintenance occupations (3.3%)
- Secretaries and administrative assistants (3.1%)
- Registered nurses (3.0%)
- Electrical equipment mechanics and other installation, maintenance, and repair workers, including supervisors (2.9%)
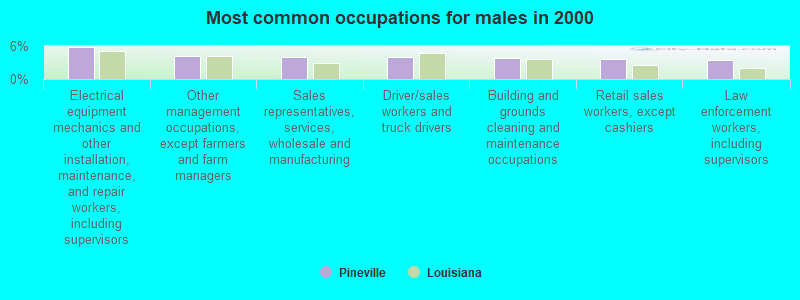
- Electrical equipment mechanics and other installation, maintenance, and repair workers, including supervisors (5.8%)
- Other management occupations, except farmers and farm managers (4.1%)
- Sales representatives, services, wholesale and manufacturing (4.0%)
- Driver/sales workers and truck drivers (4.0%)
- Building and grounds cleaning and maintenance occupations (3.8%)
- Retail sales workers, except cashiers (3.7%)
- Law enforcement workers, including supervisors (3.5%)
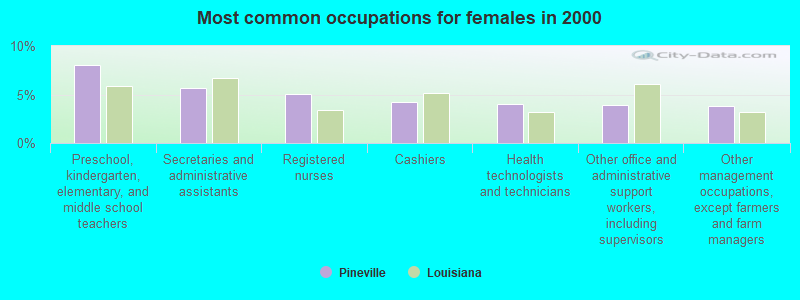
- Preschool, kindergarten, elementary, and middle school teachers (8.1%)
- Secretaries and administrative assistants (5.7%)
- Registered nurses (5.0%)
- Cashiers (4.2%)
- Health technologists and technicians (4.0%)
- Other office and administrative support workers, including supervisors (3.9%)
- Other management occupations, except farmers and farm managers (3.8%)
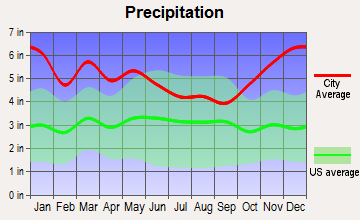
Average climate in Pineville, Louisiana
Based on data reported by over 4,000 weather stations


|
|


(lower is better)
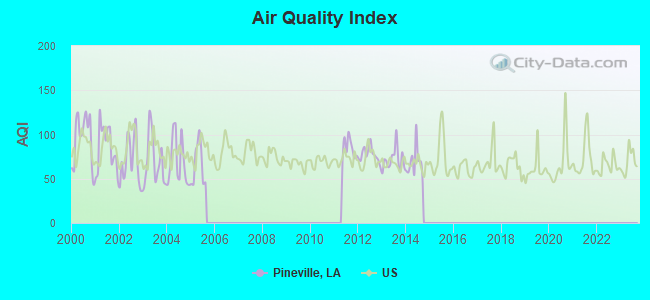
Air Quality Index (AQI) level in 2014 was 69.2. This is about average.
| City: | 69.2 |
| U.S.: | 72.6 |
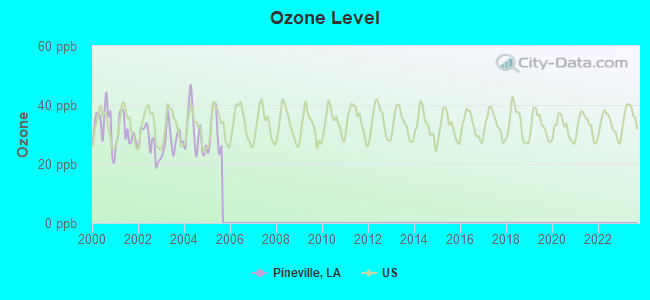
Ozone [ppb] level in 2005 was 30.9. This is about average. Closest monitor was 11.7 miles away from the city center.
| City: | 30.9 |
| U.S.: | 33.3 |
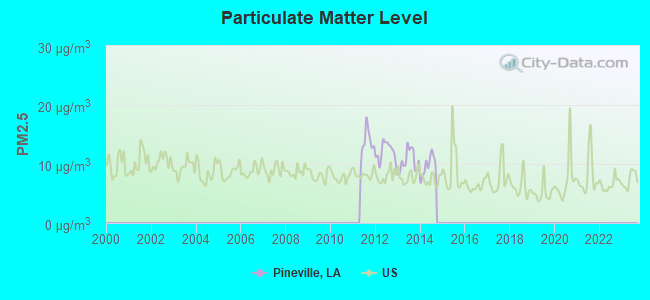
Particulate Matter (PM2.5) [µg/m3] level in 2014 was 9.74. This is worse than average. Closest monitor was 5.3 miles away from the city center.
| City: | 9.74 |
| U.S.: | 8.11 |
Tornado activity:
Pineville-area historical tornado activity is near Louisiana state average. It is 57% greater than the overall U.S. average.
On 6/5/1981, a category F3 (max. wind speeds 158-206 mph) tornado 1.5 miles away from the Pineville city center injured 10 people and caused between $500,000 and $5,000,000 in damages.
On 1/6/1951, a category F3 tornado 4.3 miles away from the city center injured 11 people and caused between $50,000 and $500,000 in damages.
Earthquake activity:
Pineville-area historical earthquake activity is significantly above Louisiana state average. It is 210% greater than the overall U.S. average.On 5/17/2012 at 08:12:00, a magnitude 4.8 (4.8 MW, Depth: 3.1 mi, Class: Light, Intensity: IV - V) earthquake occurred 122.2 miles away from the city center
On 11/6/2011 at 03:53:10, a magnitude 5.7 (5.7 MW, Depth: 3.2 mi, Class: Moderate, Intensity: VI - VII) earthquake occurred 383.6 miles away from the city center
On 9/2/2013 at 23:51:15, a magnitude 4.3 (4.3 MW, Depth: 2.9 mi) earthquake occurred 125.1 miles away from Pineville center
On 9/2/2013 at 21:52:38, a magnitude 4.2 (4.2 MW, Depth: 3.0 mi) earthquake occurred 131.8 miles away from the city center
On 1/25/2013 at 07:01:19, a magnitude 4.1 (4.1 MB, Depth: 3.1 mi) earthquake occurred 116.6 miles away from Pineville center
On 9/3/2016 at 12:02:44, a magnitude 5.8 (5.8 MW, Depth: 3.5 mi) earthquake occurred 436.9 miles away from the city center
Magnitude types: body-wave magnitude (MB), moment magnitude (MW)
Natural disasters:
The number of natural disasters in Rapides Parish (26) is a lot greater than the US average (15).Major Disasters (Presidential) Declared: 16
Emergencies Declared: 5
Causes of natural disasters: Floods: 10, Hurricanes: 10, Storms: 7, Tornadoes: 3, Tropical Storms: 2, Drought: 1, Fire: 1, Freeze: 1, Heavy Rain: 1, Other: 2 (Note: some incidents may be assigned to more than one category).

Main business address for: CLECO POWER LLC (ELECTRIC SERVICES), CLECO CORP (ELECTRIC SERVICES).
Hospitals in Pineville:
- ALEXANDRIA VA MEDICAL CENTER (Government Federal, provides emergency services, 2495 SHREVEPORT HIGHWAY 71 N)
- ANNA LANE COMMUNITY HOME (132 ANNA LANE)
- COUNTRY CLUB ROAD COMMUNITY HO (98 COUNTRY CLUB)
- EAST RIDGE COMMUNITY HOME (443 EAST RIDGE TRAIL)
- FENDLER PARKWAY COMMUNITY HOME (739 FENDLER PARKWAY)
- JUDE COMMUNITY HOME (2560 HICKORY HILL ROAD)
- LIVINGSTON ROAD COMMUNITY HOME (78 CAMP LIVINGSTON ROAD)
- PINECREST DEVELOPMENTAL CENTER (3400 MILITARY HIGHWAY)
- RIVER NORTH TREATMENT CENTER (5505 HWY 71 NORTH)
- WESLEYAN COMMUNITY HOME (1621 SUSEK DRIVE)
Airports and heliports located in Pineville:
- Pineville Municipal Airport (2L0) (Runways: 2, Itinerant Ops: 10,000, Local Ops: 15,000, Military Ops: 500)
- Camp Beauregard Army National Guard Heliport (18LA)
- Huey P Long Regional Medical Center Heliport (9LA5)
Colleges/Universities in Pineville:
Colleges/universities with over 2000 students nearest to Pineville:
- Northwestern State University of Louisiana (about 50 miles; Natchitoches, LA; Full-time enrollment: 7,700)
- Acadiana Technical College-Lafayette Campus (about 81 miles; Lafayette, LA; FT enrollment: 2,378)
- South Louisiana Community College (about 81 miles; Lafayette, LA; FT enrollment: 2,519)
- University of Louisiana at Lafayette (about 82 miles; Lafayette, LA; FT enrollment: 14,493)
- Louisiana Delta Community College (about 84 miles; Monroe, LA; FT enrollment: 3,168)
- Louisiana Tech University (about 84 miles; Ruston, LA; FT enrollment: 5,874)
- Alcorn State University (about 84 miles; Alcorn State, MS; FT enrollment: 3,479)
Public high schools in Pineville:
- PINEVILLE HIGH SCHOOL (Students: 1,234, Location: 1511 LINE STREET, Grades: 9-12)
- RAPIDES TRAINING ACADEMY (Location: 901 CREPE MYRTLE STREET, Grades: KG-12)
- PINECREST SUPPORTS & SERVICES CENTER (Location: 5191 PINECREST DR. OPC/DENTAL, Grades: KG-12)
- GATEWAY ADOLESCENT TREATMENT CENTER (Location: UNIT 6 MEADOW LANE, Grades: 6-12)
Public elementary/middle schools in Pineville:
- J.I. BARRON SR. ELEMENTARY SCHOOL (Students: 816, Location: 3655 HOLLOWAY ROAD, Grades: PK-6)
- PINEVILLE JUNIOR HIGH SCHOOL (Students: 610, Location: 501 EDGEWOOD DRIVE, Grades: 7-8)
- LESSIE MOORE ELEMENTARY SCHOOL (Students: 434, Location: 207 GRIFFITH STREET, Grades: PK-6)
- RUBY-WISE ELEMENTARY SCHOOL (Students: 423, Location: 5279 OLD MARKSVILLE HIGHWAY, Grades: PK-6)
- MARY GOFF ELEMENTARY SCHOOL (Students: 351, Location: 6900 SHREVEPORT HIGHWAY, Grades: PK-6)
- PINEVILLE ELEMENTARY SCHOOL (Students: 302, Location: 835 MAIN STREET, Grades: PK-6)
- TIOGA JUNIOR HIGH SCHOOL (Location: 1150 TIOGA ROAD, Grades: 7-8)
Private elementary/middle school in Pineville:
User-submitted facts and corrections:
- Please correct your listing to show the following: KTTP (1110 AM; daytime; 2 kW; PINEVILLE, LA; Owner: BENJAMIN-DANE, LLC)
Points of interest:
Notable locations in Pineville: Camp Beauregard (A), Pineville Junction (B), Pineville Fire Department Station 3 (C), Alexandria Hall (D), Pineville Community Recreation Center (E), Pineville Main Street Community Center (F), Pineville City Hall (G), Pineville Branch Rapides Parish Library (H), Pineville Civic Center (I), Pineville Fire Department Station 1 (J). Display/hide their locations on the map
Shopping Centers: Kings County Shopping Center (1), Layssard Shopping Center (2), Garden District Shopping Center (3), Edgewood Plaza Shopping Center (4), Pine Plaza Shopping Center (5), Pinebrook Square Shopping Center (6). Display/hide their locations on the map
Main business address in Pineville include: CLECO POWER LLC (A), CLECO CORP (B). Display/hide their locations on the map
Churches in Pineville include: The Church of Jesus Christ of Latter Day Saints (A), Zion Missionary Baptist Church (B), Jerusalem Baptist Church (C), Kingsville Baptist Church (D), Pineville Park Baptist Church (E), Antioch Church of God in Christ (F), Clear Run Baptist Church (G), Good Hope Baptist Church (H), Kingdom Hall of Jehovahs Witnesses (I). Display/hide their locations on the map
Cemeteries: Alexandria National Cemetery (1), Holly Oak Cemetery (2), Methodist Cemetery (3), Jewish Cemetery (4), Wesley Cemetery (5), Mount Olivet Cemetery (6), Bnai Israel Cemetery (7). Display/hide their locations on the map
Lakes: Pierson Lake (A), Lake Buhlow (B). Display/hide their locations on the map
Streams, rivers, and creeks: Spanish Bayou (A). Display/hide its location on the map
Parks in Pineville include: Pineville Soccer Park (1), Kees Park (2). Display/hide their locations on the map
Tourist attractions: Buhlow Fun Park (Amusement & Theme Parks; 1715 Monroe Highway), Skateville (5410 Highway 28 East).
Hotels: Pineville Days Inn (11 Lord Of Lords Ave), Sleep Inn - Inn & Suites (3411 US Highway 165).
Birthplace of: John K. Snyder - Soilder, Henry E. Hardtner - Politician, Anjanette Kirkland - Hurdler, Justin Gaston - Actor, Rashard Lewis - NBA player (Seattle SuperSonics, born: Aug 8, 1979), Cornelius Anthony - Football player, Eddie Culbert - College football player (Northwestern St. Demons), Frank Moreau - Football player, Jeffery Dale - Football player, Mark Duper - Football player.
Drinking water stations with addresses in Pineville and their reported violations in the past:
CITY OF PINEVILLE WATER SYSTEM (Population served: 20,315, Groundwater):Past health violations:KOLIN RUBY WISE WATERWORK DISTRICT 11 A (Population served: 4,302, Groundwater):Past monitoring violations:
- MCL, Monthly (TCR) - In JAN-2008, Contaminant: Coliform. Follow-up actions: St Violation/Reminder Notice (3 times from FEB-21-2008 to FEB-21-2008), St Public Notif requested (3 times from FEB-21-2008 to FEB-21-2008), St Public Notif received (APR-14-2008)
- Failure To Address Deficiency - In JAN-01-2012, Contaminant: GROUNDWATER RULE. Follow-up actions: St Public Notif received (JUN-28-2012)
- Monitoring and Reporting (DBP) - Between JUL-2010 and SEP-2010, Contaminant: Total Haloacetic Acids (HAA5). Follow-up actions: St Public Notif requested (JUL-28-2011), St Violation/Reminder Notice (JUL-28-2011), St Public Notif received (NOV-22-2011), St Compliance achieved (SEP-22-2014)
- Monitoring and Reporting (DBP) - Between JUL-2010 and SEP-2010, Contaminant: TTHM. Follow-up actions: St Public Notif requested (JUL-28-2011), St Violation/Reminder Notice (JUL-28-2011), St Public Notif received (NOV-22-2011), St Compliance achieved (SEP-22-2014)
Past monitoring violations:
- One regular monitoring violation
| This city: | 2.3 people |
| Louisiana: | 2.5 people |
| This city: | 60.4% |
| Whole state: | 67.1% |
| This city: | 6.8% |
| Whole state: | 6.8% |
Likely homosexual households (counted as self-reported same-sex unmarried-partner households)
- Lesbian couples: 0.5% of all households
- Gay men: 0.2% of all households
People in group quarters in Pineville in 2010:
- 586 people in state prisons
- 481 people in college/university student housing
- 233 people in nursing facilities/skilled-nursing facilities
- 53 people in residential treatment centers for adults
- 50 people in group homes intended for adults
- 19 people in group homes for juveniles (non-correctional)
- 11 people in military barracks and dormitories (nondisciplinary)
People in group quarters in Pineville in 2000:
- 668 people in homes for the mentally retarded
- 481 people in state prisons
- 466 people in college dormitories (includes college quarters off campus)
- 194 people in mental (psychiatric) hospitals or wards
- 190 people in nursing homes
- 76 people in homes or halfway houses for drug/alcohol abuse
- 9 people in hospitals/wards and hospices for chronically ill
- 9 people in other hospitals or wards for chronically ill
- 4 people in unknown juvenile institutions
Banks with most branches in Pineville (2011 data):
- Capital One, National Association: Tioga Branch, Pineville East Branch, Ball Branch. Info updated 2011/07/01: Bank assets: $133,477.8 mil, Deposits: $97,063.7 mil, headquarters in Mclean, VA, positive income, 984 total offices, Holding Company: Capital One Financial Corporation
- JPMorgan Chase Bank, National Association: Ball Branch, Edgewood Drive Branch, Tioga Branch. Info updated 2011/11/10: Bank assets: $1,811,678.0 mil, Deposits: $1,190,738.0 mil, headquarters in Columbus, OH, positive income, International Specialization, 5577 total offices, Holding Company: Jpmorgan Chase & Co.
- Regions Bank: Pine Creek Branch at 3201 Monroe Highway, branch established on 1972/03/23; Highway 28 East Branch at 3580 Highway 28 East, branch established on 1982/09/22. Info updated 2011/02/24: Bank assets: $123,368.2 mil, Deposits: $98,301.3 mil, headquarters in Birmingham, AL, positive income, Commercial Lending Specialization, 1778 total offices, Holding Company: Regions Financial Corporation
- The Evangeline Bank and Trust Company: Pineville Branch at 3403 Highway 28 East, branch established on 2008/03/17; Kings Country Branch at 3700 Monroe Highway, branch established on 2006/07/31. Info updated 2007/11/06: Bank assets: $579.6 mil, Deposits: $479.3 mil, headquarters in Ville Platte, LA, positive income, 9 total offices, Holding Company: Evangeline Bancshares, Inc.
- Red River Bank: North Rapides Banking Center Branch at 4425 Monroe Highway, branch established on 2001/05/25; Pineville Banking Center Branch at 3120 Highway 28 East, branch established on 1999/10/15. Info updated 2006/11/03: Bank assets: $989.5 mil, Deposits: $872.1 mil, headquarters in Alexandria, LA, positive income, Commercial Lending Specialization, 16 total offices, Holding Company: Red River Bancshares, Inc.
- Southern Heritage Bank: Pineville Branch at 3596 Highway 28 East, branch established on 2003/05/27; North Rapides Office Branch at 4617 Monroe Highway, branch established on 2001/09/05. Info updated 2006/11/03: Bank assets: $273.9 mil, Deposits: $239.0 mil, headquarters in Jonesville, LA, positive income, 9 total offices
- Bank of Jena: Holloway Branch at 12749 Highway 28 East, Suite D, branch established on 1997/06/16; Libuse Branch at 6408 Highway 28 East, branch established on 2001/11/07. Info updated 2006/11/03: Bank assets: $72.7 mil, Deposits: $64.9 mil, headquarters in Jena, LA, positive income, Commercial Lending Specialization, 5 total offices, Holding Company: Jbi Financial Corporation
- The Union Bank: Pineville Branch at 40 Pinecrest Drive, branch established on 2003/04/24. Info updated 2006/11/03: Bank assets: $228.4 mil, Deposits: $197.0 mil, headquarters in Marksville, LA, positive income, Commercial Lending Specialization, 10 total offices, Holding Company: Union Bancshares, Incorporated
- Sabine State Bank and Trust Company: Pineville Branch at 3524 Highway 28 East, branch established on 1998/03/02. Info updated 2006/09/14: Bank assets: $683.7 mil, Deposits: $592.9 mil, headquarters in Many, LA, positive income, Commercial Lending Specialization, 45 total offices, Holding Company: Sabine Bancshares, Inc.
- 4 other banks with 4 local branches
For population 15 years and over in Pineville:
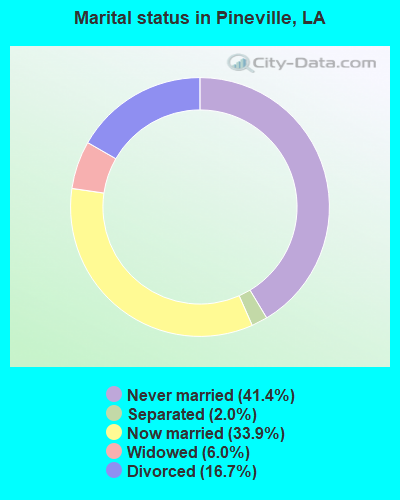
- Never married: 41.4%
- Now married: 33.9%
- Separated: 2.0%
- Widowed: 6.0%
- Divorced: 16.7%
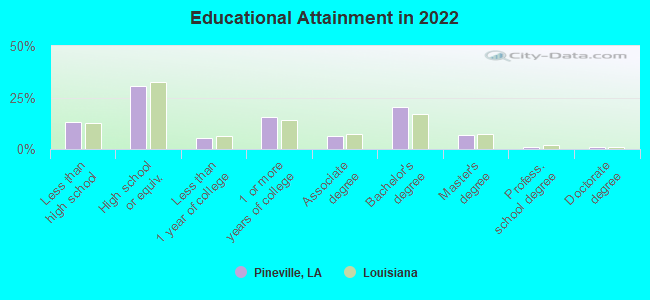
For population 25 years and over in Pineville:
- High school or higher: 87.5%
- Bachelor's degree or higher: 24.8%
- Graduate or professional degree: 7.1%
- Unemployed: 8.7%
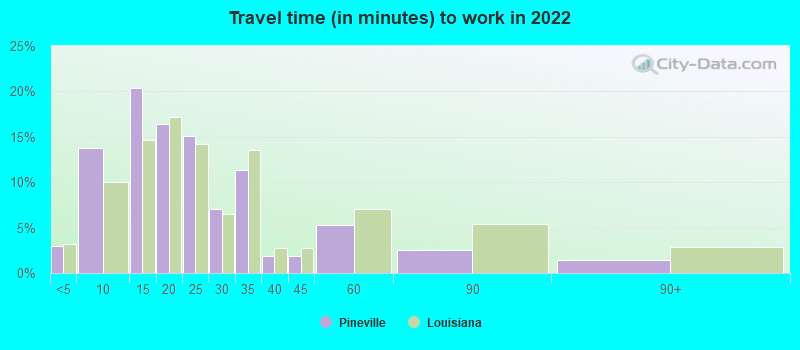
- Mean travel time to work (commute): 15.8 minutes
| Here: | 11.6 |
| Louisiana average: | 11.9 |
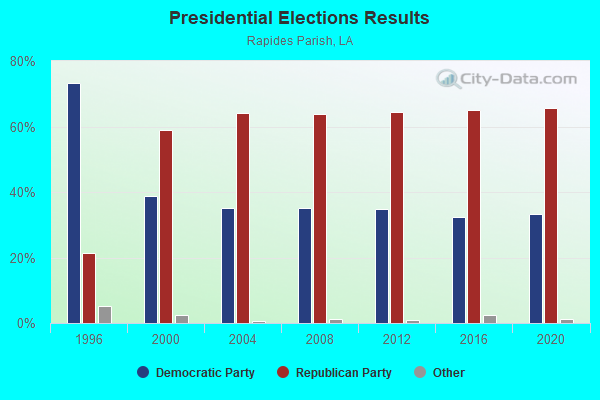
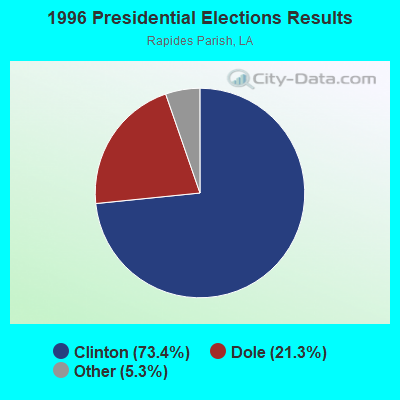
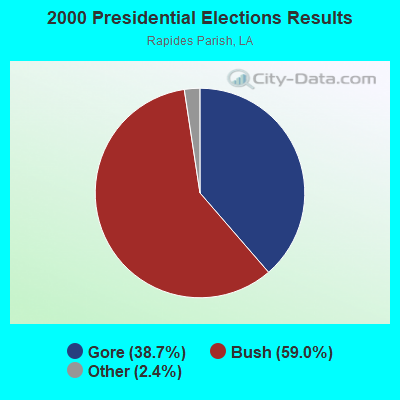
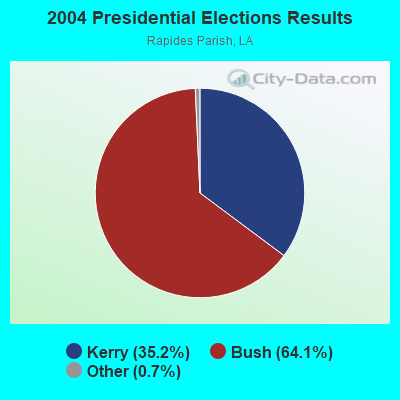
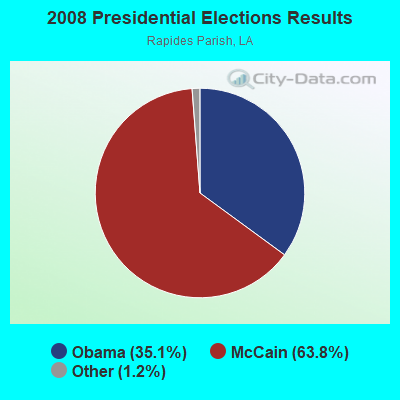

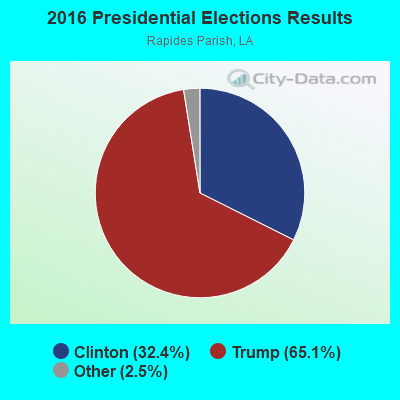
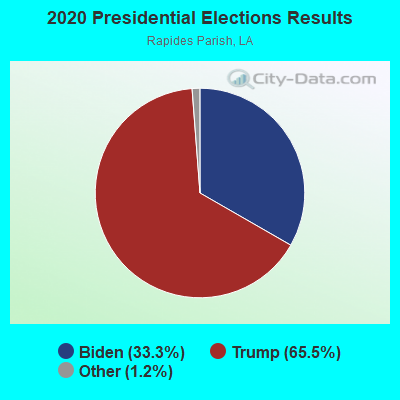
Graphs represent county-level data. Detailed 2008 Election Results
Religion statistics for Pineville, LA (based on Rapides Parish data)
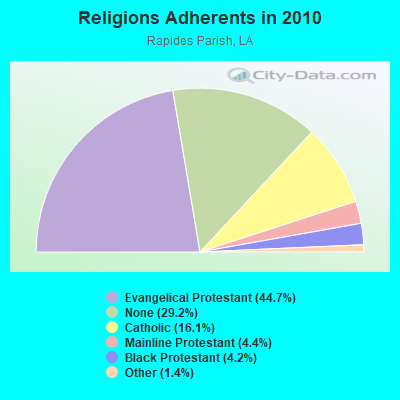
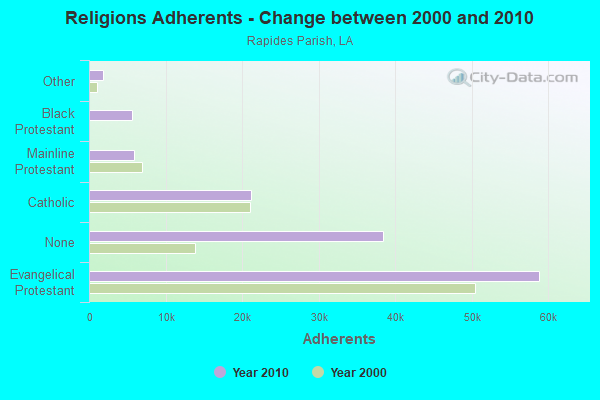
| Religion | Adherents | Congregations |
|---|---|---|
| Evangelical Protestant | 58,827 | 172 |
| Catholic | 21,160 | 20 |
| Mainline Protestant | 5,844 | 29 |
| Black Protestant | 5,561 | 23 |
| Other | 1,813 | 11 |
| None | 38,408 | - |
Food Environment Statistics:
| Rapides Parish: | 1.43 / 10,000 pop. |
| Louisiana: | 2.56 / 10,000 pop. |
| Rapides Parish: | 0.23 / 10,000 pop. |
| State: | 0.18 / 10,000 pop. |
| Here: | 1.05 / 10,000 pop. |
| Louisiana: | 1.29 / 10,000 pop. |
| This county: | 6.40 / 10,000 pop. |
| Louisiana: | 4.49 / 10,000 pop. |
| Here: | 4.21 / 10,000 pop. |
| Louisiana: | 5.92 / 10,000 pop. |
| Rapides Parish: | 11.7% |
| State: | 10.9% |
| This county: | 30.3% |
| State: | 29.2% |
| This county: | 10.2% |
| State: | 13.7% |
Health and Nutrition:
| Pineville: | 50.6% |
| Louisiana: | 49.4% |
| This city: | 48.1% |
| Louisiana: | 46.5% |
| Pineville: | 29.1 |
| State: | 29.1 |
| Pineville: | 20.0% |
| State: | 20.3% |
| Pineville: | 11.3% |
| State: | 11.4% |
| This city: | 6.8 |
| State: | 6.8 |
| Pineville: | 34.7% |
| Louisiana: | 34.5% |
| Pineville: | 57.3% |
| Louisiana: | 55.8% |
| Pineville: | 80.2% |
| State: | 80.2% |
More about Health and Nutrition of Pineville, LA Residents
| Local government employment and payroll (March 2022) | |||||
| Function | Full-time employees | Monthly full-time payroll | Average yearly full-time wage | Part-time employees | Monthly part-time payroll |
|---|---|---|---|---|---|
| Police Protection - Officers | 67 | $284,820 | $51,013 | 0 | $0 |
| Firefighters | 41 | $192,541 | $56,353 | 0 | $0 |
| Financial Administration | 26 | $94,368 | $43,554 | 0 | $0 |
| Solid Waste Management | 22 | $59,746 | $32,589 | 0 | $0 |
| Parks and Recreation | 18 | $43,534 | $29,023 | 8 | $8,747 |
| Water Supply | 14 | $38,617 | $33,100 | 0 | $0 |
| Natural Resources | 13 | $25,917 | $23,923 | 0 | $0 |
| Judicial and Legal | 12 | $36,902 | $36,902 | 3 | $2,763 |
| Other and Unallocable | 11 | $35,002 | $38,184 | 0 | $0 |
| Sewerage | 11 | $33,316 | $36,345 | 0 | $0 |
| Fire - Other | 9 | $47,101 | $62,801 | 0 | $0 |
| Other Government Administration | 9 | $45,769 | $61,025 | 0 | $0 |
| Police - Other | 7 | $33,147 | $56,823 | 6 | $9,687 |
| Housing and Community Development (Local) | 5 | $23,150 | $55,560 | 0 | $0 |
| Streets and Highways | 5 | $11,815 | $28,356 | 0 | $0 |
| Health | 3 | $6,312 | $25,248 | 0 | $0 |
| Totals for Government | 273 | $1,012,057 | $44,486 | 17 | $21,198 |
Pineville government finances - Expenditure in 2021 (per resident):
- Current Operations - Police Protection: $7,686,000 ($544.76)
Local Fire Protection: $5,808,000 ($411.65)
General Public Buildings: $2,453,000 ($173.86)
Water Utilities: $2,228,000 ($157.91)
Parks and Recreation: $1,742,000 ($123.47)
Solid Waste Management: $1,523,000 ($107.95)
Sewerage: $1,466,000 ($103.91)
Judicial and Legal Services: $887,000 ($62.87)
Central Staff Services: $683,000 ($48.41)
Housing and Community Development: $420,000 ($29.77)
Financial Administration: $300,000 ($21.26)
Regular Highways: $112,000 ($7.94)
- General - Interest on Debt: $179,000 ($12.69)
- Intergovernmental to Local - Other - Housing and Community Development: $19,000 ($1.35)
- Other Capital Outlay - Police Protection: $117,000 ($8.29)
Parks and Recreation: $71,000 ($5.03)
Local Fire Protection: $25,000 ($1.77)
Central Staff Services: $21,000 ($1.49)
Judicial and Legal Services: $6,000 ($0.43)
- Total Salaries and Wages: $336,000 ($23.81)
Pineville government finances - Revenue in 2021 (per resident):
- Charges - Housing and Community Development: $337,000 ($23.89)
Parks and Recreation: $31,000 ($2.20)
- Federal Intergovernmental - Housing and Community Development: $1,542,000 ($109.29)
- Miscellaneous - General Revenue - Other: $1,067,000 ($75.63)
Fines and Forfeits: $327,000 ($23.18)
Interest Earnings: $5,000 ($0.35)
- State Intergovernmental - Highways: $2,956,000 ($209.51)
Water Utilities: $535,000 ($37.92)
- Tax - General Sales and Gross Receipts: $12,066,000 ($855.20)
Property: $1,633,000 ($115.74)
Occupation and Business License - Other: $402,000 ($28.49)
Pineville government finances - Debt in 2021 (per resident):
- Long Term Debt - Beginning Outstanding - Unspecified Public Purpose: $4,858,000 ($344.32)
Outstanding Unspecified Public Purpose: $4,044,000 ($286.63)
Retired Unspecified Public Purpose: $814,000 ($57.69)
Pineville government finances - Cash and Securities in 2021 (per resident):
- Bond Funds - Cash and Securities: $591,000 ($41.89)
- Other Funds - Cash and Securities: $8,175,000 ($579.42)
| Businesses in Pineville, LA | ||||
| Name | Count | Name | Count | |
|---|---|---|---|---|
| AT&T | 1 | Little Caesars Pizza | 1 | |
| Ace Hardware | 1 | Lowe's | 1 | |
| Advance Auto Parts | 1 | MasterBrand Cabinets | 3 | |
| Arby's | 1 | Maurices | 1 | |
| AutoZone | 2 | McDonald's | 2 | |
| Blockbuster | 1 | Papa John's Pizza | 1 | |
| Burger King | 2 | Pizza Hut | 1 | |
| CVS | 1 | Popeyes | 2 | |
| Circle K | 3 | RadioShack | 1 | |
| Dairy Queen | 1 | Rue21 | 1 | |
| Days Inn | 1 | Ryan's Grill | 1 | |
| Decora Cabinetry | 1 | SONIC Drive-In | 2 | |
| Domino's Pizza | 1 | Sears | 1 | |
| FedEx | 8 | Sleep Inn | 1 | |
| Firestone Complete Auto Care | 1 | Subway | 4 | |
| GNC | 1 | Taco Bell | 1 | |
| GameStop | 1 | True Value | 1 | |
| Goodwill | 2 | U-Haul | 1 | |
| H&R Block | 2 | UPS | 3 | |
| KFC | 1 | Walgreens | 2 | |
| Kmart | 1 | Walmart | 1 | |
| La-Z-Boy | 1 | Wendy's | 1 | |
| Lane Furniture | 1 | |||
Strongest AM radio stations in Pineville:
- KJMJ (580 AM; 5 kW; ALEXANDRIA, LA; Owner: RADIO MARIA, INC.)
- KWDF (840 AM; daytime; 8 kW; BALL, LA; Owner: BALL BROADCASTING CO.)
- KTTP (1110 AM; daytime; 2 kW; PINEVILLE, LA; Owner: PEOPLES BROADCAST NETWORK LLC)
- KSYL (970 AM; 1 kW; ALEXANDRIA, LA; Owner: CENLA B/C CO INC.)
- KDBS (1410 AM; 1 kW; ALEXANDRIA, LA; Owner: CAPSTAR TX LIMITED PARTNERSHIP)
- KEEL (710 AM; 50 kW; SHREVEPORT, LA; Owner: CITICASTERS LICENSES, L.P.)
- KWKH (1130 AM; 50 kW; SHREVEPORT, LA; Owner: CITICASTERS LICENSES, L.P.)
- WSJC (810 AM; 50 kW; MAGEE, MS; Owner: FAMILY TALK RADIO)
- KTRH (740 AM; 50 kW; HOUSTON, TX; Owner: AMFM TEXAS LICENSES LIMITED PARTNERSHIP)
- WWL (870 AM; 50 kW; NEW ORLEANS, LA; Owner: ENTERCOM NEW ORLEANS LICENSE, LLC)
- WJNT (1180 AM; 50 kW; PEARL, MS; Owner: BUCHANAN BROADCASTING CO., INC.)
- WLNO (1060 AM; 50 kW; NEW ORLEANS, LA; Owner: COMMUNICOM CO. OF LOUISIANA, L.P.)
- WOMN (1110 AM; daytime; 30 kW; FRANKLINTON, LA; Owner: PITTMAN BROADCASTING SERVICES, LLC.)
Strongest FM radio stations in Pineville:
- KRRV-FM (100.3 FM; ALEXANDRIA, LA; Owner: CAPSTAR TX LIMITED PARTNERSHIP)
- KEDG (106.9 FM; ALEXANDRIA, LA; Owner: FLINN BROADCASTING CORPORATION)
- K288ER (105.5 FM; ALEXANDRIA, LA; Owner: BIBLE BROADCASTING NETWORK, INC.)
- KOUZ (89.9 FM; ALEXANDRIA, LA; Owner: FAMILY LIFE EDUCATIONAL FOUNDATION)
- KFAD (93.9 FM; ALEXANDRIA, LA; Owner: FM BROADCASTING CORPORATION)
- KAPM (91.7 FM; ALEXANDRIA, LA; Owner: AMERICAN FAMILY ASSOCIATION)
- KHFX (105.5 FM; BALL, LA; Owner: CAJUN COMMUNICATIONS OF TEXAS, INC.)
- KLSA (90.7 FM; ALEXANDRIA, LA; Owner: BD OF SUPV OF LA ST U & A&M COLLEGE)
- KZMZ (96.9 FM; ALEXANDRIA, LA; Owner: CAPSTAR TX LIMITED PARTNERSHIP)
- KQID-FM (93.1 FM; ALEXANDRIA, LA; Owner: CENLA B/C CO INC.)
- KAYT (88.1 FM; JENA, LA; Owner: BLACK MEDIA WORKS, INC.)
- KKST (98.7 FM; OAKDALE, LA; Owner: CAPSTAR TX LIMITED PARTNERSHIP)
- KBCE (102.3 FM; BOYCE, LA; Owner: TRINITY BROADCASTING CORPORATION)
- KCJM-LP (107.9 FM; ALEXANDRIA, LA; Owner: M&M COMMUNITY DEVELOPMENT INC., ALEXANDRIA BRANCH)
- KLAA (103.5 FM; TIOGA, LA; Owner: CAJUN COMMUNICATIONS OF TEXAS, INC.)
- WQNZ (95.1 FM; NATCHEZ, MS; Owner: FIRST NATCHEZ CORPORATION)
- KVDP (89.1 FM; DRY PRONG, LA; Owner: DRY PRONG EDUC B/C FOUNDATION)
- KAPB-FM (97.7 FM; MARKSVILLE, LA; Owner: THREE RIVERS RADIO COMPANY)
TV broadcast stations around Pineville:
- K36DS (Channel 36; ALEXANDRIA, LA; Owner: POLLACK/BELZ COMMUNICATION COMPANY, INC.)
- KALB-TV (Channel 5; ALEXANDRIA, LA; Owner: MEDIA GENERAL COMMUNICATIONS, INC.)
- K60GE (Channel 60; ALEXANDRIA, LA; Owner: MS COMMUNICATIONS, LLC)
- K16DK (Channel 16; ALEXANDRIA, LA; Owner: MS COMMUNICATIONS, LLC)
- K23DZ (Channel 23; ALEXANDRIA, LA; Owner: MS COMMUNICATIONS, LLC)
- K38EG (Channel 38; ALEXANDRIA, LA; Owner: MS COMMUNICATIONS, LLC)
- K55GT (Channel 55; ALEXANDRIA, LA; Owner: MS COMMUNICATIONS, LLC)
- K02PO (Channel 2; ALEXANDRIA, LA; Owner: TIGER EYE BROADCASTING CORPORATION)
- K21EL (Channel 21; ALEXANDRIA, LA; Owner: MS COMMUNICATIONS, LLC)
- K43EI (Channel 43; ALEXANDRIA, LA; Owner: MS COMMUNICATIONS, LLC)
- K57GK (Channel 57; ALEXANDRIA, LA; Owner: MS COMMUNICATIONS, LLC)
- K53FA (Channel 53; ALEXANDRIA, LA; Owner: ESTATE OF VIOLA WEBER)
- K47DW (Channel 47; ALEXANDRIA, LA; Owner: WHITE KNIGHT B/CING. OF NATCHEZ LICENSE CORP.)
- K64FT (Channel 64; ALEXANDRIA, LA; Owner: TRINITY BROADCASTING NETWORK)
- KLAX-TV (Channel 31; ALEXANDRIA, LA; Owner: POLLACK/BELZ COMMUNICATIONS CO., INC)
- KLPA-TV (Channel 25; ALEXANDRIA, LA; Owner: LOUISIANA EDUCATIONAL TELEVISION AUTHORITY)
- KAQY (Channel 11; COLUMBIA, LA; Owner: MONROE BROADCASTING, INC.)
- National Bridge Inventory (NBI) Statistics
- 79Number of bridges
- 2,156ft / 657mTotal length
- $23,852,000Total costs
- 888,612Total average daily traffic
- 57,973Total average daily truck traffic
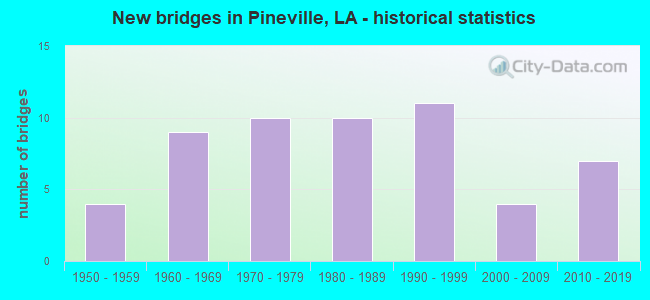
- New bridges - historical statistics
- 41950-1959
- 91960-1969
- 101970-1979
- 101980-1989
- 111990-1999
- 42000-2009
- 72010-2019
FCC Registered Antenna Towers: 310 (See the full list of FCC Registered Antenna Towers)
FCC Registered Private Land Mobile Towers: 5 (See the full list of FCC Registered Private Land Mobile Towers in Pineville, LA)
FCC Registered Broadcast Land Mobile Towers: 18 (See the full list of FCC Registered Broadcast Land Mobile Towers)
FCC Registered Microwave Towers: 23 (See the full list of FCC Registered Microwave Towers in this town)
FCC Registered Paging Towers: 3 (See the full list of FCC Registered Paging Towers)
FCC Registered Maritime Coast & Aviation Ground Towers: 2 (See the full list of FCC Registered Maritime Coast & Aviation Ground Towers)
FCC Registered Amateur Radio Licenses: 208 (See the full list of FCC Registered Amateur Radio Licenses in Pineville)
FAA Registered Aircraft Manufacturers and Dealers: 3 (See the full list of FAA Registered Manufacturers and Dealers in Pineville)
FAA Registered Aircraft: 40 (See the full list of FAA Registered Aircraft)
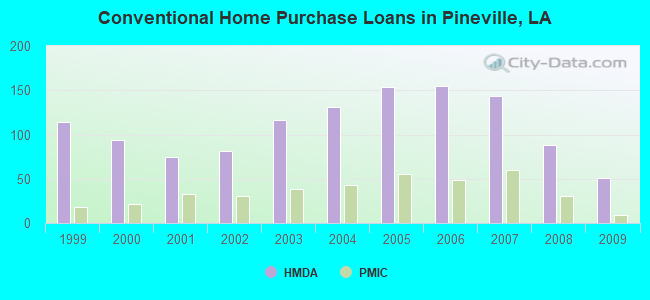
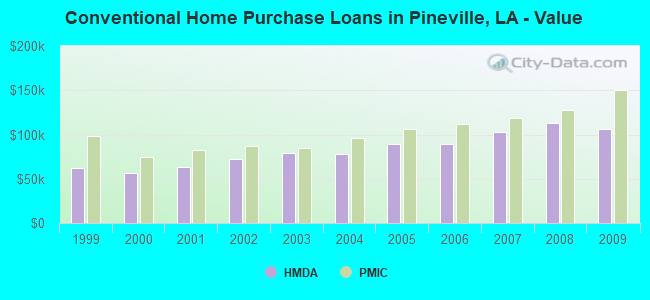
| Home Mortgage Disclosure Act Aggregated Statistics For Year 2009 (Based on 1 full and 5 partial tracts) | ||||||||||||||
| A) FHA, FSA/RHS & VA Home Purchase Loans | B) Conventional Home Purchase Loans | C) Refinancings | D) Home Improvement Loans | E) Loans on Dwellings For 5+ Families | F) Non-occupant Loans on < 5 Family Dwellings (A B C & D) | G) Loans On Manufactured Home Dwelling (A B C & D) | ||||||||
|---|---|---|---|---|---|---|---|---|---|---|---|---|---|---|
| Number | Average Value | Number | Average Value | Number | Average Value | Number | Average Value | Number | Average Value | Number | Average Value | Number | Average Value | |
| LOANS ORIGINATED | 53 | $136,554 | 51 | $106,603 | 127 | $134,667 | 23 | $48,864 | 6 | $563,443 | 42 | $102,174 | 6 | $32,197 |
| APPLICATIONS APPROVED, NOT ACCEPTED | 5 | $147,824 | 4 | $133,705 | 9 | $108,648 | 1 | $3,460 | 0 | $0 | 2 | $56,925 | 1 | $54,640 |
| APPLICATIONS DENIED | 9 | $125,621 | 8 | $71,840 | 48 | $127,934 | 16 | $15,911 | 0 | $0 | 3 | $52,733 | 4 | $38,250 |
| APPLICATIONS WITHDRAWN | 5 | $95,510 | 4 | $102,725 | 25 | $138,104 | 1 | $8,940 | 0 | $0 | 3 | $53,250 | 2 | $23,775 |
| FILES CLOSED FOR INCOMPLETENESS | 0 | $0 | 1 | $16,290 | 9 | $171,426 | 1 | $20,210 | 0 | $0 | 0 | $0 | 1 | $15,900 |
Detailed HMDA statistics for the following Tracts: 0113.00 , 0114.00, 0115.00, 0116.00, 0117.00, 0131.00
| Private Mortgage Insurance Companies Aggregated Statistics For Year 2009 (Based on 1 full and 3 partial tracts) | ||||
| A) Conventional Home Purchase Loans | B) Refinancings | |||
|---|---|---|---|---|
| Number | Average Value | Number | Average Value | |
| LOANS ORIGINATED | 9 | $149,876 | 3 | $149,813 |
| APPLICATIONS APPROVED, NOT ACCEPTED | 3 | $165,333 | 0 | $0 |
| APPLICATIONS DENIED | 2 | $128,845 | 6 | $150,598 |
| APPLICATIONS WITHDRAWN | 0 | $0 | 0 | $0 |
| FILES CLOSED FOR INCOMPLETENESS | 0 | $0 | 0 | $0 |
Detailed PMIC statistics for the following Tracts: 0113.00 , 0114.00, 0115.00, 0116.00, 0117.00, 0131.00
2002 - 2018 National Fire Incident Reporting System (NFIRS) incidents
- Fire incident types reported to NFIRS in Pineville, LA
- 1,61649.6%Outside Fires
- 1,09133.5%Structure Fires
- 33010.1%Mobile Property/Vehicle Fires
- 2196.7%Other
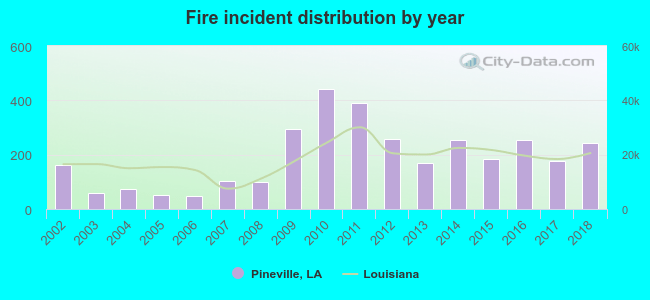 Based on the data from the years 2002 - 2018 the average number of fire incidents per year is 192. The highest number of reported fires - 441 took place in 2010, and the least - 47 in 2006. The data has a rising trend.
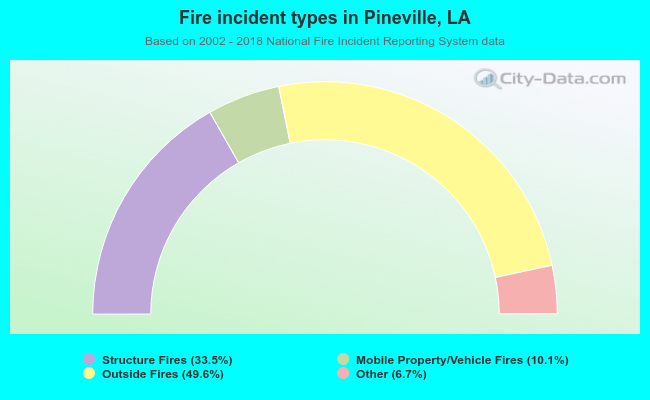 When looking into fire subcategories, the most reports belonged to: Outside Fires (49.6%), and Structure Fires (33.5%).
Fire-safe hotels and motels in Pineville, Louisiana:
- Sleep Inn & Suites Pineville, 3411 Hwy 165, Pineville, Louisiana 71360 , Phone: (318) 640-8505, Fax: (318) 640-3405
- Days Inn, 11 Lord Of Lords Ave, Pineville, Louisiana 71360 , Phone: (318) 640-5818, Fax: (318) 640-5818
- Country Inn & Suites By Carlson-Pineville La, 2727 Monroe Hwy, Pineville, Louisiana 71360 , Phone: (318) 641-8332, Fax: (318) 445-5530
- Holiday Inn Express, 2820 Monroe Hwy, Pineville, Louisiana 71360 , Phone: (800) 465-4329
- Holiday Inn Express & Suites, 2820 Monroe Hwy, Pineville, Louisiana 71360 , Phone: (318) 704-6700, Fax: (318) 704-6767
| Most common first names in Pineville, LA among deceased individuals | ||
| Name | Count | Lived (average) |
|---|---|---|
| James | 219 | 70.1 years |
| John | 188 | 70.2 years |
| Mary | 178 | 77.0 years |
| William | 160 | 72.8 years |
| Robert | 157 | 66.2 years |
| Joseph | 90 | 72.8 years |
| Willie | 90 | 72.9 years |
| Henry | 90 | 72.7 years |
| Charles | 89 | 69.4 years |
| George | 84 | 73.2 years |
| Most common last names in Pineville, LA among deceased individuals | ||
| Last name | Count | Lived (average) |
|---|---|---|
| Smith | 148 | 76.0 years |
| Williams | 124 | 72.6 years |
| Johnson | 106 | 74.1 years |
| Jones | 85 | 71.0 years |
| White | 57 | 72.0 years |
| Miller | 56 | 72.3 years |
| Bordelon | 54 | 73.0 years |
| Brown | 53 | 69.0 years |
| Clark | 49 | 70.9 years |
| Davis | 49 | 72.2 years |
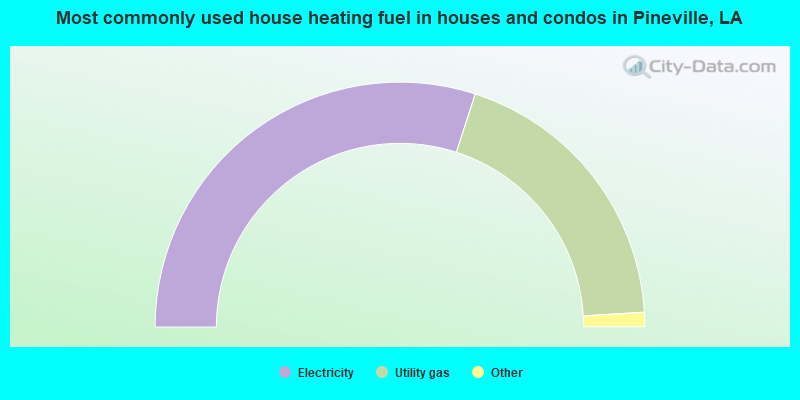
- 62.8%Electricity
- 34.7%Utility gas
- 1.6%Bottled, tank, or LP gas
- 0.9%No fuel used
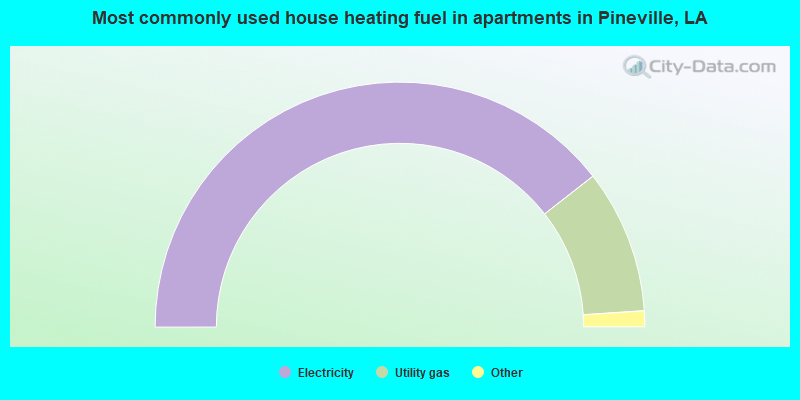
- 78.9%Electricity
- 19.0%Utility gas
- 1.3%No fuel used
- 0.5%Wood
- 0.2%Bottled, tank, or LP gas
Pineville compared to Louisiana state average:
- Unemployed percentage below state average.
- Hispanic race population percentage below state average.
- Median age below state average.
- Foreign-born population percentage significantly below state average.
- Renting percentage above state average.
- Institutionalized population percentage above state average.
Pineville on our top lists:
- #13 on the list of "Top 101 cities with the largest percentage of people in homes for the mentally retarded (population 1,000+)"
- #43 on the list of "Top 101 cities with largest percentage of females in industries: utilities (population 5,000+)"
- #50 on the list of "Top 101 cities with the largest percentage of people in mental (psychiatric) hospitals or wards (population 1,000+)"
- #6 on the list of "Top 101 counties with the highest percentage of residents that keep firearms around their homes"
- #8 on the list of "Top 101 counties with the lowest percentage of residents that drank alcohol in the past 30 days"
- #33 on the list of "Top 101 counties with the lowest percentage of residents that exercised in the past month"
- #35 on the list of "Top 101 counties with the lowest percentage of residents relocating to foreign countries in 2011 (pop. 50,000+)"
- #37 on the list of "Top 101 counties with the worst general health status score of residents (1-5), 3 years of data"

|
|
Total of 19 patent applications in 2008-2025.