Wyoming, Michigan

Wyoming: Wyoming Public Library

Wyoming: New Metropolitan Hospital Under Construction at Wyoming's New Metro Health Village

Wyoming: Wyoming Public Library Entrance
- add
your
Submit your own pictures of this city and show them to the world
- OSM Map
- General Map
- Google Map
- MSN Map

Population change since 2000: +10.6%
| Males: 39,917 | |
| Females: 36,809 |
| Median resident age: | 34.4 years |
| Michigan median age: | 40.5 years |
Zip codes: 49519.
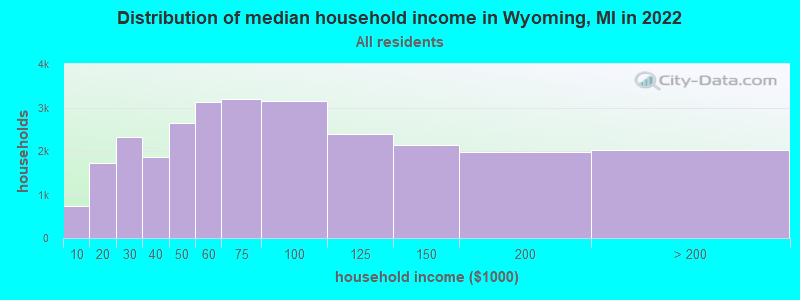
| Wyoming: | $73,950 |
| MI: | $69,183 |
Estimated per capita income in 2023: $34,507 (it was $19,287 in 2000)
Wyoming city income, earnings, and wages data
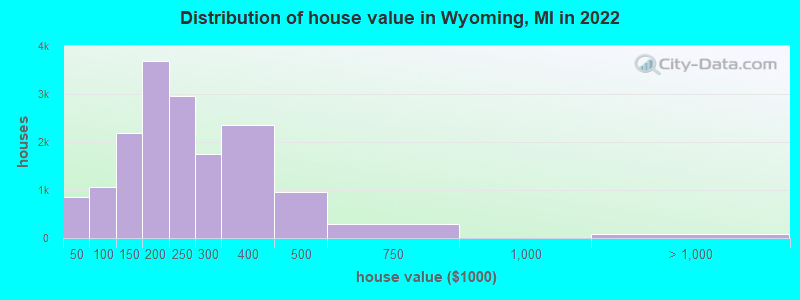
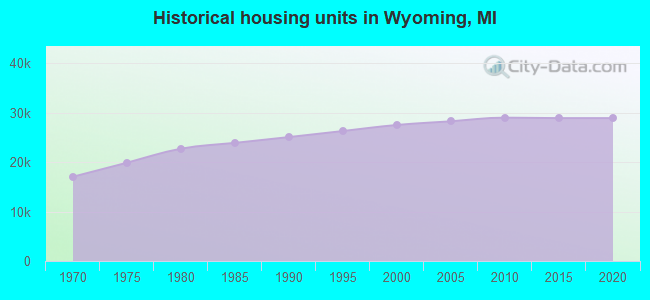
Estimated median house or condo value in 2023: $235,000 (it was $91,700 in 2000)
| Wyoming: | $235,000 |
| MI: | $236,100 |
Mean prices in 2023: all housing units: $243,693; detached houses: $253,328; townhouses or other attached units: $225,285; in 2-unit structures: $350,661; in 3-to-4-unit structures: $132,669; in 5-or-more-unit structures: $144,486; mobile homes: $42,404
Median gross rent in 2023: $1,258.
(5.6% for White Non-Hispanic residents, 21.5% for Black residents, 19.3% for Hispanic or Latino residents, 23.0% for American Indian residents, 18.4% for other race residents, 16.0% for two or more races residents)
Detailed information about poverty and poor residents in Wyoming, MI


Compare current foreclosures in Wyoming, MI:
| Photo | Address | Area | Beds / Baths | Price | Details |
|---|---|---|---|---|---|

|
#1
40th St SW
Wyoming, MI 49509
|
1,362 sq. feet
|
1 baths 3 beds |
show details | |

|
#2
Taft Ave SW
Wyoming, MI 49519
|
- sq. feet
|
1 baths 3 beds |
show details | |

|
#3
Prairie Pkwy SW # 406
Wyoming, MI 49509
|
- sq. feet
|
- baths - beds |
show details | |

|
#4
Crooked Tree Rd Sw, Apt 8
Wyoming, MI 49519
|
- sq. feet
|
- baths - beds |
show details | |

|
#5
Brian Dr SW # 68
Wyoming, MI 49509
|
- sq. feet
|
- baths - beds |
show details | |

|
#6
Woodlake Rd SW
Wyoming, MI 49519
|
- sq. feet
|
- baths - beds |
show details | |

|
#7
Quebec Ave SW
Wyoming, MI 49519
|
- sq. feet
|
- baths - beds |
show details | |

|
#8
Clyde Park Ave SW Apt 12
Wyoming, MI 49509
|
- sq. feet
|
- baths - beds |
show details | |

|
#9
Havana Ave SW
Wyoming, MI 49509
|
- sq. feet
|
- baths - beds |
show details | |

|
#10
R W Berends Dr Sw, Apt 5
Wyoming, MI 49519
|
- sq. feet
|
- baths - beds |
show details |
| Photo | Address | Area | Beds / Baths | Price | Details |
|---|---|---|---|---|---|

|
#11
Oak Valley Ave SW
Wyoming, MI 49519
|
- sq. feet
|
- baths - beds |
show details | |

|
#12
Prairie Pkwy SW # 208
Wyoming, MI 49509
|
- sq. feet
|
- baths - beds |
show details | |

|
#13
Clyde Park Ave SW Apt 10
Wyoming, MI 49509
|
- sq. feet
|
- baths - beds |
show details | |

|
#14
Royal Oak St SW
Wyoming, MI 49509
|
- sq. feet
|
- baths - beds |
show details | |

|
#15
Ridgeland Ct SW
Wyoming, MI 49519
|
- sq. feet
|
- baths - beds |
show details | |

|
#16
Clyde Park Ave SW # 220
Wyoming, MI 49509
|
- sq. feet
|
- baths - beds |
show details | |

|
#17
Charlesgate Ave SW
Wyoming, MI 49509
|
- sq. feet
|
- baths - beds |
show details | |

|
#18
Avon Ave SW
Wyoming, MI 49519
|
- sq. feet
|
- baths - beds |
show details | |

|
#19
De Laat Ave SW
Wyoming, MI 49519
|
- sq. feet
|
- baths - beds |
show details | |

|
#20
S Oakvale Ct SW
Wyoming, MI 49519
|
- sq. feet
|
- baths - beds |
show details |
| Photo | Address | Area | Beds / Baths | Price | Details |
|---|---|---|---|---|---|

|
#21
Raven Ave SW
Wyoming, MI 49509
|
- sq. feet
|
- baths - beds |
show details | |

|
#22
Berkley Ave SW
Wyoming, MI 49509
|
- sq. feet
|
- baths - beds |
show details | |

|
#23
Michael Ave SW
Wyoming, MI 49509
|
- sq. feet
|
- baths - beds |
show details | |

|
#24
Flamingo Ave SW
Wyoming, MI 49509
|
- sq. feet
|
- baths - beds |
show details | |

|
#25
Beech St SW
Wyoming, MI 49509
|
- sq. feet
|
- baths - beds |
show details | |

|
#26
Chableau Ct SW
Wyoming, MI 49519
|
- sq. feet
|
- baths - beds |
show details | |

|
#27
Burlingame Ave SW
Wyoming, MI 49509
|
- sq. feet
|
- baths - beds |
show details | |

|
#28
Royal Oak St SW
Wyoming, MI 49509
|
- sq. feet
|
- baths - beds |
show details | |

|
#29
34th St SW
Wyoming, MI 49509
|
- sq. feet
|
- baths - beds |
show details | |

|
#30
Clyde Park Ave SW
Wyoming, MI 49509
|
- sq. feet
|
- baths - beds |
show details |
| Photo | Address | Area | Beds / Baths | Price | Details |
|---|---|---|---|---|---|

|
#31
Galewood Ave SW
Wyoming, MI 49509
|
- sq. feet
|
- baths - beds |
show details | |

|
#32
Havana Ave SW
Wyoming, MI 49509
|
- sq. feet
|
- baths - beds |
show details | |

|
#33
Illinois Ave SW
Wyoming, MI 49509
|
- sq. feet
|
- baths - beds |
show details | |

|
#34
Rathbone St SW
Wyoming, MI 49509
|
- sq. feet
|
- baths - beds |
show details | |

|
#35
De Laat Ave SW
Wyoming, MI 49519
|
- sq. feet
|
- baths - beds |
show details | |

|
#36
Michael Ave SW
Wyoming, MI 49509
|
- sq. feet
|
- baths - beds |
show details | |

|
#37
Wyoming Ave SW
Wyoming, MI 49519
|
- sq. feet
|
- baths - beds |
show details | |

|
#38
33rd St SW
Wyoming, MI 49509
|
- sq. feet
|
- baths - beds |
show details | |

|
#39
Den Hertog St SW
Wyoming, MI 49509
|
- sq. feet
|
- baths - beds |
show details | |

|
#40
Burlingame Ave SW
Wyoming, MI 49509
|
- sq. feet
|
- baths - beds |
show details |
| Photo | Address | Area | Beds / Baths | Price | Details |
|---|---|---|---|---|---|

|
#41
Flamingo Ave SW
Wyoming, MI 49509
|
- sq. feet
|
- baths - beds |
show details | |

|
#42
Byron Center Ave SW
Wyoming, MI 49519
|
- sq. feet
|
- baths - beds |
show details | |

|
Check over 1 million property listings on Foreclosure.com!
|
browse all offers | |||


- 43,85456.6%White alone
- 19,77325.5%Hispanic
- 7,0389.1%Black alone
- 4,5855.9%Two or more races
- 1,6242.1%Asian alone
- 4610.6%Other race alone
- 1170.2%American Indian alone
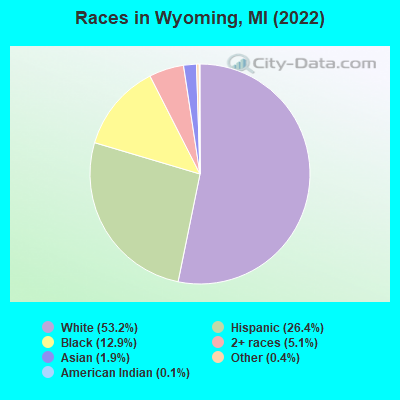
Races in Wyoming detailed stats: ancestries, foreign born residents, place of birth
According to our research of Michigan and other state lists, there were 293 registered sex offenders living in Wyoming, Michigan as of May 09, 2025.
The ratio of all residents to sex offenders in Wyoming is 258 to 1.
The ratio of registered sex offenders to all residents in this city is near the state average.
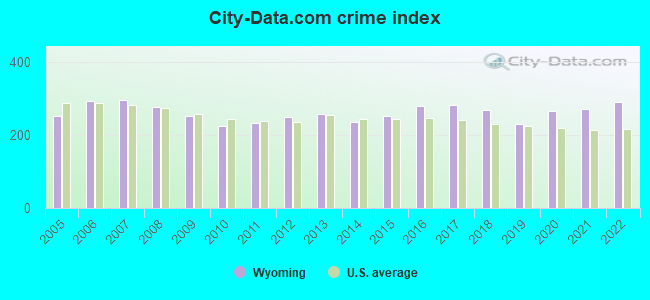
The City-Data.com crime index weighs serious crimes and violent crimes more heavily. Higher means more crime, U.S. average is 240.7. It adjusts for the number of visitors and daily workers commuting into cities.
- means the value is smaller than the state average.- means the value is about the same as the state average.
- means the value is bigger than the state average.
- means the value is much bigger than the state average.
Crime rate in Wyoming detailed stats: murders, rapes, robberies, assaults, burglaries, thefts, arson
Full-time law enforcement employees in 2023, including police officers: 107 (94 officers - 81 male; 13 female).
| Officers per 1,000 residents here: | 1.23 |
| Michigan average: | 1.83 |
 Recent articles from our blog. Our writers, many of them Ph.D. graduates or candidates, create easy-to-read articles on a wide variety of topics.

 | Safe suburbs in Grand Rapids (5 replies) |
| Wyoming MI (3 replies) |
| Grand Rapids affordability for the retired? (2 replies) |
| 2020 Census: GR Metro breakdown (14 replies) |
| Why Didn't Grand Rapids Decline? (74 replies) |
| How long before They hit the annex button ? (3 replies) |
Latest news from Wyoming, MI collected exclusively by city-data.com from local newspapers, TV, and radio stations
Ancestries: Dutch (14.8%), German (8.1%), American (4.4%), English (3.9%), Italian (2.8%), Irish (2.8%).
Current Local Time: EST time zone
Land area: 24.4 square miles.
Population density: 3,141 people per square mile (average).

10,219 residents are foreign born (8.9% Latin America, 1.5% Asia, 1.4% Africa).
| This city: | 13.2% |
| Michigan: | 7.0% |
Median real estate property taxes paid for housing units with mortgages in 2023: $2,812 (1.2%)
Median real estate property taxes paid for housing units with no mortgage in 2023: $2,902 (1.2%)
Nearest city with pop. 200,000+: Milwaukee, WI (114.7 miles
, pop. 596,974).
Nearest city with pop. 1,000,000+: Chicago, IL (124.9 miles
, pop. 2,896,016).
Nearest cities:
Latitude: 42.90 N, Longitude: 85.70 W
Daytime population change due to commuting: +2,234 (+2.9%)
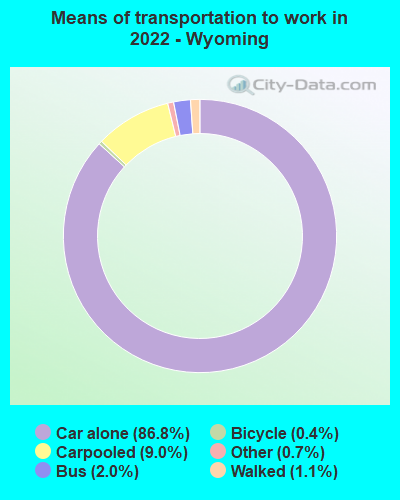
Workers who live and work in this city: 12,232 (28.2%)
Area code commonly used in this area: 616

Wyoming, Michigan accommodation & food services, waste management - Economy and Business Data
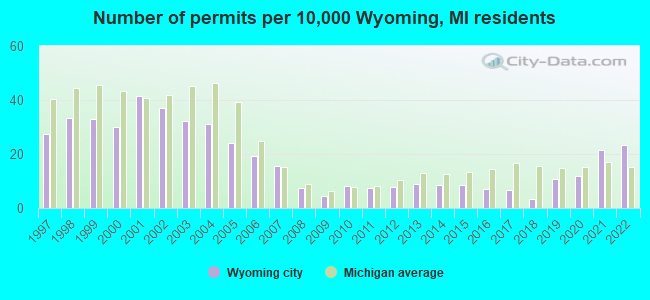
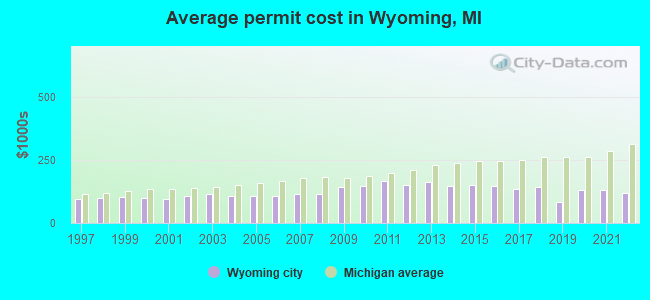
Single-family new house construction building permits:
- 2023: 62 buildings, average cost: $110,000
- 2022: 162 buildings, average cost: $117,800
- 2021: 149 buildings, average cost: $129,400
- 2020: 81 buildings, average cost: $130,300
- 2019: 75 buildings, average cost: $84,400
- 2018: 24 buildings, average cost: $143,400
- 2017: 46 buildings, average cost: $135,600
- 2016: 49 buildings, average cost: $146,000
- 2015: 60 buildings, average cost: $149,800
- 2014: 58 buildings, average cost: $147,300
- 2013: 62 buildings, average cost: $162,800
- 2012: 55 buildings, average cost: $149,800
- 2011: 51 buildings, average cost: $165,100
- 2010: 57 buildings, average cost: $144,600
- 2009: 32 buildings, average cost: $143,500
- 2008: 51 buildings, average cost: $115,400
- 2007: 109 buildings, average cost: $113,100
- 2006: 133 buildings, average cost: $106,700
- 2005: 166 buildings, average cost: $106,300
- 2004: 217 buildings, average cost: $107,200
- 2003: 224 buildings, average cost: $115,200
- 2002: 257 buildings, average cost: $106,500
- 2001: 287 buildings, average cost: $95,300
- 2000: 207 buildings, average cost: $99,100
- 1999: 229 buildings, average cost: $104,400
- 1998: 232 buildings, average cost: $99,300
- 1997: 190 buildings, average cost: $95,400
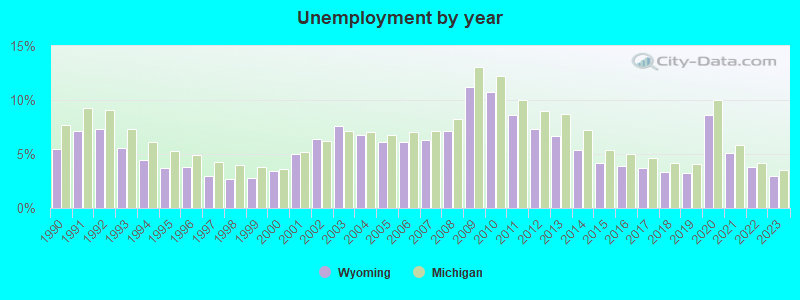
| Here: | 4.0% |
| Michigan: | 4.8% |
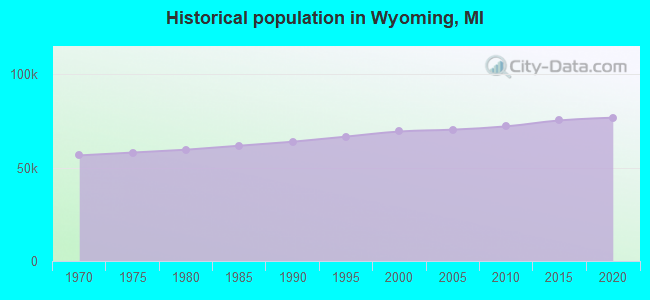
Population change in the 1990s: +5,683 (+8.9%).
- Manufacturing (22.9%)
- Health care & social assistance (13.8%)
- Retail trade (11.7%)
- Construction (6.8%)
- Educational services (6.0%)
- Accommodation & food services (5.9%)
- Finance & insurance (5.1%)
- Manufacturing (32.0%)
- Construction (12.6%)
- Retail trade (10.3%)
- Finance & insurance (6.1%)
- Wholesale trade (5.6%)
- Transportation & warehousing (5.0%)
- Professional, scientific, technical services (4.2%)
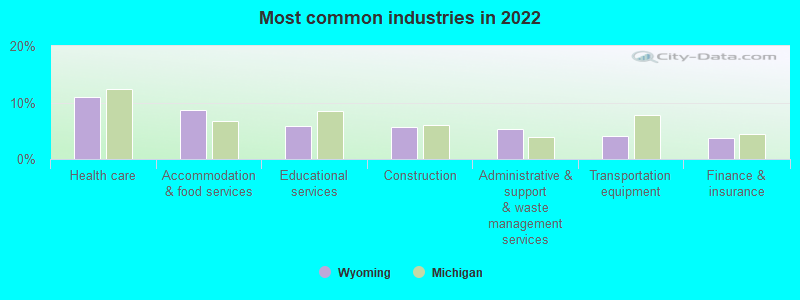
- Health care & social assistance (24.5%)
- Retail trade (13.3%)
- Manufacturing (12.9%)
- Educational services (8.9%)
- Accommodation & food services (8.4%)
- Professional, scientific, technical services (5.5%)
- Administrative & support & waste management services (4.2%)
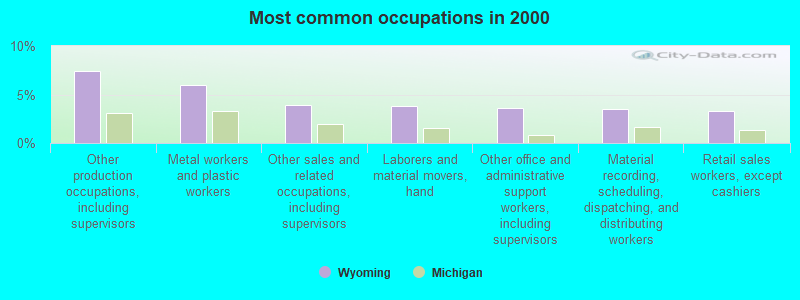
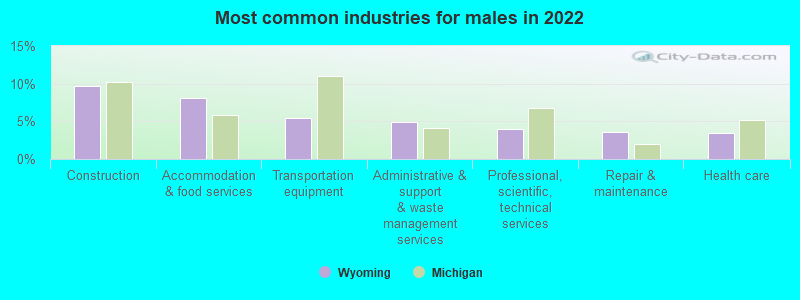
- Other production occupations, including supervisors (7.5%)
- Metal workers and plastic workers (6.0%)
- Other sales and related occupations, including supervisors (3.9%)
- Laborers and material movers, hand (3.9%)
- Other office and administrative support workers, including supervisors (3.6%)
- Material recording, scheduling, dispatching, and distributing workers (3.5%)
- Retail sales workers, except cashiers (3.3%)
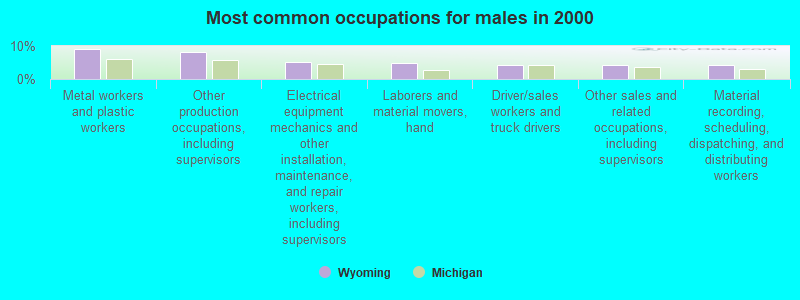
- Metal workers and plastic workers (9.1%)
- Other production occupations, including supervisors (8.1%)
- Electrical equipment mechanics and other installation, maintenance, and repair workers, including supervisors (5.1%)
- Laborers and material movers, hand (5.0%)
- Driver/sales workers and truck drivers (4.3%)
- Other sales and related occupations, including supervisors (4.3%)
- Material recording, scheduling, dispatching, and distributing workers (4.1%)
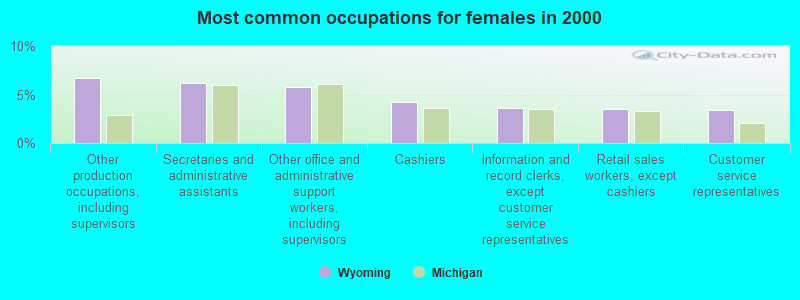
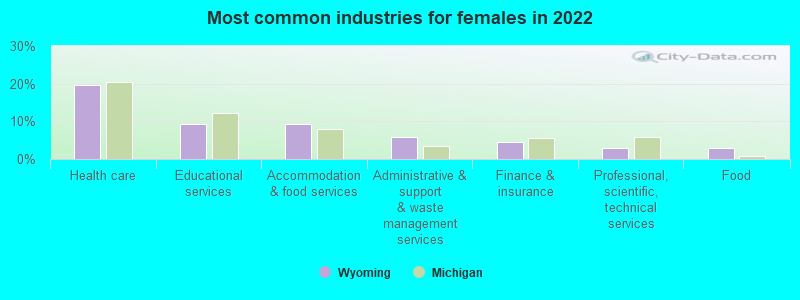
- Other production occupations, including supervisors (6.7%)
- Secretaries and administrative assistants (6.2%)
- Other office and administrative support workers, including supervisors (5.7%)
- Cashiers (4.2%)
- Information and record clerks, except customer service representatives (3.7%)
- Retail sales workers, except cashiers (3.5%)
- Customer service representatives (3.4%)
Average climate in Wyoming, Michigan
Based on data reported by over 4,000 weather stations


|
|


(lower is better)
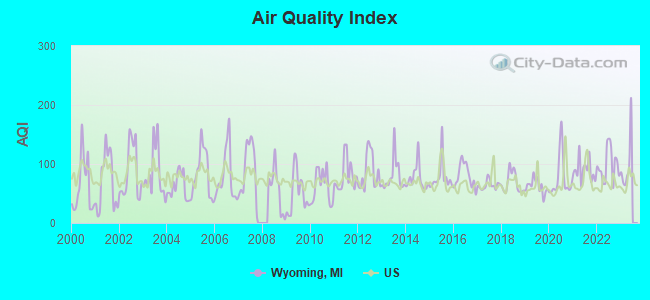
Air Quality Index (AQI) level in 2022 was 97.7. This is worse than average.
| City: | 97.7 |
| U.S.: | 72.6 |
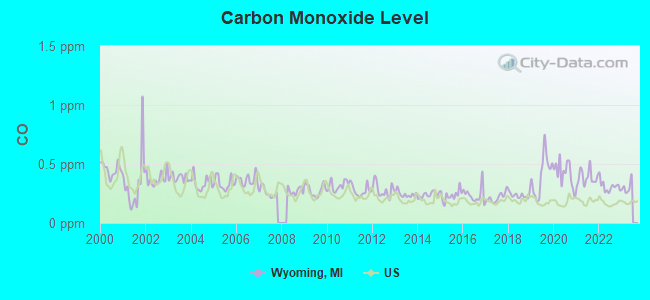
Carbon Monoxide (CO) [ppm] level in 2022 was 0.310. This is worse than average. Closest monitor was 5.3 miles away from the city center.
| City: | 0.310 |
| U.S.: | 0.251 |
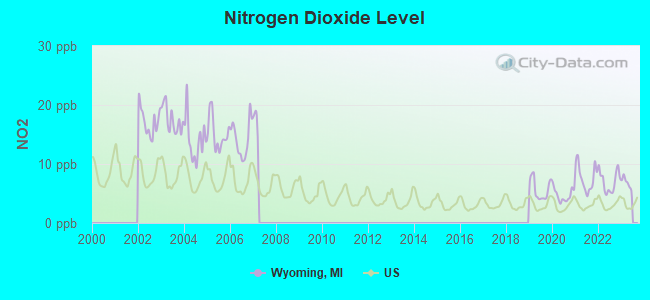
Nitrogen Dioxide (NO2) [ppb] level in 2022 was 7.01. This is worse than average. Closest monitor was 4.7 miles away from the city center.
| City: | 7.01 |
| U.S.: | 5.11 |
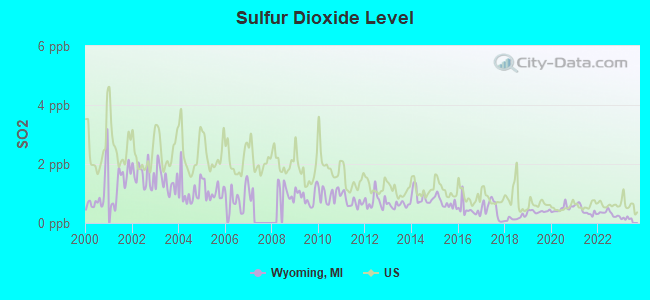
Sulfur Dioxide (SO2) [ppb] level in 2022 was 0.321. This is significantly better than average. Closest monitor was 4.7 miles away from the city center.
| City: | 0.321 |
| U.S.: | 1.515 |
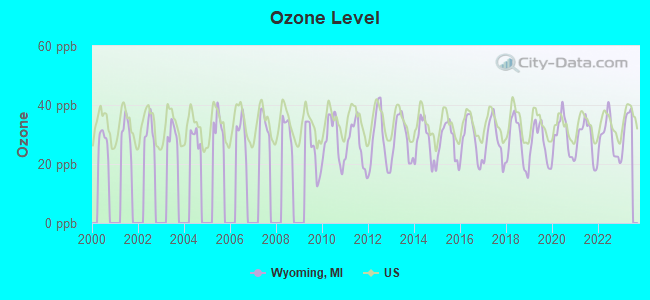
Ozone [ppb] level in 2022 was 28.9. This is about average. Closest monitor was 5.3 miles away from the city center.
| City: | 28.9 |
| U.S.: | 33.3 |
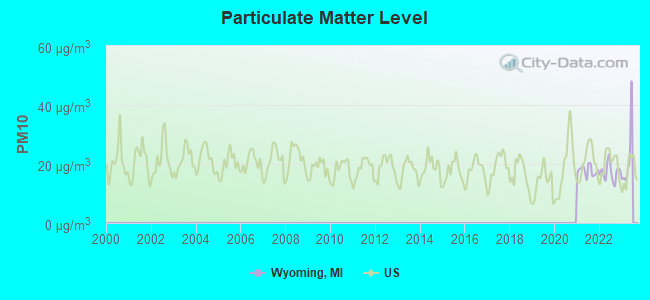
Particulate Matter (PM10) [µg/m3] level in 2022 was 17.2. This is about average. Closest monitor was 4.0 miles away from the city center.
| City: | 17.2 |
| U.S.: | 19.2 |
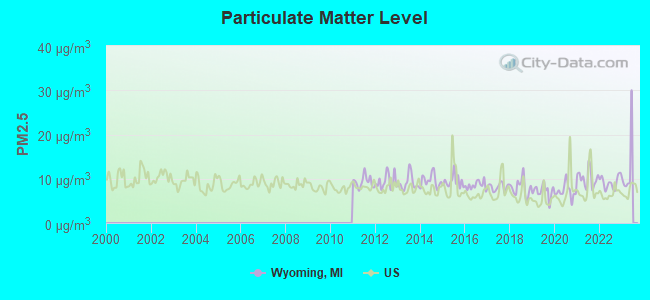
Particulate Matter (PM2.5) [µg/m3] level in 2022 was 9.18. This is about average. Closest monitor was 4.0 miles away from the city center.
| City: | 9.18 |
| U.S.: | 8.11 |
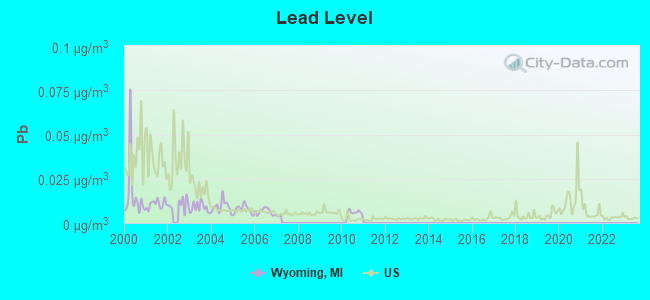
Lead (Pb) [µg/m3] level in 2010 was 0.00613. This is significantly better than average. Closest monitor was 3.0 miles away from the city center.
| City: | 0.00613 |
| U.S.: | 0.00931 |
Tornado activity:
Wyoming-area historical tornado activity is near Michigan state average. It is 5% greater than the overall U.S. average.
On 4/3/1956, a category F5 (max. wind speeds 261-318 mph) tornado 30.9 miles away from the Wyoming city center killed 18 people and injured 340 people and caused between $50,000 and $500,000 in damages.
On 4/11/1965, a category F4 (max. wind speeds 207-260 mph) tornado 13.9 miles away from the city center killed 5 people and injured 142 people and caused between $500,000 and $5,000,000 in damages.
Earthquake activity:
Wyoming-area historical earthquake activity is significantly above Michigan state average. It is 25% smaller than the overall U.S. average.On 5/2/2015 at 16:23:07, a magnitude 4.2 (4.2 MW, Depth: 2.8 mi, Class: Light, Intensity: IV - V) earthquake occurred 48.0 miles away from Wyoming center
On 1/31/1986 at 16:46:43, a magnitude 5.0 (5.0 MB, Class: Moderate, Intensity: VI - VII) earthquake occurred 249.1 miles away from Wyoming center
On 9/25/1998 at 19:52:52, a magnitude 5.2 (4.8 MB, 4.3 MS, 5.2 LG, 4.5 MW, Depth: 3.1 mi) earthquake occurred 288.6 miles away from Wyoming center
On 4/18/2008 at 09:36:59, a magnitude 5.4 (5.1 MB, 4.8 MS, 5.4 MW, 5.2 MW) earthquake occurred 328.3 miles away from Wyoming center
On 7/12/1986 at 08:19:37, a magnitude 4.5 (4.5 MB) earthquake occurred 177.2 miles away from Wyoming center
On 6/10/1987 at 23:48:54, a magnitude 5.1 (4.9 MB, 4.4 MS, 4.6 MS, 5.1 LG) earthquake occurred 304.4 miles away from Wyoming center
Magnitude types: regional Lg-wave magnitude (LG), body-wave magnitude (MB), surface-wave magnitude (MS), moment magnitude (MW)
Natural disasters:
The number of natural disasters in Kent County (12) is smaller than the US average (19).Major Disasters (Presidential) Declared: 6
Emergencies Declared: 4
Causes of natural disasters: Storms: 5, Floods: 4, Tornadoes: 3, Winter Storms: 2, Blizzard: 1, Hurricane: 1, Snowstorm: 1, Wind: 1, Other: 2 (Note: some incidents may be assigned to more than one category).

Main business address for: MERCANTILE BANK CORP (STATE COMMERCIAL BANKS).
Hospitals and medical centers in Wyoming:
- METRO HEALTH HOSPITAL (Voluntary non-profit - Private, 5900 BYRON CENTER AVENUE, SW)
- HEARTLAND HEALTH CARE CENTER-CRESTVIEW (625 36TH ST SW)
- TENDERCARE HEALTH AND REHAB CENTER OF WYOMING (2786 56 STREET, SW)
- RENAL ADVANTAGE - CLYDE PARK (4893 CLYDE PARK AVE SW)
- CARE ONE HOME HEALTH SERVICES, INC (2660 44TH STREET SW, SUITE 500)
Amtrak stations near Wyoming:
- 5 miles: GRAND RAPIDS (MARKET & WEALTHY STS.) . Services: enclosed waiting area, public restrooms, public payphones, free short-term parking, free long-term parking, call for taxi service, public transit connection.
- 17 miles: ROCKFORD (39 S. MAIN ST.) - Bus Station . Services: fully wheelchair accessible.
Colleges/Universities in Wyoming:
- Grace Bible College (Full-time enrollment: 371; Location: 1011 Aldon SW; Private, not-for-profit; Website: www.gbcol.edu)
- ITT Technical Institute-Wyoming (Full-time enrollment: 360; Location: 1980 Metro Court S.W.; Private, for-profit; Website: www.itt-tech.edu)
- ITT Technical Institute-Grand Rapids (Full-time enrollment: 69; Location: 1980 Metro Court S.W., Suite 100; Private, for-profit; Website: www.itt-tech.edu)
Colleges/universities with over 2000 students nearest to Wyoming:
- Grand Rapids Community College (about 5 miles; Grand Rapids, MI; Full-time enrollment: 11,296)
- Calvin College (about 7 miles; Grand Rapids, MI; FT enrollment: 4,117)
- Cornerstone University (about 8 miles; Grand Rapids, MI; FT enrollment: 2,573)
- Davenport University (about 10 miles; Grand Rapids, MI; FT enrollment: 6,955)
- Grand Valley State University (about 11 miles; Allendale, MI; FT enrollment: 21,982)
- Hope College (about 23 miles; Holland, MI; FT enrollment: 3,535)
- Baker College of Muskegon (about 35 miles; Muskegon, MI; FT enrollment: 3,293)
Public high schools in Wyoming:
- WYOMING JUNIOR HIGH (Students: 851, Location: 2125 WRENWOOD SW, Grades: 7-9)
- LEE HIGH SCHOOL (Students: 392, Location: 1335 LEE ST SW, Grades: 9-12)
- WYOMING COMMUNITY EDUC. CENTER (Students: 323, Location: 3600 BYRON CENTER AVE SW, Grades: 9-12)
- EAST LEE CAMPUS (Location: 982 LEE ST SW, Grades: 9-12)
- WYOMING HIGH SCHOOL (Location: 1350 PRAIRIE PKWY SW, Grades: 10-12)
Private high schools in Wyoming:
Biggest public elementary/middle schools in Wyoming:
- VANGUARD CHARTER ACADEMY (Students: 719, Location: 1620 52ND ST SW, Grades: KG-8, Charter school)
- WEST GODWIN ELEMENTARY SCHOOL (Students: 445, Location: 3546 CLYDE PARK AVE SW, Grades: PK-4)
- GODFREY-LEE EARLY CHILDHOOD CTR. (Students: 412, Location: 961 JOOSTEN ST SW, Grades: PK-2)
- GLADIOLA ELEMENTARY SCHOOL (Students: 355, Location: 3500 GLADIOLA AVE SW, Grades: KG-4)
- ORIOLE PARK ELEMENTARY SCHOOL (Students: 345, Location: 1420 40TH ST SW, Grades: PK-4)
- GODFREY ELEMENTARY SCHOOL (Students: 336, Location: 1920 GODFREY AVE SW, Grades: 3-5)
- LEE MIDDLE SCHOOL (Students: 316, Location: 1335 LEE ST SW, Grades: 6-8)
- GRANDVILLE GRAND VIEW ELEMENTARY SCHOOL (Location: 3701 52ND ST SW, Grades: PK-6)
- WYOMING INTERMEDIATE (Location: 1331 33RD ST SW, Grades: 5-6)
- PARKVIEW ELEMENTARY SCHOOL (Location: 2075 LEE ST SW, Grades: KG-4)
Private elementary/middle schools in Wyoming:
- ST JOHN VIANNEY ELEMENTARY SCHOOL (Students: 265, Location: 4101 CLYDE PARK AVE SW, Grades: KG-8)
- SAN JUAN DIEGO ACADEMY (Students: 129, Location: 1650 GODFREY AVE SW, Grades: KG-8)
- ANCHORPOINT CHRISTIAN SCHOOL (Students: 99, Location: 601 36TH ST SW, Grades: PK-6)
- HOLY TRINITY EVANGELICAL LUTHERAN SCHOOL (Students: 56, Location: 4201 BURLINGAME AVE SW, Grades: PK-8)
Points of interest:
Notable locations in Wyoming: Kent Industrial Center (A), L E Kaufman Golf Course (B), Hills Plaza (C), The Pines Golf Course (D), Maple Hills Golf Course (E), Wyoming Fire Department Station 1 (F), Wyoming Fire Department Station 3 (G), Wyoming Fire Department Station 2 (H), Wyoming Police Department (I), James A Sheeran Public Service Building (J), Wyoming City Hall (K), Wyoming Fire Department Headquarters (L), Wyoming Branch Library (M). Display/hide their locations on the map
Shopping Centers: Rogers Plaza Town Center Mall (1), Rivertown Shopping Center (2). Display/hide their locations on the map
Main business address in Wyoming: MERCANTILE BANK CORP (A). Display/hide its location on the map
Churches in Wyoming include: Jehovah's Witnesses of Grandville (A), Spiritual Unity of Nations Church (B), Wyoming Seventh-Day Adventist Church (C), Church of Jesus Christ of Latter Day Saints (D), Grandville Assembly of God Church (E), Pentecostals of Kentwood (F), Wilson Avenue Church (G), Immanuel Christian Reformed Church (H), Burlingame Congregational Church (I). Display/hide their locations on the map
Cemetery: Resurrection Cemetery (1). Display/hide its location on the map
Lakes: Luvis Lake (A), Battjes Lake (B), Lamar Lake (C). Display/hide their locations on the map
Creek: Pine Hill Creek (A). Display/hide its location on the map
Parks in Wyoming include: Kimball Stadium (1), One Hundred Twenty-Sixth Infantry Historical Marker (2), Battjes Park (3), South Lawn Park (4), Ideal Park (5), Charles Lemery Park (6), Gezon Park (7), Kelloggsville Park (8), George P. Tilma Nature Preserve (9). Display/hide their locations on the map
Tourist attraction: Craig's Cruisers Family Fun Center (Amusement & Theme Parks; 5724 Clyde Park Avenue Southwest) (1). Display/hide its approximate location on the map
Birthplace of: Chris Kaman - NBA player (Los Angeles Clippers, born: Apr 28, 1982).
Drinking water stations with addresses in Wyoming and their reported violations in the past:
M-46 MOBILE TRUCK STOP (Population served: 400, Groundwater):Past monitoring violations:PINE BLUFF RESORT (Population served: 100, Groundwater):
- One regular monitoring violation
Past monitoring violations:J & H OIL COMPANY (Population served: 25, Groundwater):
- 2 routine major monitoring violations
Past health violations:J&H, EXIT 76 CORPORATION (Population served: 25, Groundwater):
- MCL, Monthly (TCR) - In JUL-2005, Contaminant: Coliform. Follow-up actions: St Public Notif issued (JUL-13-2005), St Violation/Reminder Notice (JUL-13-2005), St Compliance achieved (SEP-12-2005)
Past monitoring violations:
- One routine major monitoring violation
Drinking water stations with addresses in Wyoming that have no violations reported:
- NORTHERN SPRINGS MOBIL (Population served: 700, Primary Water Source Type: Groundwater)
- ROCKFORD MOBIL (Population served: 450, Primary Water Source Type: Groundwater)
- UNITED PARCEL SERVICE (Population served: 38, Primary Water Source Type: Groundwater)
- UNITED PARCEL SERVICE (Population served: 25, Primary Water Source Type: Groundwater)
- WAYLAND AUCTION RESTAURANT (Population served: 25, Primary Water Source Type: Groundwater)
- PINE BLUFF PROPERTIES (Population served: 25, Primary Water Source Type: Groundwater)
| This city: | 2.7 people |
| Michigan: | 2.5 people |
| This city: | 67.2% |
| Whole state: | 66.0% |
| This city: | 8.3% |
| Whole state: | 6.4% |
Likely homosexual households (counted as self-reported same-sex unmarried-partner households)
- Lesbian couples: 0.4% of all households
- Gay men: 0.2% of all households
People in group quarters in Wyoming in 2010:
- 173 people in group homes intended for adults
- 149 people in nursing facilities/skilled-nursing facilities
- 34 people in college/university student housing
- 2 people in other noninstitutional facilities
People in group quarters in Wyoming in 2000:
- 101 people in college dormitories (includes college quarters off campus)
- 87 people in nursing homes
- 85 people in other group homes
- 51 people in homes for the mentally retarded
- 21 people in other noninstitutional group quarters
- 11 people in homes for the mentally ill
- 2 people in homes for the physically handicapped
Banks with branches in Wyoming (2011 data):
- The Huntington National Bank: 9 branches. Info updated 2012/04/02: Bank assets: $54,183.4 mil, Deposits: $44,300.3 mil, headquarters in Columbus, OH, positive income, Commercial Lending Specialization, 878 total offices, Holding Company: Huntington Bancshares Incorporated
- Fifth Third Bank: Chicago Drive/Godfrey Bc, Wyoming Branch, Gezon Parkway Banking Center Branch, Clyde Park And 44th Street Branch. Info updated 2009/10/05: Bank assets: $114,540.4 mil, Deposits: $89,689.1 mil, headquarters in Cincinnati, OH, positive income, Commercial Lending Specialization, 1378 total offices, Holding Company: Fifth Third Bancorp
- JPMorgan Chase Bank, National Association: Aurora Pond Retirement Branch, Wyoming Meijer Banking Center Branch, Burlingame 44th Branch. Info updated 2011/11/10: Bank assets: $1,811,678.0 mil, Deposits: $1,190,738.0 mil, headquarters in Columbus, OH, positive income, International Specialization, 5577 total offices, Holding Company: Jpmorgan Chase & Co.
- PNC Bank, National Association: 52nd Street And Wilson Branch, Clyde Park Branch, Wyoming Branch. Info updated 2012/03/20: Bank assets: $263,309.6 mil, Deposits: $197,343.0 mil, headquarters in Wilmington, DE, positive income, Commercial Lending Specialization, 3085 total offices, Holding Company: Pnc Financial Services Group, Inc., The
- Bank of America, National Association: 28th/Michael Branch at 1212 28th Street, Southwest, branch established on 1934/03/01. Info updated 2009/11/18: Bank assets: $1,451,969.3 mil, Deposits: $1,077,176.8 mil, headquarters in Charlotte, NC, positive income, 5782 total offices, Holding Company: Bank Of America Corporation
- Macatawa Bank: Clyde Park Avenue Branch at 5271 Clyde Park Avenue S.W., branch established on 2002/11/14. Info updated 2011/07/20: Bank assets: $1,506.0 mil, Deposits: $1,225.8 mil, headquarters in Holland, MI, positive income, Commercial Lending Specialization, 30 total offices, Holding Company: Macatawa Bank Corporation
- Mercantile Bank of Michigan: Wyoming Branch at 5610 Byron Center Avenue, branch established on 2001/09/04. Info updated 2006/11/03: Bank assets: $1,428.1 mil, Deposits: $1,112.6 mil, headquarters in Grand Rapids, MI, positive income, Commercial Lending Specialization, 8 total offices, Holding Company: Mercantile Bank Corporation
For population 15 years and over in Wyoming:
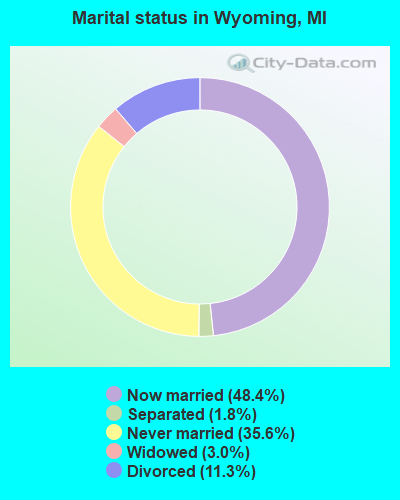
- Never married: 36.0%
- Now married: 45.6%
- Separated: 1.5%
- Widowed: 4.7%
- Divorced: 12.2%
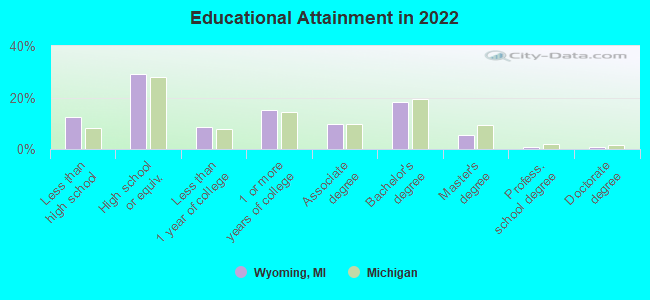
For population 25 years and over in Wyoming:
- High school or higher: 88.9%
- Bachelor's degree or higher: 29.7%
- Graduate or professional degree: 7.8%
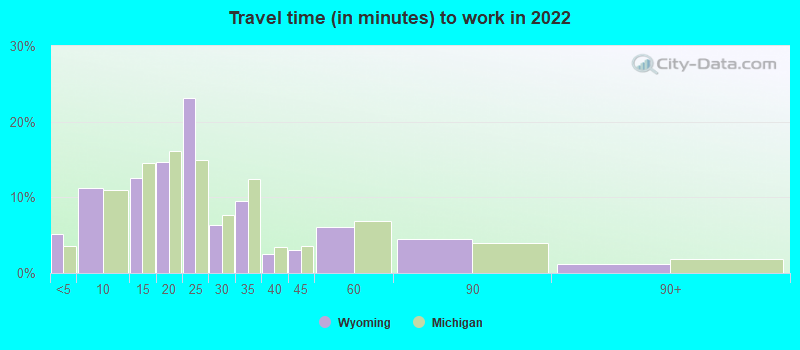
- Unemployed: 4.6%
- Mean travel time to work (commute): 17.2 minutes
| Here: | 12.7 |
| Michigan average: | 11.0 |
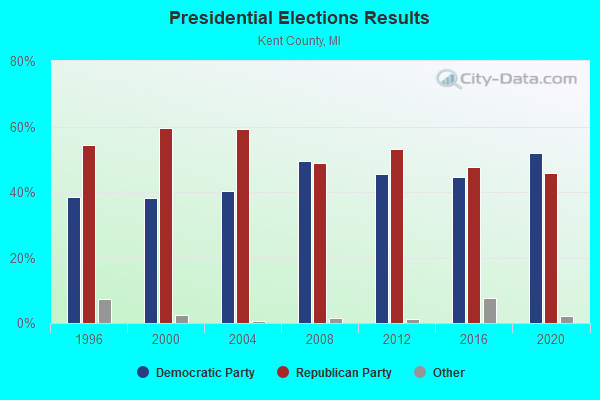
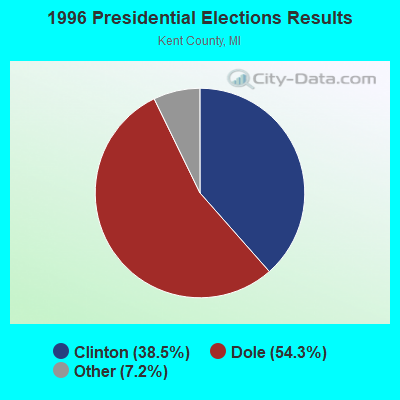
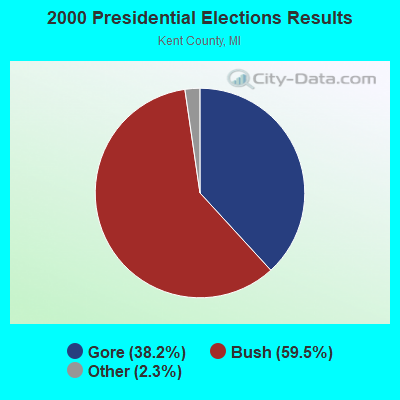
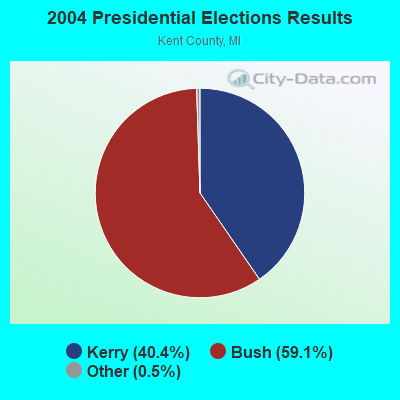

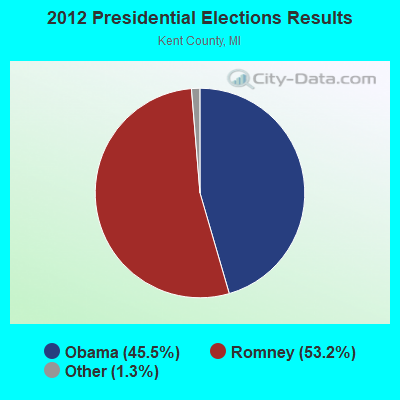
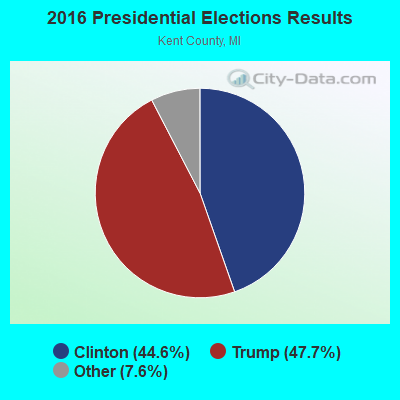
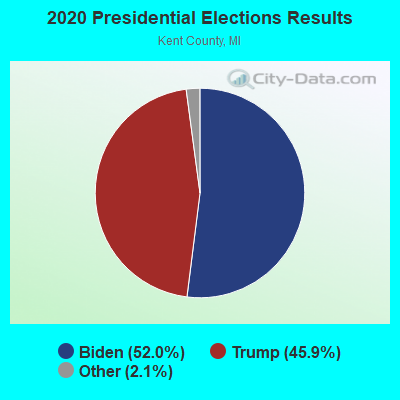

Graphs represent county-level data. Detailed 2008 Election Results
Religion statistics for Wyoming, MI (based on Kent County data)
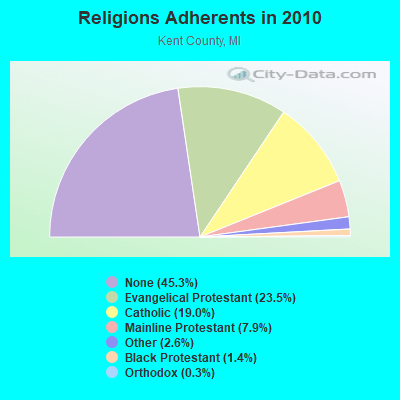
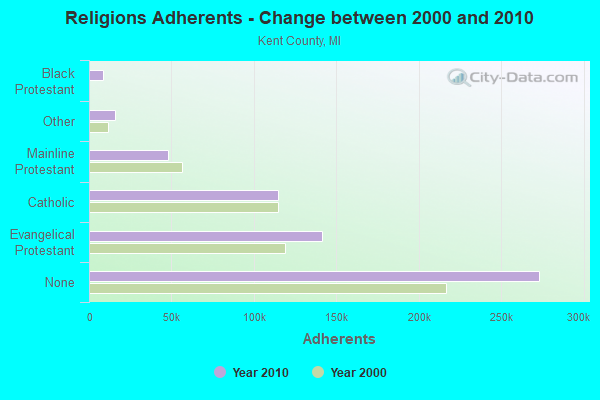
| Religion | Adherents | Congregations |
|---|---|---|
| Evangelical Protestant | 141,345 | 354 |
| Catholic | 114,437 | 37 |
| Mainline Protestant | 47,892 | 117 |
| Other | 15,674 | 41 |
| Black Protestant | 8,454 | 11 |
| Orthodox | 1,730 | 6 |
| None | 273,090 | - |
Food Environment Statistics:
| Kent County: | 1.96 / 10,000 pop. |
| Michigan: | 2.34 / 10,000 pop. |
| This county: | 0.30 / 10,000 pop. |
| Michigan: | 0.18 / 10,000 pop. |
| Kent County: | 0.90 / 10,000 pop. |
| Michigan: | 1.52 / 10,000 pop. |
| Kent County: | 2.16 / 10,000 pop. |
| Michigan: | 2.99 / 10,000 pop. |
| Here: | 6.69 / 10,000 pop. |
| State: | 6.80 / 10,000 pop. |
| Kent County: | 8.6% |
| Michigan: | 9.7% |
| Here: | 28.1% |
| State: | 29.7% |
| This county: | 15.7% |
| State: | 13.4% |
Health and Nutrition:
| Wyoming: | 48.2% |
| Michigan: | 50.3% |
| This city: | 45.4% |
| Michigan: | 47.9% |
| Wyoming: | 28.4 |
| State: | 28.7 |
| Wyoming: | 21.0% |
| State: | 20.6% |
| Here: | 10.2% |
| State: | 10.4% |
| Wyoming: | 6.8 |
| State: | 6.8 |
| Here: | 31.5% |
| Michigan: | 34.1% |
| Wyoming: | 56.3% |
| Michigan: | 57.0% |
| Wyoming: | 80.1% |
| Michigan: | 79.6% |
More about Health and Nutrition of Wyoming, MI Residents
| Local government employment and payroll (March 2022) | |||||
| Function | Full-time employees | Monthly full-time payroll | Average yearly full-time wage | Part-time employees | Monthly part-time payroll |
|---|---|---|---|---|---|
| Police Protection - Officers | 90 | $707,298 | $94,306 | 0 | $0 |
| Streets and Highways | 47 | $275,455 | $70,329 | 4 | $8,328 |
| Firefighters | 36 | $235,356 | $78,452 | 1 | $465 |
| Sewerage | 31 | $198,726 | $76,926 | 0 | $0 |
| Financial Administration | 28 | $163,583 | $70,107 | 2 | $2,489 |
| Water Supply | 22 | $123,608 | $67,423 | 2 | $1,098 |
| Other and Unallocable | 20 | $108,321 | $64,993 | 10 | $779 |
| Other Government Administration | 20 | $125,481 | $75,289 | 20 | $8,070 |
| Judicial and Legal | 20 | $74,319 | $44,591 | 7 | $17,413 |
| Parks and Recreation | 18 | $96,277 | $64,185 | 43 | $55,940 |
| Police - Other | 13 | $61,546 | $56,812 | 7 | $6,951 |
| Housing and Community Development (Local) | 10 | $51,110 | $61,332 | 0 | $0 |
| Correction | 2 | $12,006 | $72,036 | 2 | $7,420 |
| Fire - Other | 0 | $0 | 2 | $5,660 | |
| Totals for Government | 357 | $2,233,086 | $75,062 | 100 | $114,612 |
Wyoming government finances - Expenditure in 2022 (per resident):
- Construction - Water Utilities: $12,964,000 ($168.96)
Sewerage: $6,714,000 ($87.51)
Regular Highways: $4,586,000 ($59.77)
General - Other: $1,733,000 ($22.59)
Parks and Recreation: $1,698,000 ($22.13)
Local Fire Protection: $1,596,000 ($20.80)
Police Protection: $332,000 ($4.33)
Judicial and Legal Services: $178,000 ($2.32)
- Current Operations - Sewerage: $26,061,000 ($339.66)
Police Protection: $15,485,000 ($201.82)
Housing and Community Development: $10,263,000 ($133.76)
Regular Highways: $8,075,000 ($105.24)
Local Fire Protection: $6,300,000 ($82.11)
General - Other: $5,607,000 ($73.08)
Parks and Recreation: $5,335,000 ($69.53)
Judicial and Legal Services: $2,880,000 ($37.54)
Libraries: $1,981,000 ($25.82)
Protective Inspection and Regulation - Other: $1,582,000 ($20.62)
Central Staff Services: $1,538,000 ($20.05)
Solid Waste Management: $985,000 ($12.84)
Financial Administration: $939,000 ($12.24)
Corrections - Other: $588,000 ($7.66)
General Public Buildings: $152,000 ($1.98)
- General - Interest on Debt: $606,000 ($7.90)
- Intergovernmental to Local - Other - General - Other: $5,512,000 ($71.84)
- Intergovernmental to State - General - Other: $232,000 ($3.02)
- Total Salaries and Wages: $27,534,000 ($358.86)
- Water Utilities - Interest on Debt: $785,000 ($10.23)
Wyoming government finances - Revenue in 2022 (per resident):
- Charges - Sewerage: $21,177,000 ($276.01)
Housing and Community Development: $660,000 ($8.60)
Other: $498,000 ($6.49)
Parks and Recreation: $297,000 ($3.87)
- Federal Intergovernmental - Other: $11,690,000 ($152.36)
- Local Intergovernmental - Other: $519,000 ($6.76)
- Miscellaneous - Donations From Private Sources: $5,152,000 ($67.15)
Sale of Property: $2,634,000 ($34.33)
Fines and Forfeits: $1,209,000 ($15.76)
General Revenue - Other: $1,106,000 ($14.41)
Interest Earnings: $851,000 ($11.09)
Rents: $249,000 ($3.25)
Special Assessments: $231,000 ($3.01)
- Revenue - Water Utilities: $19,055,000 ($248.35)
- State Intergovernmental - Other: $19,687,000 ($256.59)
- Tax - Property: $30,961,000 ($403.53)
Public Utilities Sales: $1,727,000 ($22.51)
Other License: $1,331,000 ($17.35)
Other Selective Sales: $4,000 ($0.05)
Wyoming government finances - Debt in 2022 (per resident):
- Long Term Debt - Beginning Outstanding - Unspecified Public Purpose: $49,195,000 ($641.18)
Outstanding Unspecified Public Purpose: $47,395,000 ($617.72)
Retired Unspecified Public Purpose: $6,097,000 ($79.46)
Issue, Unspecified Public Purpose: $4,298,000 ($56.02)
5.32% of this county's 2021 resident taxpayers lived in other counties in 2020 ($66,370 average adjusted gross income)
| Here: | 5.32% |
| Michigan average: | 5.83% |
0.01% of residents moved from foreign countries ($84 average AGI)
Kent County: 0.01% Michigan average: 0.00%
Top counties from which taxpayers relocated into this county between 2020 and 2021:
| from Ottawa County, MI | |
| from Allegan County, MI | |
| from Muskegon County, MI |
5.81% of this county's 2020 resident taxpayers moved to other counties in 2021 ($69,193 average adjusted gross income)
| Here: | 5.81% |
| Michigan average: | 5.95% |
0.01% of residents moved to foreign countries ($92 average AGI)
Kent County: 0.01% Michigan average: 0.00%
Top counties to which taxpayers relocated from this county between 2020 and 2021:
| to Ottawa County, MI | |
| to Allegan County, MI | |
| to Montcalm County, MI |
| Businesses in Wyoming, MI | ||||
| Name | Count | Name | Count | |
|---|---|---|---|---|
| 7-Eleven | 2 | McDonald's | 5 | |
| ALDI | 2 | Meijer | 1 | |
| AT&T | 1 | Menards | 1 | |
| Ace Hardware | 1 | Nike | 2 | |
| Advance Auto Parts | 1 | OfficeMax | 1 | |
| Arby's | 2 | Old Country Buffet | 1 | |
| AutoZone | 1 | Payless | 2 | |
| Blockbuster | 1 | Penske | 1 | |
| Buffalo Wild Wings | 1 | Pier 1 Imports | 1 | |
| Burger King | 2 | Pizza Hut | 2 | |
| CVS | 3 | Quiznos | 2 | |
| Costco | 1 | RadioShack | 1 | |
| Curves | 1 | SAS Shoes | 1 | |
| Deb | 1 | SONIC Drive-In | 1 | |
| Dennys | 1 | Sprint Nextel | 2 | |
| Discount Tire | 1 | Starbucks | 2 | |
| Domino's Pizza | 1 | Steak 'n Shake | 1 | |
| Famous Footwear | 1 | Subway | 5 | |
| FedEx | 3 | Super 8 | 1 | |
| GNC | 1 | T-Mobile | 3 | |
| H&R Block | 2 | Taco Bell | 4 | |
| Hilton | 1 | Target | 1 | |
| Home Depot | 1 | U-Haul | 2 | |
| KFC | 3 | UPS | 5 | |
| Little Caesars Pizza | 2 | Walgreens | 4 | |
| Long John Silver's | 1 | Wendy's | 4 | |
| Marshalls | 1 | YMCA | 1 | |
| MasterBrand Cabinets | 5 | |||
Strongest AM radio stations in Wyoming:
- WOOD (1300 AM; 20 kW; GRAND RAPIDS, MI; Owner: CLEAR CHANNEL BROADCASTING LICENSES, INC.)
- WGVU (1480 AM; 5 kW; KENTWOOD, MI; Owner: GRAND VALLEY STATE UNIVERSITY B OF C)
- WBBL (1340 AM; 1 kW; GRAND RAPIDS, MI; Owner: CITADEL BROADCASTING COMPANY)
- WFUR (1570 AM; 1 kW; GRAND RAPIDS, MI)
- WYGR (1530 AM; daytime; 0 kW; WYOMING, MI; Owner: WYGR BROADCASTING)
- WJNZ (1140 AM; daytime; 5 kW; KENTWOOD, MI; Owner: GOODRICH RADIO, LLC)
- WTKG (1230 AM; 1 kW; GRAND RAPIDS, MI; Owner: CLEAR CHANNEL BROADCASTING LICENSES, INC.)
- WMJH (810 AM; daytime; 4 kW; ROCKFORD, MI)
- WPNW (1260 AM; 10 kW; ZEELAND, MI; Owner: LANSER BROADCASTING CORPORATION)
- WNWZ (1410 AM; 1 kW; GRAND RAPIDS, MI; Owner: REGENT BROADCASTING OF GRAND RAPIDS, INC.)
- WMFN (640 AM; 1 kW; ZEELAND, MI; Owner: BIRACH BROADCASTING CORPORATION)
- WOAP (1080 AM; 50 kW; OWOSSO, MI)
- WKZO (590 AM; 5 kW; KALAMAZOO, MI; Owner: FAIRFIELD BROADCASTING COMPANY)
Strongest FM radio stations in Wyoming:
- WYCE (88.1 FM; WYOMING, MI; Owner: GRAND RAPIDS CABLE ACCESS CENTER)
- WFUR-FM (102.9 FM; GRAND RAPIDS, MI; Owner: FURNITURE CITY BROADCASTING CORP.)
- WGRD-FM (97.9 FM; GRAND RAPIDS, MI; Owner: REGENT BROADCASTING OF GRAND RAPIDS, INC.)
- WCSG (91.3 FM; GRAND RAPIDS, MI; Owner: CORNERSTONE UNIVERSITY.)
- WBLU-FM (88.9 FM; GRAND RAPIDS, MI; Owner: BLUE LAKE FINE ARTS CAMP)
- WLHT-FM (95.7 FM; GRAND RAPIDS, MI; Owner: REGENT BROADCASTING OF GRAND RAPIDS, INC.)
- WFGR (98.7 FM; GRAND RAPIDS, MI; Owner: REGENT BROADCASTING OF GRAND RAPIDS, INC.)
- WOOD-FM (105.7 FM; GRAND RAPIDS, MI; Owner: CLEAR CHANNEL BROADCASTING LICENSES, INC.)
- WBFX (101.3 FM; GRAND RAPIDS, MI; Owner: CLEAR CHANNEL BROADCASTING LICENSES, INC.)
- WVTI (96.1 FM; HOLLAND, MI; Owner: CLEAR CHANNEL BROADCASTING LICENSES, INC.)
- WTRV (100.5 FM; WALKER, MI; Owner: REGENT BROADCASTING OF GRAND RAPIDS, INC.)
- W214AY (90.7 FM; WALKER, MI; Owner: CALVARY CHAPEL OF TWIN FALLS, INC.)
- WLAV-FM (96.9 FM; GRAND RAPIDS, MI; Owner: CITADEL BROADCASTING COMPANY)
- WVGR (104.1 FM; GRAND RAPIDS, MI; Owner: REGENTS OF THE UNIVERSITY OF MICHIGAN)
- WKLQ (94.5 FM; HOLLAND, MI; Owner: CITADEL BROADCASTING COMPANY)
- WBCT (93.7 FM; GRAND RAPIDS, MI; Owner: CLEAR CHANNEL BROADCASTING LICENSES, INC.)
- WAYG (89.9 FM; GRAND RAPIDS, MI; Owner: CORNERSTONE UNIVERSITY)
- WGNB (89.3 FM; ZEELAND, MI; Owner: THE MOODY BIBLE INSTITUTE OF CHICAGO)
- WZUU (92.3 FM; ALLEGAN, MI; Owner: FORUM COMMUNICATIONS, INC.)
- WODJ (107.3 FM; GREENVILLE, MI; Owner: CITADEL BROADCASTING COMPANY)
TV broadcast stations around Wyoming:
- WUHQ-LP (Channel 29; GRAND RAPIDS, MI; Owner: P & P CABLE HOLDINGS, L.L.C.)
- WTLJ (Channel 54; MUSKEGON, MI; Owner: TCT OF MICHIGAN, INC.)
- WGVU-TV (Channel 35; GRAND RAPIDS, MI; Owner: GRAND VALLEY STATE UNIVERSITY)
- W44BQ (Channel 44; MOUNT PLEASANT, MI; Owner: NTN/SAGINAW, INC.)
- WWMT (Channel 3; KALAMAZOO, MI; Owner: FREEDOM BROADCASTING OF MICHIGAN, INC.)
- WOGC-CA (Channel 25; GRAND RAPIDS, MI; Owner: WOOD LICENSE COMPANY, LLC)
- WXMI (Channel 17; GRAND RAPIDS, MI; Owner: TRIBUNE TELEVISION HOLDINGS, INC.)
- WOOD-TV (Channel 8; GRAND RAPIDS, MI; Owner: WOOD LICENSE COMPANY, LLC)
- WXSP-CA (Channel 15; GRAND RAPIDS, MI; Owner: WOOD LICENSE COMPANY, LLC)
- WOLP-CA (Channel 27; GRAND RAPIDS, MI; Owner: WOOD LICENSE COMPANY, LLC)
- W48CL (Channel 48; GRAND RAPIDS, MI; Owner: THREE ANGELS BROADCASTING NETWORK)
- WLLA (Channel 64; KALAMAZOO, MI; Owner: CHRISTIAN FAITH BROADCAST, INC.)
- WOHO-CA (Channel 33; HOLLAND, MI; Owner: WOOD LICENSE COMPANY, LLC)
- WOTV (Channel 41; BATTLE CREEK, MI; Owner: WOOD LICENSE COMPANY, LLC)
- WZZM-TV (Channel 13; GRAND RAPIDS, MI; Owner: COMBINED COMMUNICATIONS CORP. OF OKLAHOMA, INC.)
- W19BA (Channel 19; GRAND RAPIDS, MI; Owner: TRINITY BROADCASTING NETWORK)
- WZPX (Channel 43; BATTLE CREEK, MI; Owner: PAXSON BATTLE CREEK LICENSE, INC.)
- National Bridge Inventory (NBI) Statistics
- 34Number of bridges
- 348ft / 106mTotal length
- $240,000Total costs
- 1,094,054Total average daily traffic
- 76,006Total average daily truck traffic
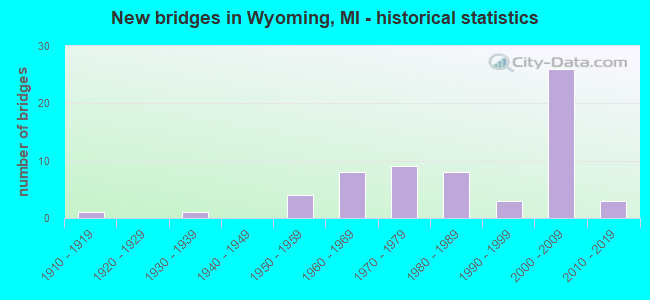
- New bridges - historical statistics
- 11910-1919
- 11930-1939
- 41950-1959
- 71960-1969
- 41970-1979
- 51980-1989
- 31990-1999
- 72000-2009
- 22010-2019
FCC Registered Antenna Towers: 64 (See the full list of FCC Registered Antenna Towers)
FCC Registered Broadcast Land Mobile Towers: 36 (See the full list of FCC Registered Broadcast Land Mobile Towers in Wyoming, MI)
FCC Registered Microwave Towers: 17 (See the full list of FCC Registered Microwave Towers in this town)
FCC Registered Amateur Radio Licenses: 266 (See the full list of FCC Registered Amateur Radio Licenses in Wyoming)
FAA Registered Aircraft: 22 (See the full list of FAA Registered Aircraft in Wyoming)
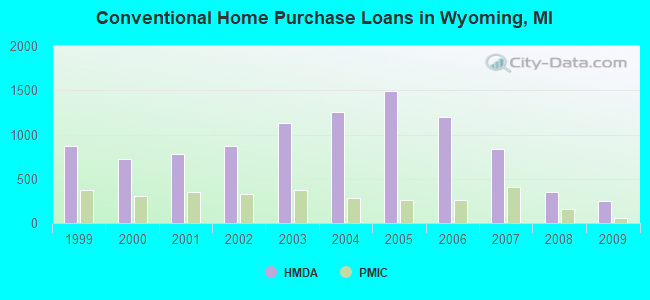
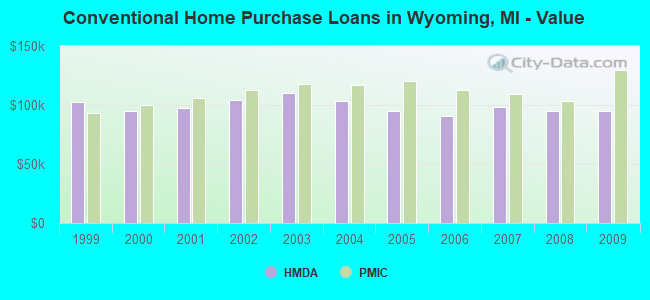
| Home Mortgage Disclosure Act Aggregated Statistics For Year 2009 (Based on 14 full tracts) | ||||||||||||||
| A) FHA, FSA/RHS & VA Home Purchase Loans | B) Conventional Home Purchase Loans | C) Refinancings | D) Home Improvement Loans | E) Loans on Dwellings For 5+ Families | F) Non-occupant Loans on < 5 Family Dwellings (A B C & D) | G) Loans On Manufactured Home Dwelling (A B C & D) | ||||||||
|---|---|---|---|---|---|---|---|---|---|---|---|---|---|---|
| Number | Average Value | Number | Average Value | Number | Average Value | Number | Average Value | Number | Average Value | Number | Average Value | Number | Average Value | |
| LOANS ORIGINATED | 488 | $85,503 | 254 | $94,546 | 1,066 | $114,590 | 52 | $16,592 | 2 | $362,000 | 61 | $67,260 | 12 | $35,583 |
| APPLICATIONS APPROVED, NOT ACCEPTED | 43 | $78,339 | 22 | $61,527 | 113 | $119,150 | 7 | $17,564 | 0 | $0 | 6 | $45,627 | 3 | $27,333 |
| APPLICATIONS DENIED | 94 | $77,702 | 66 | $71,974 | 423 | $114,055 | 53 | $17,094 | 2 | $241,500 | 38 | $65,467 | 9 | $47,619 |
| APPLICATIONS WITHDRAWN | 73 | $85,112 | 34 | $72,580 | 327 | $119,910 | 12 | $44,998 | 0 | $0 | 8 | $71,500 | 2 | $60,725 |
| FILES CLOSED FOR INCOMPLETENESS | 12 | $75,056 | 6 | $51,333 | 71 | $118,352 | 4 | $55,728 | 0 | $0 | 4 | $103,000 | 0 | $0 |
Detailed mortgage data for all 14 tracts in Wyoming, MI
| Private Mortgage Insurance Companies Aggregated Statistics For Year 2009 (Based on 14 full tracts) | ||||
| A) Conventional Home Purchase Loans | B) Refinancings | |||
|---|---|---|---|---|
| Number | Average Value | Number | Average Value | |
| LOANS ORIGINATED | 56 | $129,890 | 32 | $133,531 |
| APPLICATIONS APPROVED, NOT ACCEPTED | 12 | $76,833 | 18 | $151,000 |
| APPLICATIONS DENIED | 15 | $113,775 | 8 | $118,375 |
| APPLICATIONS WITHDRAWN | 1 | $41,000 | 8 | $178,000 |
| FILES CLOSED FOR INCOMPLETENESS | 2 | $100,000 | 2 | $144,000 |
2002 - 2018 National Fire Incident Reporting System (NFIRS) incidents
- Fire incident types reported to NFIRS in Wyoming, MI
- 1,33546.0%Structure Fires
- 75326.0%Mobile Property/Vehicle Fires
- 70724.4%Outside Fires
- 1063.7%Other
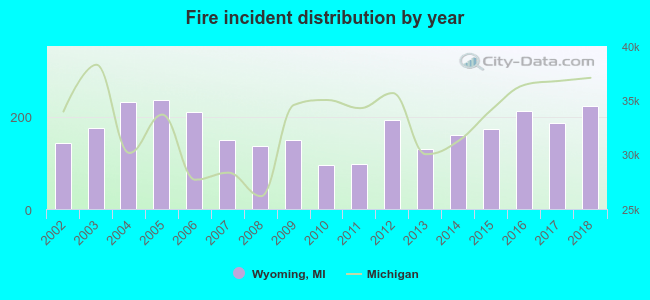 According to the data from the years 2002 - 2018 the average number of fires per year is 171. The highest number of reported fire incidents - 235 took place in 2005, and the least - 96 in 2010. The data has an increasing trend.
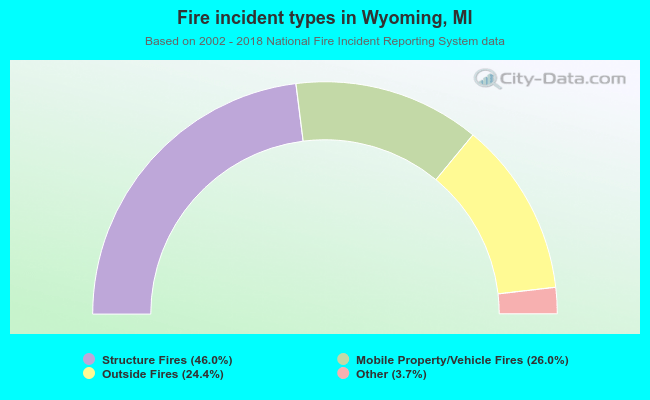 When looking into fire subcategories, the most reports belonged to: Structure Fires (46.0%), and Mobile Property/Vehicle Fires (26.0%).
Fire-safe hotels and motels in Wyoming, Michigan:
- Hampton Inn, 755 54th St SW, Wyoming, Michigan 49509 , Phone: (616) 261-5500, Fax: (616) 261-9120
- Hyatt Place Grand Rapids/Wyoming, 2150 Metro Ln, Wyoming, Michigan 49519 , Phone: (616) 724-1234, Fax: (616) 724-1237
- Brickcrete Motel, 4721 S Divison, Wyoming, Michigan 49548 , Phone: (616) 532-3657
- Holiday Inn Express & Suites, 5870 Clyde Park Ave South W - Unit 1, Wyoming, Michigan 49509 , Phone: (888) 653-4858
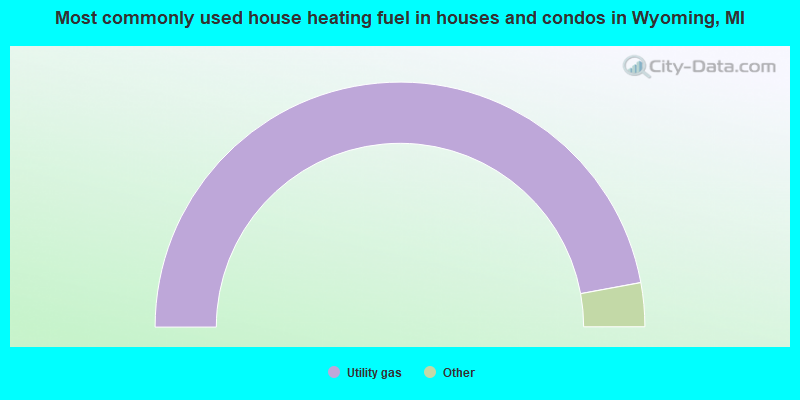
- 93.5%Utility gas
- 4.6%Electricity
- 1.0%Bottled, tank, or LP gas
- 0.4%Fuel oil, kerosene, etc.
- 0.2%Wood
- 0.2%Solar energy
- 0.2%Other fuel
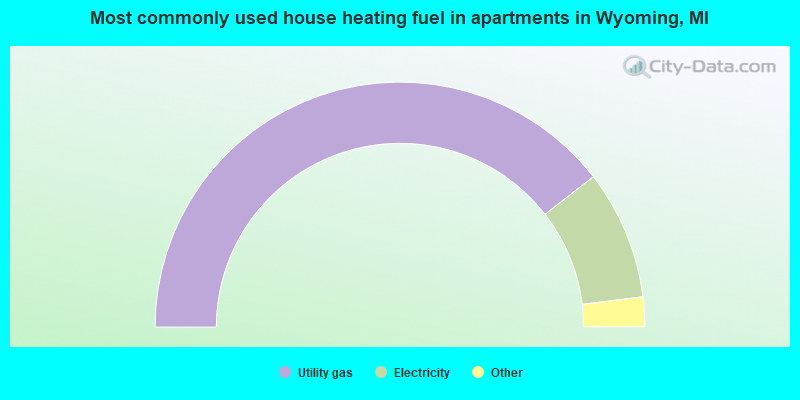
- 77.7%Utility gas
- 18.9%Electricity
- 1.5%Other fuel
- 1.1%Bottled, tank, or LP gas
- 0.8%No fuel used
Wyoming compared to Michigan state average:
- Unemployed percentage significantly below state average.
- Hispanic race population percentage significantly above state average.
- Median age significantly below state average.
- Foreign-born population percentage above state average.
- Length of stay since moving in below state average.
Wyoming on our top lists:
- #4 on the list of "Top 101 cities with the highest ratio of rapes to murders between 2002 and 2012 (population 50,000+)"
- #6 on the list of "Top 101 cities with largest percentage of males in occupations: production occupations (population 50,000+)"
- #9 on the list of "Top 101 cities with largest percentage of males in industries: manufacturing (population 50,000+)"
- #12 on the list of "Top 100 cities with lowest ratio of median house value to median household income (pop. 50,000+)"
- #15 on the list of "Top 101 cities with largest percentage of males in industries: wholesale trade (population 50,000+)"
- #15 on the list of "Top 101 cities with the least people having professional degrees (population 50,000+)"
- #21 on the list of "Top 101 larger cities with the largest decrease or smallest increase in house/condo value from 2000 (population 50,000+)"
- #25 on the list of "Top 101 cities with largest percentage of females in occupations: office and administrative support occupations (population 50,000+)"
- #26 on the list of "Top 101 cities with largest percentage of females in industries: manufacturing (population 50,000+)"
- #28 on the list of "Top 101 cities with the lowest average sunshine amount (population 50,000+)"
- #33 on the list of "Top 101 cities with largest percentage of females in occupations: production occupations (population 50,000+)"
- #35 on the list of "Top 101 cities with the most people born in the same U.S. state as the city (population 50,000+)"
- #36 on the list of "Top 101 cities with the lowest minimum monthly sunshine amount (population 50,000+)"
- #54 on the list of "Top 101 cities with largest percentage of males in occupations: farming, fishing, and forestry occupations (population 50,000+)"
- #55 on the list of "Top 101 cities with largest percentage of males in occupations: arts, design, entertainment, sports, and media occupations (population 50,000+)"
- #66 on the list of "Top 101 cities with the lowest average temperatures (population 50,000+)"
- #80 on the list of "Top 100 high-educated but low-earning cities (pop. 50,000+)"
- #88 on the list of "Top 101 cities with the coldest winters (population 50,000+)"
- #16 on the list of "Top 101 counties with the highest carbon monoxide air pollution readings in 2012 (ppm)"
- #39 on the list of "Top 101 counties with the largest decrease in the number of infant deaths per 1000 residents 2000-2006 to 2007-2013 (pop. 50,000+)"
- #46 on the list of "Top 101 counties with the lowest Particulate Matter (PM10) Annual air pollution readings in 2012 (µg/m3)"
- #48 on the list of "Top 101 counties with the most Evangelical Protestant adherents"
- #53 on the list of "Top 101 counties with the highest percentage of residents that visited a dentist within the past year"

|
|
Total of 194 patent applications in 2008-2025.