Bergen County, New Jersey (NJ)
County population in 2023: 957,736 (100% urban, 0% rural); it was 884,118 in 2000County owner-occupied with a mortgage or a loan houses and condos in 2010: 154,617County owner-occupied free and clear houses and condos in 2010: 67,349County owner-occupied houses and condos in 2000: 222,237Renter-occupied apartments: 113,764 (it was 108,580 in 2000)% of renters here:
33%State:
35%
Land area: 234 sq. mi.
Water area: 12.6 sq. mi.
Population density: 4090 people per square mile (very high).
December 2024 cost of living index in Bergen County: 117.9 (more than average, U.S. average is 100) Industries providing employment: Educational, health and social services (24.0%), Professional, scientific, management, administrative, and waste management services (15.4%), Finance, insurance, real estate, and rental and leasing (11.3%), Retail trade (10.2%).
Type of workers:
Private wage or salary: 83%Government: 12%Self-employed, not incorporated: 5%Unpaid family work: 0%
OSM Map
General Map
Google Map
MSN Map
OSM Map
General Map
Google Map
MSN Map
OSM Map
General Map
Google Map
MSN Map
OSM Map
General Map
Google Map
MSN Map
Please wait while loading the map...
Data:
Median household income ($)
Median household income (% change since 2000)
Household income diversity
Ratio of average income to average house value (%)
Ratio of average income to average rent
Median household income ($) - White
Median household income ($) - Black or African American
Median household income ($) - Asian
Median household income ($) - Hispanic or Latino
Median household income ($) - American Indian and Alaska Native
Median household income ($) - Multirace
Median household income ($) - Other Race
Median household income for houses/condos with a mortgage ($)
Median household income for apartments without a mortgage ($)
Races - White alone (%)
Races - White alone (% change since 2000)
Races - Black alone (%)
Races - Black alone (% change since 2000)
Races - American Indian alone (%)
Races - American Indian alone (% change since 2000)
Races - Asian alone (%)
Races - Asian alone (% change since 2000)
Races - Hispanic (%)
Races - Hispanic (% change since 2000)
Races - Native Hawaiian and Other Pacific Islander alone (%)
Races - Native Hawaiian and Other Pacific Islander alone (% change since 2000)
Races - Two or more races (%)
Races - Two or more races (% change since 2000)
Races - Other race alone (%)
Races - Other race alone (% change since 2000)
Racial diversity
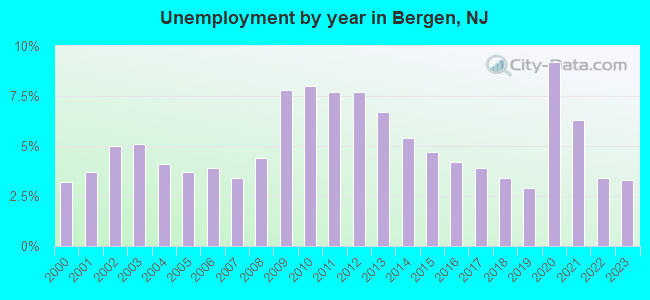
Unemployment (%)
Unemployment (% change since 2000)
Unemployment (%) - White
Unemployment (%) - Black or African American
Unemployment (%) - Asian
Unemployment (%) - Hispanic or Latino
Unemployment (%) - American Indian and Alaska Native
Unemployment (%) - Multirace
Unemployment (%) - Other Race
Population density (people per square mile)
Population - Males (%)
Population - Females (%)
Population - Males (%) - White
Population - Males (%) - Black or African American
Population - Males (%) - Asian
Population - Males (%) - Hispanic or Latino
Population - Males (%) - American Indian and Alaska Native
Population - Males (%) - Multirace
Population - Males (%) - Other Race
Population - Females (%) - White
Population - Females (%) - Black or African American
Population - Females (%) - Asian
Population - Females (%) - Hispanic or Latino
Population - Females (%) - American Indian and Alaska Native
Population - Females (%) - Multirace
Population - Females (%) - Other Race
Coronavirus confirmed cases (May 09, 2025)
Deaths caused by coronavirus (May 09, 2025)
Coronavirus confirmed cases (per 100k population) (May 09, 2025)
Deaths caused by coronavirus (per 100k population) (May 09, 2025)
Daily increase in number of cases (May 09, 2025)
Weekly increase in number of cases (May 09, 2025)
Cases doubled (in days) (May 09, 2025)
Hospitalized patients (Apr 18, 2022)
Negative test results (Apr 18, 2022)
Total test results (Apr 18, 2022)
COVID Vaccine doses distributed (per 100k population) (Sep 19, 2023)
COVID Vaccine doses administered (per 100k population) (Sep 19, 2023)
COVID Vaccine doses distributed (Sep 19, 2023)
COVID Vaccine doses administered (Sep 19, 2023)
Likely homosexual households (%)
Likely homosexual households (% change since 2000)
Likely homosexual households - Lesbian couples (%)
Likely homosexual households - Lesbian couples (% change since 2000)
Likely homosexual households - Gay men (%)
Likely homosexual households - Gay men (% change since 2000)
Cost of living index
Median gross rent ($)
Median contract rent ($)
Median monthly housing costs ($)
Median house or condo value ($)
Median house or condo value ($ change since 2000)
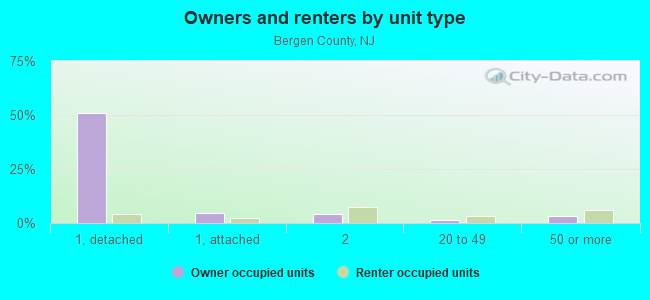
Mean house or condo value by units in structure - 1, detached ($)
Mean house or condo value by units in structure - 1, attached ($)
Mean house or condo value by units in structure - 2 ($)
Mean house or condo value by units in structure by units in structure - 3 or 4 ($)
Mean house or condo value by units in structure - 5 or more ($)
Mean house or condo value by units in structure - Boat, RV, van, etc. ($)
Mean house or condo value by units in structure - Mobile home ($)
Median house or condo value ($) - White
Median house or condo value ($) - Black or African American
Median house or condo value ($) - Asian
Median house or condo value ($) - Hispanic or Latino
Median house or condo value ($) - American Indian and Alaska Native
Median house or condo value ($) - Multirace
Median house or condo value ($) - Other Race
Median resident age
Resident age diversity
Median resident age - Males
Median resident age - Females
Median resident age - White
Median resident age - Black or African American
Median resident age - Asian
Median resident age - Hispanic or Latino
Median resident age - American Indian and Alaska Native
Median resident age - Multirace
Median resident age - Other Race
Median resident age - Males - White
Median resident age - Males - Black or African American
Median resident age - Males - Asian
Median resident age - Males - Hispanic or Latino
Median resident age - Males - American Indian and Alaska Native
Median resident age - Males - Multirace
Median resident age - Males - Other Race
Median resident age - Females - White
Median resident age - Females - Black or African American
Median resident age - Females - Asian
Median resident age - Females - Hispanic or Latino
Median resident age - Females - American Indian and Alaska Native
Median resident age - Females - Multirace
Median resident age - Females - Other Race
Commute - mean travel time to work (minutes)
Travel time to work - Less than 5 minutes (%)
Travel time to work - Less than 5 minutes (% change since 2000)
Travel time to work - 5 to 9 minutes (%)
Travel time to work - 5 to 9 minutes (% change since 2000)
Travel time to work - 10 to 19 minutes (%)
Travel time to work - 10 to 19 minutes (% change since 2000)
Travel time to work - 20 to 29 minutes (%)
Travel time to work - 20 to 29 minutes (% change since 2000)
Travel time to work - 30 to 39 minutes (%)
Travel time to work - 30 to 39 minutes (% change since 2000)
Travel time to work - 40 to 59 minutes (%)
Travel time to work - 40 to 59 minutes (% change since 2000)
Travel time to work - 60 to 89 minutes (%)
Travel time to work - 60 to 89 minutes (% change since 2000)
Travel time to work - 90 or more minutes (%)
Travel time to work - 90 or more minutes (% change since 2000)
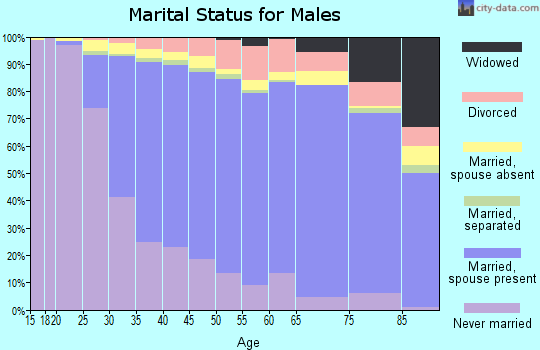
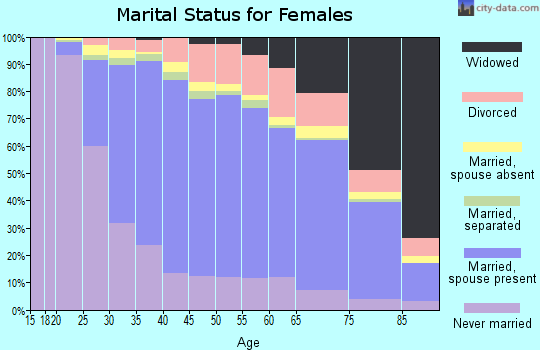
Marital status - Never married (%)
Marital status - Now married (%)
Marital status - Separated (%)
Marital status - Widowed (%)
Marital status - Divorced (%)
Median family income ($)
Median family income (% change since 2000)
Median non-family income ($)
Median non-family income (% change since 2000)
Median per capita income ($)
Median per capita income (% change since 2000)
Median family income ($) - White
Median family income ($) - Black or African American
Median family income ($) - Asian
Median family income ($) - Hispanic or Latino
Median family income ($) - American Indian and Alaska Native
Median family income ($) - Multirace
Median family income ($) - Other Race
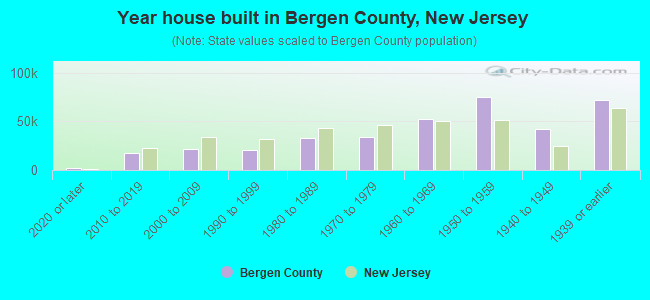
Median year house/condo built
Median year apartment built
Year house built - Built 2005 or later (%)
Year house built - Built 2000 to 2004 (%)
Year house built - Built 1990 to 1999 (%)
Year house built - Built 1980 to 1989 (%)
Year house built - Built 1970 to 1979 (%)
Year house built - Built 1960 to 1969 (%)
Year house built - Built 1950 to 1959 (%)
Year house built - Built 1940 to 1949 (%)
Year house built - Built 1939 or earlier (%)
Average household size
Household density (households per square mile)
Average household size - White
Average household size - Black or African American
Average household size - Asian
Average household size - Hispanic or Latino
Average household size - American Indian and Alaska Native
Average household size - Multirace
Average household size - Other Race
Occupied housing units (%)
Vacant housing units (%)
Owner occupied housing units (%)
Renter occupied housing units (%)
Vacancy status - For rent (%)
Vacancy status - For sale only (%)
Vacancy status - Rented or sold, not occupied (%)
Vacancy status - For seasonal, recreational, or occasional use (%)
Vacancy status - For migrant workers (%)
Vacancy status - Other vacant (%)
Residents with income below the poverty level (%)
Residents with income below 50% of the poverty level (%)
Children below poverty level (%)
Poor families by family type - Married-couple family (%)
Poor families by family type - Male, no wife present (%)
Poor families by family type - Female, no husband present (%)
Poverty status for native-born residents (%)
Poverty status for foreign-born residents (%)
Poverty among high school graduates not in families (%)
Poverty among people who did not graduate high school not in families (%)
Residents with income below the poverty level (%) - White
Residents with income below the poverty level (%) - Black or African American
Residents with income below the poverty level (%) - Asian
Residents with income below the poverty level (%) - Hispanic or Latino
Residents with income below the poverty level (%) - American Indian and Alaska Native
Residents with income below the poverty level (%) - Multirace
Residents with income below the poverty level (%) - Other Race
Air pollution - Air Quality Index (AQI)
Air pollution - CO
Air pollution - NO2
Air pollution - SO2
Air pollution - Ozone
Air pollution - PM10
Air pollution - PM25
Air pollution - Pb
Crime - Murders per 100,000 population
Crime - Rapes per 100,000 population
Crime - Robberies per 100,000 population
Crime - Assaults per 100,000 population
Crime - Burglaries per 100,000 population
Crime - Thefts per 100,000 population
Crime - Auto thefts per 100,000 population
Crime - Arson per 100,000 population
Crime - City-data.com crime index
Crime - Violent crime index
Crime - Property crime index
Crime - Murders per 100,000 population (5 year average)
Crime - Rapes per 100,000 population (5 year average)
Crime - Robberies per 100,000 population (5 year average)
Crime - Assaults per 100,000 population (5 year average)
Crime - Burglaries per 100,000 population (5 year average)
Crime - Thefts per 100,000 population (5 year average)
Crime - Auto thefts per 100,000 population (5 year average)
Crime - Arson per 100,000 population (5 year average)
Crime - City-data.com crime index (5 year average)
Crime - Violent crime index (5 year average)
Crime - Property crime index (5 year average)
1996 Presidential Elections Results (%) - Democratic Party (Clinton)
1996 Presidential Elections Results (%) - Republican Party (Dole)
1996 Presidential Elections Results (%) - Other
2000 Presidential Elections Results (%) - Democratic Party (Gore)
2000 Presidential Elections Results (%) - Republican Party (Bush)
2000 Presidential Elections Results (%) - Other
2004 Presidential Elections Results (%) - Democratic Party (Kerry)
2004 Presidential Elections Results (%) - Republican Party (Bush)
2004 Presidential Elections Results (%) - Other
2008 Presidential Elections Results (%) - Democratic Party (Obama)
2008 Presidential Elections Results (%) - Republican Party (McCain)
2008 Presidential Elections Results (%) - Other
2012 Presidential Elections Results (%) - Democratic Party (Obama)
2012 Presidential Elections Results (%) - Republican Party (Romney)
2012 Presidential Elections Results (%) - Other
2016 Presidential Elections Results (%) - Democratic Party (Clinton)
2016 Presidential Elections Results (%) - Republican Party (Trump)
2016 Presidential Elections Results (%) - Other
2020 Presidential Elections Results (%) - Democratic Party (Biden)
2020 Presidential Elections Results (%) - Republican Party (Trump)
2020 Presidential Elections Results (%) - Other
Ancestries Reported - Arab (%)
Ancestries Reported - Czech (%)
Ancestries Reported - Danish (%)
Ancestries Reported - Dutch (%)
Ancestries Reported - English (%)
Ancestries Reported - French (%)
Ancestries Reported - French Canadian (%)
Ancestries Reported - German (%)
Ancestries Reported - Greek (%)
Ancestries Reported - Hungarian (%)
Ancestries Reported - Irish (%)
Ancestries Reported - Italian (%)
Ancestries Reported - Lithuanian (%)
Ancestries Reported - Norwegian (%)
Ancestries Reported - Polish (%)
Ancestries Reported - Portuguese (%)
Ancestries Reported - Russian (%)
Ancestries Reported - Scotch-Irish (%)
Ancestries Reported - Scottish (%)
Ancestries Reported - Slovak (%)
Ancestries Reported - Subsaharan African (%)
Ancestries Reported - Swedish (%)
Ancestries Reported - Swiss (%)
Ancestries Reported - Ukrainian (%)
Ancestries Reported - United States (%)
Ancestries Reported - Welsh (%)
Ancestries Reported - West Indian (%)
Ancestries Reported - Other (%)
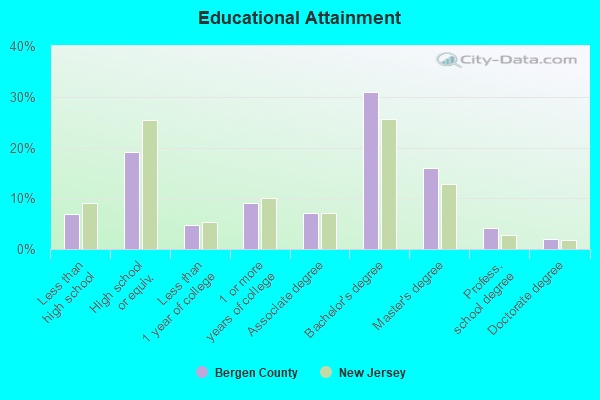
Educational Attainment - No schooling completed (%)
Educational Attainment - Less than high school (%)
Educational Attainment - High school or equivalent (%)
Educational Attainment - Less than 1 year of college (%)
Educational Attainment - 1 or more years of college (%)
Educational Attainment - Associate degree (%)
Educational Attainment - Bachelor's degree (%)
Educational Attainment - Master's degree (%)
Educational Attainment - Professional school degree (%)
Educational Attainment - Doctorate degree (%)
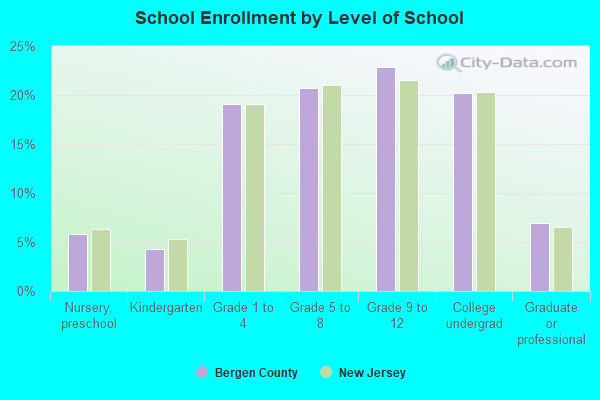
School Enrollment - Nursery, preschool (%)
School Enrollment - Kindergarten (%)
School Enrollment - Grade 1 to 4 (%)
School Enrollment - Grade 5 to 8 (%)
School Enrollment - Grade 9 to 12 (%)
School Enrollment - College undergrad (%)
School Enrollment - Graduate or professional (%)
School Enrollment - Not enrolled in school (%)
School enrollment - Public schools (%)
School enrollment - Private schools (%)
School enrollment - Not enrolled (%)
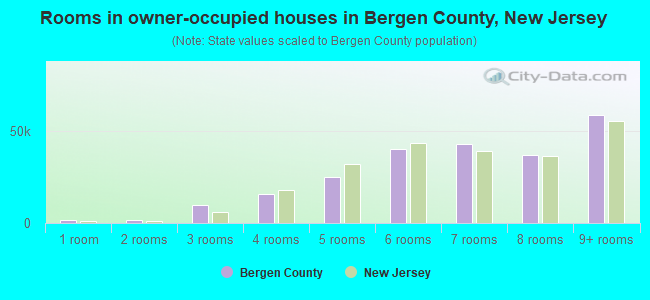
Median number of rooms in houses and condos
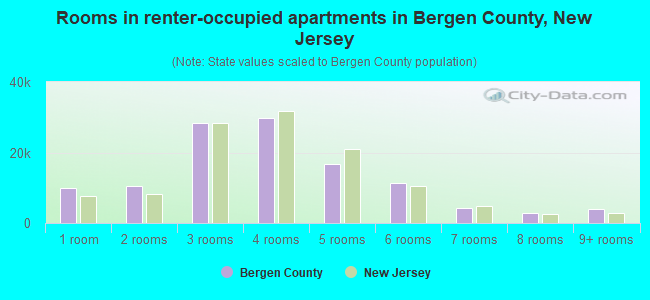
Median number of rooms in apartments
Housing units lacking complete plumbing facilities (%)
Housing units lacking complete kitchen facilities (%)
Density of houses
Urban houses (%)
Rural houses (%)
Households with people 60 years and over (%)
Households with people 65 years and over (%)
Households with people 75 years and over (%)
Households with one or more nonrelatives (%)
Households with no nonrelatives (%)
Population in households (%)
Family households (%)
Nonfamily households (%)
Population in families (%)
Family households with own children (%)
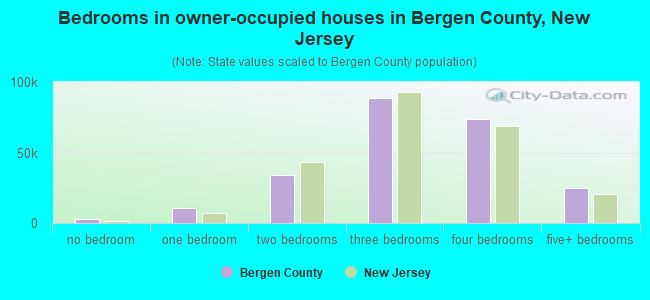
Median number of bedrooms in owner occupied houses
Mean number of bedrooms in owner occupied houses
Median number of bedrooms in renter occupied houses
Mean number of bedrooms in renter occupied houses
Median number of vehichles in owner occupied houses
Mean number of vehichles in owner occupied houses
Median number of vehichles in renter occupied houses
Mean number of vehichles in renter occupied houses
Mortgage status - with mortgage (%)
Mortgage status - with second mortgage (%)
Mortgage status - with home equity loan (%)
Mortgage status - with both second mortgage and home equity loan (%)
Mortgage status - without a mortgage (%)
Average family size
Average family size - White
Average family size - Black or African American
Average family size - Asian
Average family size - Hispanic or Latino
Average family size - American Indian and Alaska Native
Average family size - Multirace
Average family size - Other Race
Geographical mobility - Same house 1 year ago (%)
Geographical mobility - Moved within same county (%)
Geographical mobility - Moved from different county within same state (%)
Geographical mobility - Moved from different state (%)
Geographical mobility - Moved from abroad (%)
Place of birth - Born in state of residence (%)
Place of birth - Born in other state (%)
Place of birth - Native, outside of US (%)
Place of birth - Foreign born (%)
Housing units in structures - 1, detached (%)
Housing units in structures - 1, attached (%)
Housing units in structures - 2 (%)
Housing units in structures - 3 or 4 (%)
Housing units in structures - 5 to 9 (%)
Housing units in structures - 10 to 19 (%)
Housing units in structures - 20 to 49 (%)
Housing units in structures - 50 or more (%)
Housing units in structures - Mobile home (%)
Housing units in structures - Boat, RV, van, etc. (%)
House/condo owner moved in on average (years ago)
Renter moved in on average (years ago)
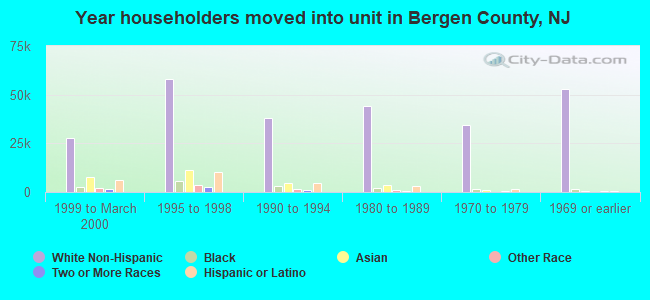
Year householder moved into unit - Moved in 1999 to March 2000 (%)
Year householder moved into unit - Moved in 1995 to 1998 (%)
Year householder moved into unit - Moved in 1990 to 1994 (%)
Year householder moved into unit - Moved in 1980 to 1989 (%)
Year householder moved into unit - Moved in 1970 to 1979 (%)
Year householder moved into unit - Moved in 1969 or earlier (%)
Means of transportation to work - Drove car alone (%)
Means of transportation to work - Carpooled (%)
Means of transportation to work - Public transportation (%)
Means of transportation to work - Bus or trolley bus (%)
Means of transportation to work - Streetcar or trolley car (%)
Means of transportation to work - Subway or elevated (%)
Means of transportation to work - Railroad (%)
Means of transportation to work - Ferryboat (%)
Means of transportation to work - Taxicab (%)
Means of transportation to work - Motorcycle (%)
Means of transportation to work - Bicycle (%)
Means of transportation to work - Walked (%)
Means of transportation to work - Other means (%)
Working at home (%)
Industry diversity
Most Common Industries - Agriculture, forestry, fishing and hunting, and mining (%)
Most Common Industries - Agriculture, forestry, fishing and hunting (%)
Most Common Industries - Mining, quarrying, and oil and gas extraction (%)
Most Common Industries - Construction (%)
Most Common Industries - Manufacturing (%)
Most Common Industries - Wholesale trade (%)
Most Common Industries - Retail trade (%)
Most Common Industries - Transportation and warehousing, and utilities (%)
Most Common Industries - Transportation and warehousing (%)
Most Common Industries - Utilities (%)
Most Common Industries - Information (%)
Most Common Industries - Finance and insurance, and real estate and rental and leasing (%)
Most Common Industries - Finance and insurance (%)
Most Common Industries - Real estate and rental and leasing (%)
Most Common Industries - Professional, scientific, and management, and administrative and waste management services (%)
Most Common Industries - Professional, scientific, and technical services (%)
Most Common Industries - Management of companies and enterprises (%)
Most Common Industries - Administrative and support and waste management services (%)
Most Common Industries - Educational services, and health care and social assistance (%)
Most Common Industries - Educational services (%)
Most Common Industries - Health care and social assistance (%)
Most Common Industries - Arts, entertainment, and recreation, and accommodation and food services (%)
Most Common Industries - Arts, entertainment, and recreation (%)
Most Common Industries - Accommodation and food services (%)
Most Common Industries - Other services, except public administration (%)
Most Common Industries - Public administration (%)
Occupation diversity
Most Common Occupations - Management, business, science, and arts occupations (%)
Most Common Occupations - Management, business, and financial occupations (%)
Most Common Occupations - Management occupations (%)
Most Common Occupations - Business and financial operations occupations (%)
Most Common Occupations - Computer, engineering, and science occupations (%)
Most Common Occupations - Computer and mathematical occupations (%)
Most Common Occupations - Architecture and engineering occupations (%)
Most Common Occupations - Life, physical, and social science occupations (%)
Most Common Occupations - Education, legal, community service, arts, and media occupations (%)
Most Common Occupations - Community and social service occupations (%)
Most Common Occupations - Legal occupations (%)
Most Common Occupations - Education, training, and library occupations (%)
Most Common Occupations - Arts, design, entertainment, sports, and media occupations (%)
Most Common Occupations - Healthcare practitioners and technical occupations (%)
Most Common Occupations - Health diagnosing and treating practitioners and other technical occupations (%)
Most Common Occupations - Health technologists and technicians (%)
Most Common Occupations - Service occupations (%)
Most Common Occupations - Healthcare support occupations (%)
Most Common Occupations - Protective service occupations (%)
Most Common Occupations - Fire fighting and prevention, and other protective service workers including supervisors (%)
Most Common Occupations - Law enforcement workers including supervisors (%)
Most Common Occupations - Food preparation and serving related occupations (%)
Most Common Occupations - Building and grounds cleaning and maintenance occupations (%)
Most Common Occupations - Personal care and service occupations (%)
Most Common Occupations - Sales and office occupations (%)
Most Common Occupations - Sales and related occupations (%)
Most Common Occupations - Office and administrative support occupations (%)
Most Common Occupations - Natural resources, construction, and maintenance occupations (%)
Most Common Occupations - Farming, fishing, and forestry occupations (%)
Most Common Occupations - Construction and extraction occupations (%)
Most Common Occupations - Installation, maintenance, and repair occupations (%)
Most Common Occupations - Production, transportation, and material moving occupations (%)
Most Common Occupations - Production occupations (%)
Most Common Occupations - Transportation occupations (%)
Most Common Occupations - Material moving occupations (%)
People in Group quarters - Institutionalized population (%)
People in Group quarters - Correctional institutions (%)
People in Group quarters - Federal prisons and detention centers (%)
People in Group quarters - Halfway houses (%)
People in Group quarters - Local jails and other confinement facilities (including police lockups) (%)
People in Group quarters - Military disciplinary barracks (%)
People in Group quarters - State prisons (%)
People in Group quarters - Other types of correctional institutions (%)
People in Group quarters - Nursing homes (%)
People in Group quarters - Hospitals/wards, hospices, and schools for the handicapped (%)
People in Group quarters - Hospitals/wards and hospices for chronically ill (%)
People in Group quarters - Hospices or homes for chronically ill (%)
People in Group quarters - Military hospitals or wards for chronically ill (%)
People in Group quarters - Other hospitals or wards for chronically ill (%)
People in Group quarters - Hospitals or wards for drug/alcohol abuse (%)
People in Group quarters - Mental (Psychiatric) hospitals or wards (%)
People in Group quarters - Schools, hospitals, or wards for the mentally retarded (%)
People in Group quarters - Schools, hospitals, or wards for the physically handicapped (%)
People in Group quarters - Institutions for the deaf (%)
People in Group quarters - Institutions for the blind (%)
People in Group quarters - Orthopedic wards and institutions for the physically handicapped (%)
People in Group quarters - Wards in general hospitals for patients who have no usual home elsewhere (%)
People in Group quarters - Wards in military hospitals for patients who have no usual home elsewhere (%)
People in Group quarters - Juvenile institutions (%)
People in Group quarters - Long-term care (%)
People in Group quarters - Homes for abused, dependent, and neglected children (%)
People in Group quarters - Residential treatment centers for emotionally disturbed children (%)
People in Group quarters - Training schools for juvenile delinquents (%)
People in Group quarters - Short-term care, detention or diagnostic centers for delinquent children (%)
People in Group quarters - Type of juvenile institution unknown (%)
People in Group quarters - Noninstitutionalized population (%)
People in Group quarters - College dormitories (includes college quarters off campus) (%)
People in Group quarters - Military quarters (%)
People in Group quarters - On base (%)
People in Group quarters - Barracks, unaccompanied personnel housing (UPH), (Enlisted/Officer), ;and similar group living quarters for military personnel (%)
People in Group quarters - Transient quarters for temporary residents (%)
People in Group quarters - Military ships (%)
People in Group quarters - Group homes (%)
People in Group quarters - Homes or halfway houses for drug/alcohol abuse (%)
People in Group quarters - Homes for the mentally ill (%)
People in Group quarters - Homes for the mentally retarded (%)
People in Group quarters - Homes for the physically handicapped (%)
People in Group quarters - Other group homes (%)
People in Group quarters - Religious group quarters (%)
People in Group quarters - Dormitories (%)
People in Group quarters - Agriculture workers' dormitories on farms (%)
People in Group quarters - Job Corps and vocational training facilities (%)
People in Group quarters - Other workers' dormitories (%)
People in Group quarters - Crews of maritime vessels (%)
People in Group quarters - Other nonhousehold living situations (%)
People in Group quarters - Other noninstitutional group quarters (%)
Residents speaking English at home (%)
Residents speaking English at home - Born in the United States (%)
Residents speaking English at home - Native, born elsewhere (%)
Residents speaking English at home - Foreign born (%)
Residents speaking Spanish at home (%)
Residents speaking Spanish at home - Born in the United States (%)
Residents speaking Spanish at home - Native, born elsewhere (%)
Residents speaking Spanish at home - Foreign born (%)
Residents speaking other language at home (%)
Residents speaking other language at home - Born in the United States (%)
Residents speaking other language at home - Native, born elsewhere (%)
Residents speaking other language at home - Foreign born (%)
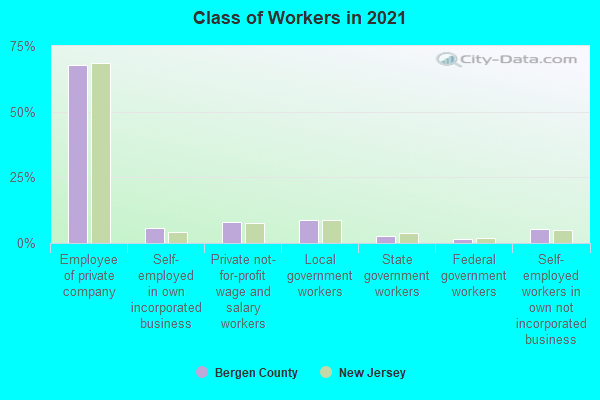
Class of Workers - Employee of private company (%)
Class of Workers - Self-employed in own incorporated business (%)
Class of Workers - Private not-for-profit wage and salary workers (%)
Class of Workers - Local government workers (%)
Class of Workers - State government workers (%)
Class of Workers - Federal government workers (%)
Class of Workers - Self-employed workers in own not incorporated business and Unpaid family workers (%)
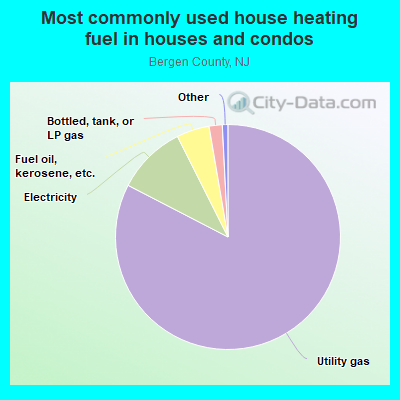
House heating fuel used in houses and condos - Utility gas (%)
House heating fuel used in houses and condos - Bottled, tank, or LP gas (%)
House heating fuel used in houses and condos - Electricity (%)
House heating fuel used in houses and condos - Fuel oil, kerosene, etc. (%)
House heating fuel used in houses and condos - Coal or coke (%)
House heating fuel used in houses and condos - Wood (%)
House heating fuel used in houses and condos - Solar energy (%)
House heating fuel used in houses and condos - Other fuel (%)
House heating fuel used in houses and condos - No fuel used (%)
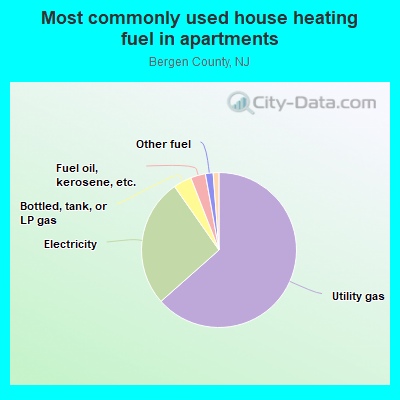
House heating fuel used in apartments - Utility gas (%)
House heating fuel used in apartments - Bottled, tank, or LP gas (%)
House heating fuel used in apartments - Electricity (%)
House heating fuel used in apartments - Fuel oil, kerosene, etc. (%)
House heating fuel used in apartments - Coal or coke (%)
House heating fuel used in apartments - Wood (%)
House heating fuel used in apartments - Solar energy (%)
House heating fuel used in apartments - Other fuel (%)
House heating fuel used in apartments - No fuel used (%)
Armed forces status - In Armed Forces (%)
Armed forces status - Civilian (%)
Armed forces status - Civilian - Veteran (%)
Armed forces status - Civilian - Nonveteran (%)
Read more: https://www.city-data.com/accidents/acc-Addison-Illinois.html
Fatal accidents locations in years 2005-2022
Fatal accidents locations in 2022
Fatal accidents locations in 2021
Fatal accidents locations in 2020
Fatal accidents locations in 2019
Fatal accidents locations in 2018
Fatal accidents locations in 2017
Fatal accidents locations in 2016
Fatal accidents locations in 2015
Fatal accidents locations in 2014
Fatal accidents locations in 2013
Fatal accidents locations in 2012
Fatal accidents locations in 2011
Fatal accidents locations in 2010
Fatal accidents locations in 2009
Fatal accidents locations in 2008
Fatal accidents locations in 2007
Fatal accidents locations in 2006
Fatal accidents locations in 2005
Alcohol use - People drinking some alcohol every month (%)
Alcohol use - People not drinking at all (%)
Alcohol use - Average days/month drinking alcohol
Alcohol use - Average drinks/week
Alcohol use - Average days/year people drink much
Audiometry - Average condition of hearing (%)
Audiometry - People that can hear a whisper from across a quiet room (%)
Audiometry - People that can hear normal voice from across a quiet room (%)
Audiometry - Ears ringing, roaring, buzzing (%)
Audiometry - Had a job exposure to loud noise (%)
Audiometry - Had off-work exposure to loud noise (%)
Blood Pressure & Cholesterol - Has high blood pressure (%)
Blood Pressure & Cholesterol - Checking blood pressure at home (%)
Blood Pressure & Cholesterol - Frequently checking blood cholesterol (%)
Blood Pressure & Cholesterol - Has high cholesterol level (%)
Consumer Behavior - Money monthly spent on food at supermarket/grocery store
Consumer Behavior - Money monthly spent on food at other stores
Consumer Behavior - Money monthly spent on eating out
Consumer Behavior - Money monthly spent on carryout/delivered foods
Consumer Behavior - Income spent on food at supermarket/grocery store (%)
Consumer Behavior - Income spent on food at other stores (%)
Consumer Behavior - Income spent on eating out (%)
Consumer Behavior - Income spent on carryout/delivered foods (%)
Current Health Status - General health condition (%)
Current Health Status - Blood donors (%)
Current Health Status - Has blood ever tested for HIV virus (%)
Current Health Status - Left-handed people (%)
Dermatology - People using sunscreen (%)
Diabetes - Diabetics (%)
Diabetes - Had a blood test for high blood sugar (%)
Diabetes - People taking insulin (%)
Diet Behavior & Nutrition - Diet health (%)
Diet Behavior & Nutrition - Milk product consumption (# of products/month)
Diet Behavior & Nutrition - Meals not home prepared (#/week)
Diet Behavior & Nutrition - Meals from fast food or pizza place (#/week)
Diet Behavior & Nutrition - Ready-to-eat foods (#/month)
Diet Behavior & Nutrition - Frozen meals/pizza (#/month)
Drug Use - People that ever used marijuana or hashish (%)
Drug Use - Ever used hard drugs (%)
Drug Use - Ever used any form of cocaine (%)
Drug Use - Ever used heroin (%)
Drug Use - Ever used methamphetamine (%)
Health Insurance - People covered by health insurance (%)
Kidney Conditions-Urology - Avg. # of times urinating at night
Medical Conditions - People with asthma (%)
Medical Conditions - People with anemia (%)
Medical Conditions - People with psoriasis (%)
Medical Conditions - People with overweight (%)
Medical Conditions - Elderly people having difficulties in thinking or remembering (%)
Medical Conditions - People who ever received blood transfusion (%)
Medical Conditions - People having trouble seeing even with glass/contacts (%)
Medical Conditions - People with arthritis (%)
Medical Conditions - People with gout (%)
Medical Conditions - People with congestive heart failure (%)
Medical Conditions - People with coronary heart disease (%)
Medical Conditions - People with angina pectoris (%)
Medical Conditions - People who ever had heart attack (%)
Medical Conditions - People who ever had stroke (%)
Medical Conditions - People with emphysema (%)
Medical Conditions - People with thyroid problem (%)
Medical Conditions - People with chronic bronchitis (%)
Medical Conditions - People with any liver condition (%)
Medical Conditions - People who ever had cancer or malignancy (%)
Mental Health - People who have little interest in doing things (%)
Mental Health - People feeling down, depressed, or hopeless (%)
Mental Health - People who have trouble sleeping or sleeping too much (%)
Mental Health - People feeling tired or having little energy (%)
Mental Health - People with poor appetite or overeating (%)
Mental Health - People feeling bad about themself (%)
Mental Health - People who have trouble concentrating on things (%)
Mental Health - People moving or speaking slowly or too fast (%)
Mental Health - People having thoughts they would be better off dead (%)
Oral Health - Average years since last visit a dentist
Oral Health - People embarrassed because of mouth (%)
Oral Health - People with gum disease (%)
Oral Health - General health of teeth and gums (%)
Oral Health - Average days a week using dental floss/device
Oral Health - Average days a week using mouthwash for dental problem
Oral Health - Average number of teeth
Pesticide Use - Households using pesticides to control insects (%)
Pesticide Use - Households using pesticides to kill weeds (%)
Physical Activity - People doing vigorous-intensity work activities (%)
Physical Activity - People doing moderate-intensity work activities (%)
Physical Activity - People walking or bicycling (%)
Physical Activity - People doing vigorous-intensity recreational activities (%)
Physical Activity - People doing moderate-intensity recreational activities (%)
Physical Activity - Average hours a day doing sedentary activities
Physical Activity - Average hours a day watching TV or videos
Physical Activity - Average hours a day using computer
Physical Functioning - People having limitations keeping them from working (%)
Physical Functioning - People limited in amount of work they can do (%)
Physical Functioning - People that need special equipment to walk (%)
Physical Functioning - People experiencing confusion/memory problems (%)
Physical Functioning - People requiring special healthcare equipment (%)
Prescription Medications - Average number of prescription medicines taking
Preventive Aspirin Use - Adults 40+ taking low-dose aspirin (%)
Reproductive Health - Vaginal deliveries (%)
Reproductive Health - Cesarean deliveries (%)
Reproductive Health - Deliveries resulted in a live birth (%)
Reproductive Health - Pregnancies resulted in a delivery (%)
Reproductive Health - Women breastfeeding newborns (%)
Reproductive Health - Women that had a hysterectomy (%)
Reproductive Health - Women that had both ovaries removed (%)
Reproductive Health - Women that have ever taken birth control pills (%)
Reproductive Health - Women taking birth control pills (%)
Reproductive Health - Women that have ever used Depo-Provera or injectables (%)
Reproductive Health - Women that have ever used female hormones (%)
Sexual Behavior - People 18+ that ever had sex (vaginal, anal, or oral) (%)
Sexual Behavior - Males 18+ that ever had vaginal sex with a woman (%)
Sexual Behavior - Males 18+ that ever performed oral sex on a woman (%)
Sexual Behavior - Males 18+ that ever had anal sex with a woman (%)
Sexual Behavior - Males 18+ that ever had any sex with a man (%)
Sexual Behavior - Females 18+ that ever had vaginal sex with a man (%)
Sexual Behavior - Females 18+ that ever performed oral sex on a man (%)
Sexual Behavior - Females 18+ that ever had anal sex with a man (%)
Sexual Behavior - Females 18+ that ever had any kind of sex with a woman (%)
Sexual Behavior - Average age people first had sex
Sexual Behavior - Average number of female sex partners in lifetime (males 18+)
Sexual Behavior - Average number of female vaginal sex partners in lifetime (males 18+)
Sexual Behavior - Average age people first performed oral sex on a woman (18+)
Sexual Behavior - Average number of woman performed oral sex on in lifetime (18+)
Sexual Behavior - Average number of male sex partners in lifetime (males 18+)
Sexual Behavior - Average number of male anal sex partners in lifetime (males 18+)
Sexual Behavior - Average age people first performed oral sex on a man (18+)
Sexual Behavior - Average number of male oral sex partners in lifetime (18+)
Sexual Behavior - People using protection when performing oral sex (%)
Sexual Behavior - Average number of times people have vaginal or anal sex a year
Sexual Behavior - People having sex without condom (%)
Sexual Behavior - Average number of male sex partners in lifetime (females 18+)
Sexual Behavior - Average number of male vaginal sex partners in lifetime (females 18+)
Sexual Behavior - Average number of female sex partners in lifetime (females 18+)
Sexual Behavior - Circumcised males 18+ (%)
Sleep Disorders - Average hours sleeping at night
Sleep Disorders - People that has trouble sleeping (%)
Smoking-Cigarette Use - People smoking cigarettes (%)
Taste & Smell - People 40+ having problems with smell (%)
Taste & Smell - People 40+ having problems with taste (%)
Taste & Smell - People 40+ that ever had wisdom teeth removed (%)
Taste & Smell - People 40+ that ever had tonsils teeth removed (%)
Taste & Smell - People 40+ that ever had a loss of consciousness because of a head injury (%)
Taste & Smell - People 40+ that ever had a broken nose or other serious injury to face or skull (%)
Taste & Smell - People 40+ that ever had two or more sinus infections (%)
Weight - Average height (inches)
Weight - Average weight (pounds)
Weight - Average BMI
Weight - People that are obese (%)
Weight - People that ever were obese (%)
Weight - People trying to lose weight (%)
483,972 50.5% White Non-Hispanic Alone 223,107 23.3% Hispanic or Latino 161,859 16.9% Asian alone 51,290 5.4% Black Non-Hispanic Alone 27,839 2.9% Two or more races 8,789 0.9% Some other race alone 487 0.05% American Indian and Alaska Native alone 393 0.04% Native Hawaiian and Other Males: 469,887 Females: 487,849
Average household size: Bergen County:
2.0 peopleNew Jersey:
3 people
Estimated median household income in 2023: $116,709 ($65,241 in 1999)This county:
$116,709New Jersey:
$99,781
Median contract rent in 2023 for apartments: $1,743 (lower quartile is $1,349, upper quartile is $2,327)This county:
$1743State:
$1498
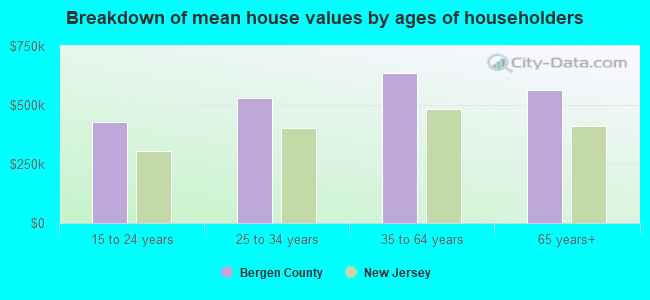
Estimated median house or condo value in 2023: $615,300 (it was $240,800 in 2000 )
Bergen:
$615,300New Jersey:
$461,000
Lower value quartile - upper value quartile: $447,200 - $826,100Mean price in 2023: Detached houses: $781,375 Here:
$781,375State:
$577,222
Townhouses or other attached units: $665,389 Here:
$665,389State:
$405,342
In 2-unit structures: $545,668 Here:
$545,668State:
$486,852
In 3-to-4-unit structures: $527,855 Here:
$527,855State:
$452,487
In 5-or-more-unit structures: $433,446 Here:
$433,446State:
$419,972
Mobile homes: $453,358 Here:
$453,358State:
$187,764
Occupied boats, RVs, vans, etc.: $17,434 Here:
$17,434State:
$894,352
Median monthly housing costs for homes and condos with a mortgage: $3,402Median monthly housing costs for units without a mortgage: $1,420Institutionalized population: 5,047
Crime in 2019 (reported by the sheriff's office or county police, not the county total):
Murders: 0
Rapes: 2
Robberies: 0
Assaults: 0
Burglaries: 2
Thefts: 44
Auto thefts: 0
Crime in 2017 (reported by the sheriff's office or county police, not the county total):
Murders: 0
Rapes: 4
Robberies: 0
Assaults: 3
Burglaries: 1
Thefts: 48
Auto thefts: 2
Health of residents in Bergen County based on CDC Behavioral Risk Factor Surveillance System Survey Questionnaires from 2003 to 2012:
General health status score of residents in this county from 1 (poor) to 5 (excellent) is 3.7. This is better than average.
of residents exercised in the past month. This is about average.
of residents smoked 100+ cigarettes in their lives. This is about average.
of adult residents drank alcohol in the past 30 days. This is about average.
of residents visited a dentist within the past year. This is more than average.
Average weight of males is 192 pounds. This is about average.
Average weight of females is 158 pounds. This is about average.
of residents keep firearms around their homes. This is less than average.
Single-family new house construction building permits:
2023: 1380 buildings, average cost: $260,8002022: 1585 buildings, average cost: $206,2002021: 1682 buildings, average cost: $224,8002020: 1175 buildings, average cost: $200,3002019: 806 buildings, average cost: $337,8002018: 838 buildings, average cost: $337,5002017: 833 buildings, average cost: $343,7002016: 1057 buildings, average cost: $327,3002015: 946 buildings, average cost: $365,9002014: 1002 buildings, average cost: $316,7002013: 846 buildings, average cost: $351,3002012: 643 buildings, average cost: $359,2002011: 498 buildings, average cost: $404,6002010: 606 buildings, average cost: $378,4002009: 544 buildings, average cost: $363,3002008: 671 buildings, average cost: $351,4002007: 981 buildings, average cost: $359,1002006: 1096 buildings, average cost: $339,9002005: 1220 buildings, average cost: $301,9002004: 914 buildings, average cost: $321,1002003: 760 buildings, average cost: $287,2002002: 1015 buildings, average cost: $228,7002001: 1010 buildings, average cost: $196,3002000: 1076 buildings, average cost: $196,6001999: 1062 buildings, average cost: $184,2001998: 823 buildings, average cost: $213,0001997: 921 buildings, average cost: $185,000Median real estate property taxes paid for housing units with mortgages in 2023: $10,001 (1.6%)Median real estate property taxes paid for housing units with no mortgage in 2023: $10,001 (1.7%)
Percentage of residents living in poverty in 2023: 6.6%Bergen County:
6.6%New Jersey:
9.7%
for White Non-Hispanic residents , 16.9% for Black residents , 7.9% for Hispanic or Latino residents , 13.1% for American Indian residents , 15.2% for Native Hawaiian and other Pacific Islander residents , 7.3% for other race residents , 7.7% for two or more races residents )Median age of residents in 2023: 42.2 years oldMales: 41.2 years old, Females: 43.7 years old)Median age for: White residents: 48.0 years old, Black residents: 39.6 years old, American Indian residents: 28.4 years old, Asian residents: 42.6 years old, Hispanic or Latino residents: 35.7 years old, Other race residents: 36.9 years old)
Area name: Bergen-Passaic, NJ HUD Metro FMR AreaFair market rent in 2006 for a 1-bedroom apartment in Bergen County is $979 a month.Fair market rent for a 2-bedroom apartment is $1098 a month.Fair market rent for a 3-bedroom apartment is $1356 a month.
Bergen County has a predicted average indoor radon screening level between 2 and 4 pCi/L (pico curies per liter) - Moderate Potential
2023 air pollution in Bergen County:
Carbon Monoxide: 0.337 ppm (standard limit: 9 ppm). Above U.S. average.Nitrogen Dioxide: 0.02 ppm (standard limit: 0.053 ppm). Significanly above U.S. average.Ozone (1-hour): 0.031 ppm (standard limit: 0.12 ppm). Near U.S. average.Particulate Matter (PM2.5 ) Annual: 9.5 µg/m3 (standard limit: 15.0 µg/m3 ). Near U.S. average.
Unemployment in November 2024: Current college students: 50,740People 25 years of age or older with a high school degree or higher: 92.7%People 25 years of age or older with a bachelor's degree or higher: 53.3%
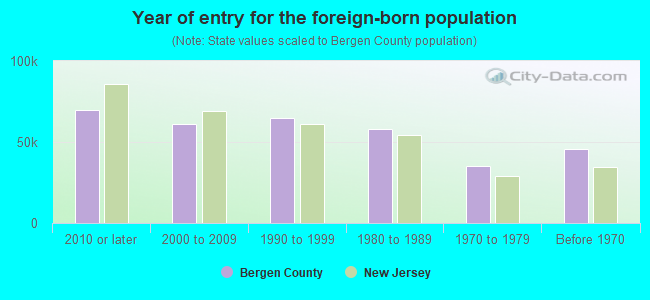
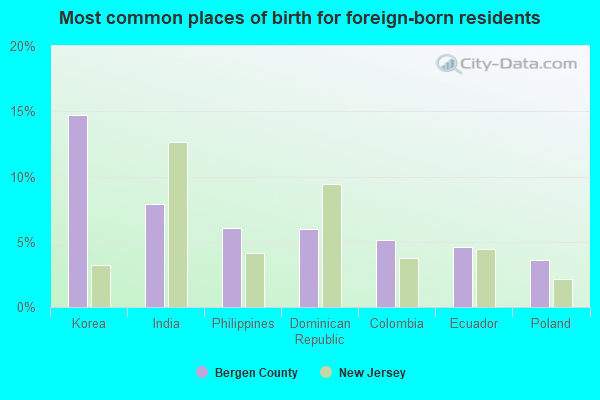
Number of foreign born residents: 302,905 (67.6% naturalized citizens )
Bergen County:
31.6%Whole state:
24.2%
Year of entry for the foreign-born population
80,784 2010 or later 58,108 2000 to 2009 70,892 1990 to 1999 57,792 1980 to 1989 35,198 1970 to 1979 45,855 Before 1970
Mean travel time to work (commute): minutes
Percentage of county residents living and working in this county: 77.8%
Housing units in structures:
One, detached: 190,976One, attached: 24,092Two: 47,0143 or 4: 20,0825 to 9: 12,93810 to 19: 13,13120 to 49: 19,14050 or more: 42,431Mobile homes: 484Boats, RVs, vans, etc.: 176
Housing units in Bergen County with a mortgage: 140,678 (15,335 second mortgage , 466 home equity loan , 12,963 both second mortgage and home equity loan )Houses without a mortgage: 5,711
Here:
96.6% with mortgage State:
96.0% with mortgage
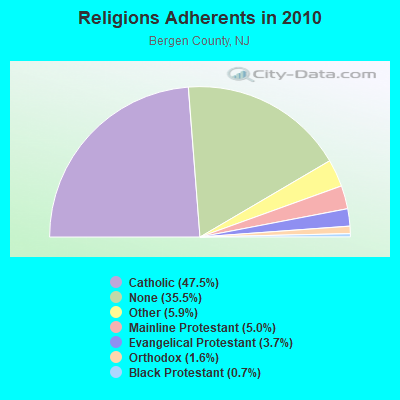
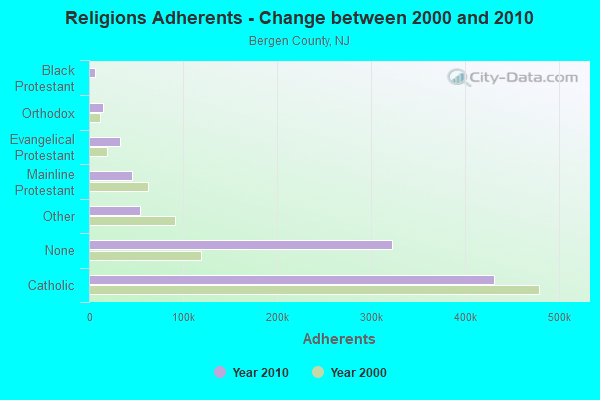
Religion statistics for Bergen County
Religion Adherents Congregations Catholic 430,007 80 Other 53,728 120 Mainline Protestant 45,613 210 Evangelical Protestant 33,419 234 Orthodox 14,373 20 Black Protestant 6,286 17 None 321,690 -
Bergen County Religion Details Source: Clifford Grammich, Kirk Hadaway, Richard Houseal, Dale E.Jones, Alexei Krindatch, Richie Stanley and Richard H.Taylor. 2012. 2010 U.S.Religion Census: Religious Congregations & Membership Study. Association of Statisticians of American Religious Bodies. Jones, Dale E., et al. 2002. Congregations and Membership in the United States 2000. Nashville, TN: Glenmary Research Center. Food Environment Statistics: Number of grocery stores : 258Bergen County :
2.90 / 10,000 pop.State :
2.90 / 10,000 pop.
Number of supercenters and club stores : 5Here :
0.06 / 10,000 pop.New Jersey :
0.06 / 10,000 pop.
Number of convenience stores (no gas) : 134This county :
1.51 / 10,000 pop.New Jersey :
1.76 / 10,000 pop.
Number of convenience stores (with gas) : 95Bergen County :
1.07 / 10,000 pop.New Jersey :
0.81 / 10,000 pop.
Number of full-service restaurants : 718This county :
8.07 / 10,000 pop.State :
7.15 / 10,000 pop.
Adult diabetes rate : Bergen County :
8.0%New Jersey :
8.3%
Adult obesity rate : Bergen County :
19.6%State :
23.3%
Low-income preschool obesity rate : Agriculture in Bergen County:
Average size of farms: 14 acresAverage value of agricultural products sold per farm: $83,123Average value of crops sold per acre for harvested cropland: $17573.17The value of nursery, greenhouse, floriculture, and sod as a percentage of the total market value of agricultural products sold: 83.14%The value of livestock, poultry, and their products as a percentage of the total market value of agricultural products sold: 3.59%Average total farm production expenses per farm: $65,276Harvested cropland as a percentage of land in farms: 32.35%Average market value of all machinery and equipment per farm: $32,405The percentage of farms operated by a family or individual: 69.23%Average age of principal farm operators: 59 yearsAverage number of cattle and calves per 100 acres of all land in farms: 3.59Vegetables: 161 harvested acres Land in orchards: 64 acres Earthquake activity:
Bergen County-area historical earthquake activity is significantly above New Jersey state average. It is 68% smaller than the overall U.S. average. On 8/23/2011 at 17:51:04, a magnitude 5.8 (5.8 MW, Depth: 3.7 mi, Class: Moderate, Intensity: VI - VII) earthquake occurred 294.2 miles away from Bergen County center On 10/7/1983 at 10:18:46, a magnitude 5.3 (5.1 MB, 5.3 LG, 5.1 ML) earthquake occurred 209.6 miles away from the county center On 4/20/2002 at 10:50:47, a magnitude 5.3 (5.3 ML, Depth: 3.0 mi) earthquake occurred 248.4 miles away from the county center On 1/16/1994 at 01:49:16, a magnitude 4.6 (4.6 MB, 4.6 LG, Depth: 3.1 mi, Class: Light, Intensity: IV - V) earthquake occurred 111.8 miles away from the county center On 4/20/2002 at 10:50:47, a magnitude 5.2 (5.2 MB, 4.2 MS, 5.2 MW, 5.0 MW) earthquake occurred 246.6 miles away from Bergen County center On 1/16/1994 at 00:42:43, a magnitude 4.2 (4.2 MB, 4.0 LG, Depth: 3.1 mi) earthquake occurred 110.4 miles away from the county center Magnitude types: regional Lg-wave magnitude (LG), body-wave magnitude (MB), local magnitude (ML), surface-wave magnitude (MS), moment magnitude (MW) Most recent natural disasters: New Jersey Tropical Storm Isaias, Incident Period: August 4, 2020, Major Disaster (Presidential) Declared DR-4574-NJ: December 11, 2020, FEMA Id: 4574, Natural disaster type: Tropical Storm
New Jersey Covid-19 Pandemic, Incident Period: January 20, 2020, Major Disaster (Presidential) Declared DR-4488-NJ: March 25, 2020, FEMA Id: 4488, Natural disaster type: Other
New Jersey Severe Winter Storm And Snowstorm, Incident Period: March 6, 2018 - March 7, 2018, FEMA Id: 4368, Natural disaster type: Snowstorm, Winter Storm
New Jersey Severe Winter Storm and Snowstorm, Incident Period: January 22, 2016 to January 24, 2016, Major Disaster (Presidential) Declared DR-4264: March 14, 2016, FEMA Id: 4264, Natural disaster type: Snowstorm, Winter Storm
New Jersey Hurricane Sandy, Incident Period: October 26, 2012 to November 08, 2012, Emergency Declared EM-3354: October 28, 2012, FEMA Id: 3354, Natural disaster type: Hurricane
New Jersey Hurricane Sandy, Incident Period: October 26, 2012 to November 08, 2012, Major Disaster (Presidential) Declared DR-4086: October 30, 2012, FEMA Id: 4086, Natural disaster type: Hurricane
New Jersey Severe Storm, Incident Period: October 29, 2011, Major Disaster (Presidential) Declared DR-4048: November 30, 2011, FEMA Id: 4048, Natural disaster type: Storm
New Jersey Hurricane Irene, Incident Period: August 27, 2011 to September 05, 2011, Major Disaster (Presidential) Declared DR-4021: August 31, 2011, FEMA Id: 4021, Natural disaster type: Hurricane
New Jersey Hurricane Irene, Incident Period: August 26, 2011 to September 05, 2011, Emergency Declared EM-3332: August 27, 2011, FEMA Id: 3332, Natural disaster type: Hurricane
New Jersey Severe Winter Storm and Snowstorm, Incident Period: December 26, 2010 to December 27, 2010, Major Disaster (Presidential) Declared DR-1954: February 04, 2011, FEMA Id: 1954, Natural disaster type: Snowstorm, Winter Storm
22 other natural disasters have been reported since 1953. The number of natural disasters in Bergen County (32) is a lot greater than the US average (19).Major Disasters (Presidential) Declared: 18Emergencies Declared: 10Hurricanes: 9, Floods: 7, Storms: 6, Heavy Rains: 4, Snowstorms: 4, Winter Storms: 3, Blizzards: 2, Water Shortages: 2, Power Outage: 1, Tornado: 1, Tropical Storm: 1, Wind: 1, Other: 4 (Note: some incidents may be assigned to more than one category).
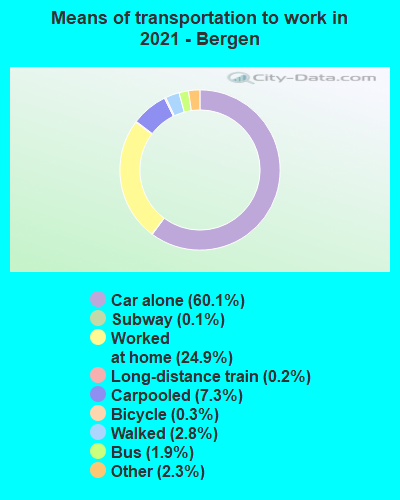
Means of transportation to work:
Drove a car alone : 302,777 (68.5%)Carpooled : 38,663 (8.7%)Bus : 11,575 (2.6%)Subway or elevated rail : 1,688 (0.4%)Long-distance train or commuter rail : 1,013 (0.2%)Taxicab, motorcycle, or other means : 9,399 (2.1%)Bicycle : 1,475 (0.3%)Walked : 12,053 (2.7%)Worked at home : 63,654 (14.4%)
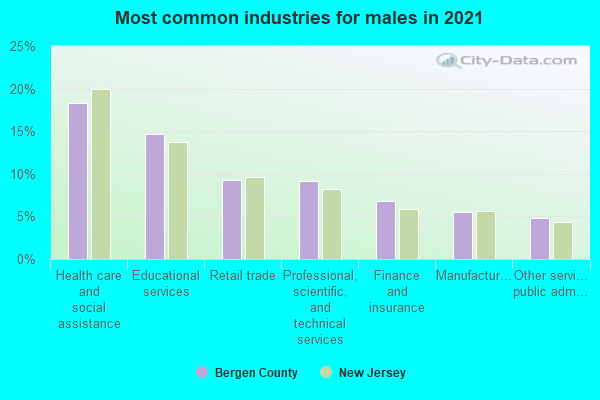
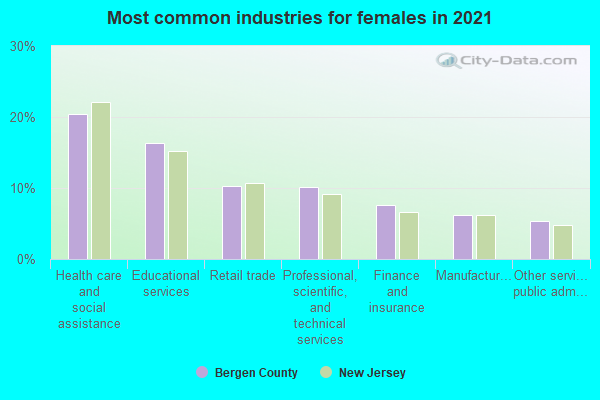
Most common industries in 2023 (%)
Males Females
Health care and social assistance (19%)Educational services (13%)Professional, scientific, and technical services (9%)Retail trade (8%)Finance and insurance (6%)Accommodation and food services (6%)Manufacturing (5%)
Health care and social assistance (22%)Educational services (15%)Professional, scientific, and technical services (10%)Retail trade (10%)Finance and insurance (7%)Accommodation and food services (6%)Manufacturing (6%)
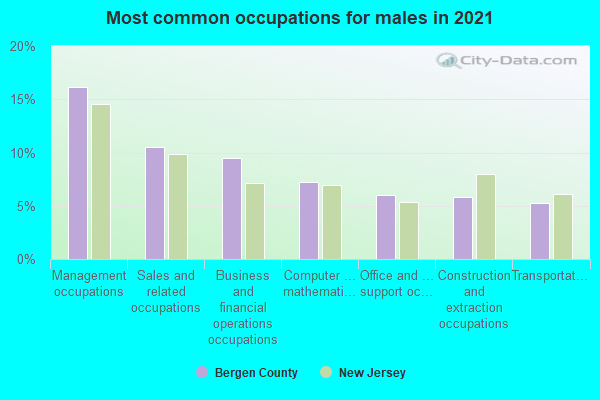
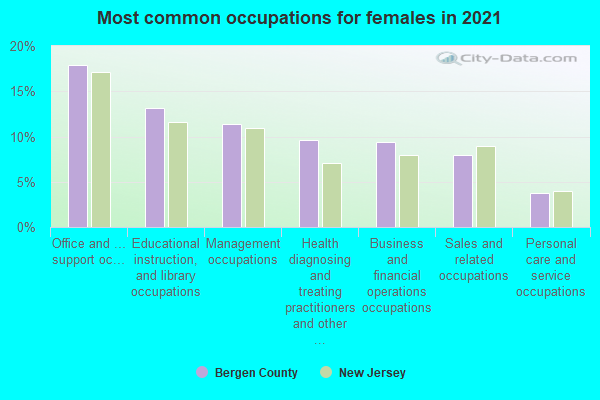
Most common occupations in 2023 (%)
Males Females
Management occupations (16%)Sales and related occupations (11%)Business and financial operations occupations (9%)Computer and mathematical occupations (8%)Construction and extraction occupations (6%)Office and administrative support occupations (5%)Transportation occupations (5%)
Office and administrative support occupations (15%)Management occupations (13%)Educational instruction, and library occupations (11%)Sales and related occupations (10%)Health diagnosing and treating practitioners and other technical occupations (9%)Business and financial operations occupations (8%)Personal care and service occupations (5%)
Korea (13%)Dominican Republic (8%)India (7%)Philippines (6%)Colombia (6%)Ecuador (4%)China, excluding Hong Kong and Taiwan (4%)
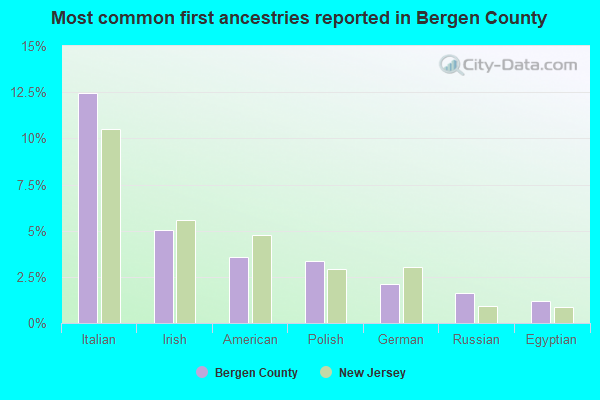
Italian (11%)Irish (5%)Polish (4%)American (3%)German (2%)Russian (1%)Jamaican (1%)
People in group quarters in Bergen County, New Jersey in 2010:
3,913 people in college/university student housing
3,546 people in nursing facilities/skilled-nursing facilities
732 people in local jails and other municipal confinement facilities
623 people in group homes intended for adults
579 people in hospitals with patients who have no usual home elsewhere
558 people in other noninstitutional facilities
193 people in emergency and transitional shelters (with sleeping facilities) for people experiencing homelessness
110 people in residential treatment centers for juveniles (non-correctional)
51 people in residential treatment centers for adults
42 people in mental (psychiatric) hospitals and psychiatric units in other hospitals
37 people in workers' group living quarters and job corps centers
29 people in group homes for juveniles (non-correctional)
9 people in correctional facilities intended for juveniles
People in group quarters in Bergen County, New Jersey in 2000:
4,654 people in nursing homes
2,277 people in college dormitories (includes college quarters off campus)
709 people in religious group quarters
665 people in other noninstitutional group quarters
660 people in local jails and other confinement facilities (including police lockups)
660 people in other group homes
454 people in hospitals/wards and hospices for chronically ill
454 people in other hospitals or wards for chronically ill
383 people in homes for the mentally retarded
281 people in homes for the mentally ill
195 people in other nonhousehold living situations
161 people in other workers' dormitories
91 people in mental (psychiatric) hospitals or wards
79 people in homes or halfway houses for drug/alcohol abuse
34 people in hospitals or wards for drug/alcohol abuse
28 people in short-term care, detention or diagnostic centers for delinquent children
18 people in homes for abused, dependent, and neglected children
Average gross adjusted income of non-migrant taxpayers in this county in 2020 was $135,964.
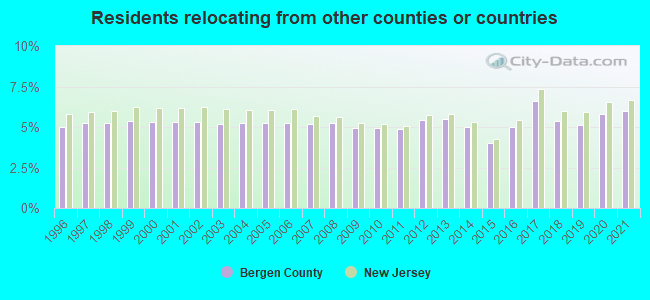
6.00% of this county's 2021 resident taxpayers lived in other counties in 2020 ( $117,506 average adjusted gross income)
Here:
6.00%New Jersey average:
6.70%
0.01% of residents moved from foreign countries ($60 average AGI)Bergen County:
0.01%New Jersey average:
0.01%
relocated from other counties in New Jersey ($43,501 average AGI)relocated from other states ($73,946 average AGI)Bergen County:
3.26%New Jersey average:
2.98%
Top counties from which taxpayers relocated into this county between 2020 and 2021: from Hudson County, NJ from Passaic County, NJ from New York County, NY from Queens County, NY from Essex County, NJ from Bronx County, NY from Kings County, NY
6.43% of this county's 2020 resident taxpayers moved to other counties in 2021 ( $129,044 average adjusted gross income)
Here:
6.43%New Jersey average:
7.02%
0.01% of residents moved to foreign countries ($163 average AGI)Bergen County:
0.01%New Jersey average:
0.02%
relocated to other counties in New Jersey ($47,786 average AGI)relocated to other states ($81,094 average AGI)Bergen County:
3.36%New Jersey average:
3.32%
Top counties to which taxpayers relocated from this county between 2020 and 2021: to Passaic County, NJ to Hudson County, NJ to Essex County, NJ to Morris County, NJ to New York County, NY to Ocean County, NJ to Middlesex County, NJ
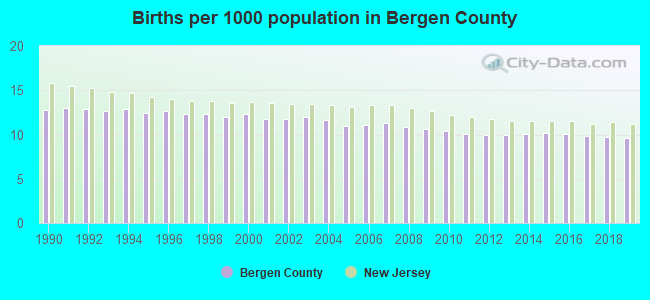
Births per 1000 population from 1990 to 1999: 12.6Births per 1000 population from 2000 to 2009: 11.4Births per 1000 population from 2010 to 2022: 8.4
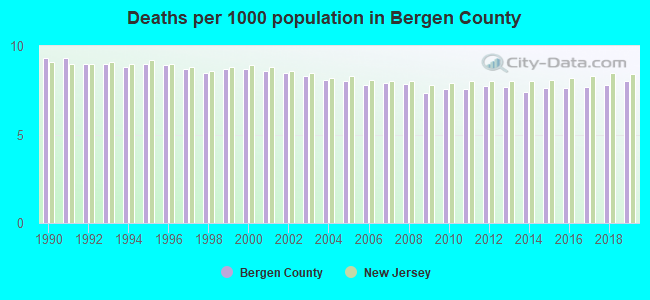
Deaths per 1000 population from 1990 to 1999: 8.9Deaths per 1000 population from 2000 to 2009: 8.1Deaths per 1000 population from 2010 to 2020: 7.9
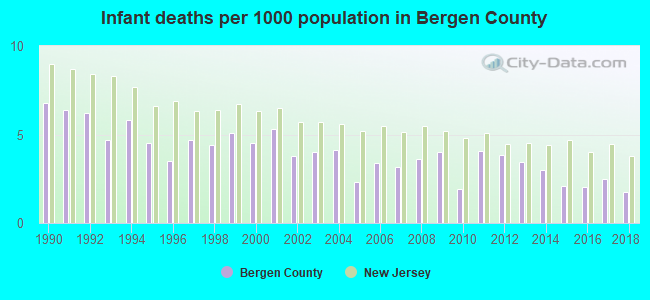
Infant deaths per 1000 live births from 1990 to 1999: 5.2Infant deaths per 1000 live births from 2000 to 2009: 3.8Infant deaths per 1000 live births from 2010 to 2021: 2.8
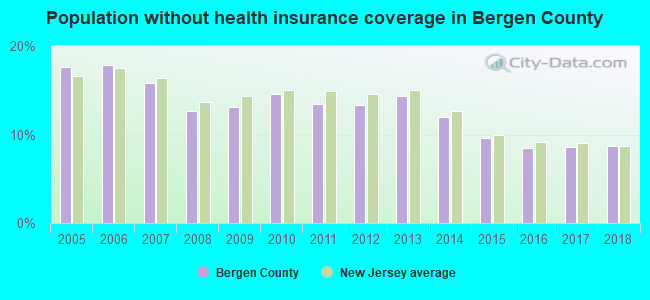
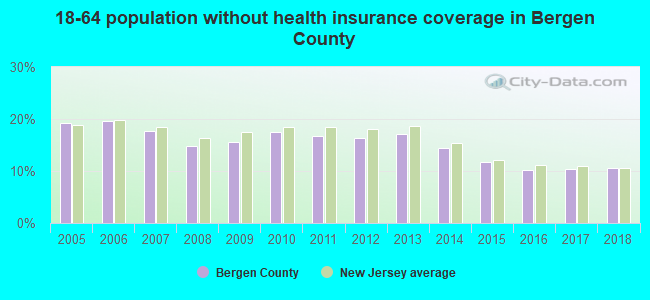
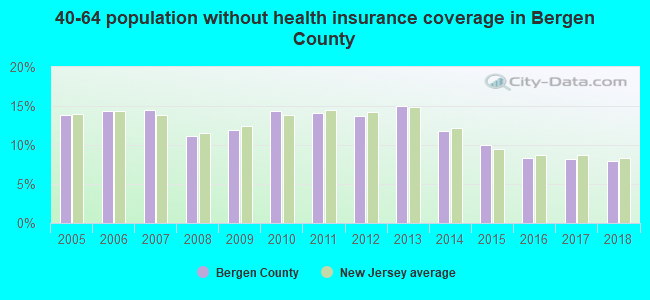
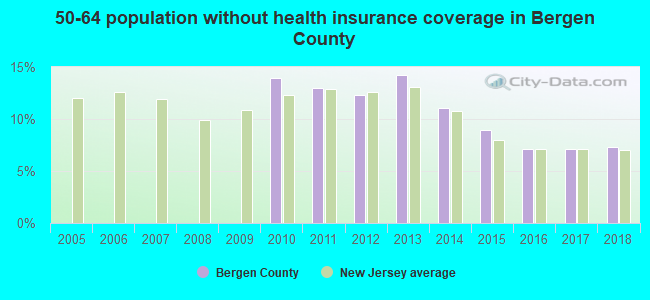
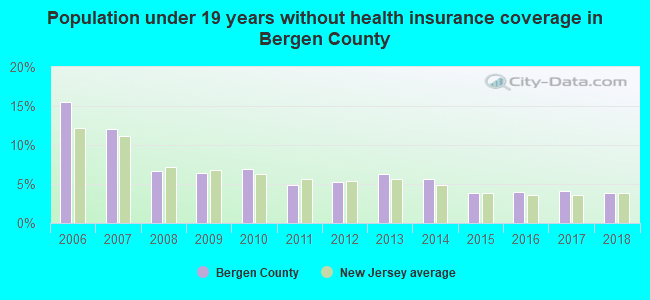
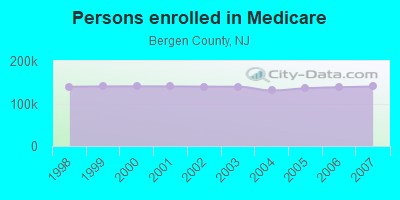
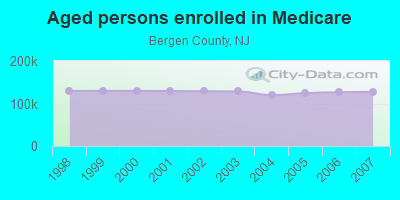
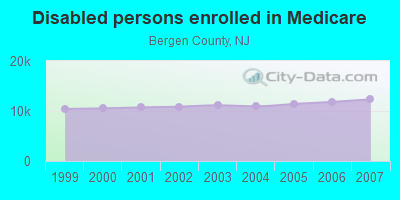
Population without health insurance coverage in 2018: 8.7%Persons under 19 years old without health insurance coverage in 2018: 3.8%Persons enrolled in hospital insurance and/or supplemental medical insurance (Medicare) in July 1, 2007: 140,016 (127,679 aged , 12,337 disabled )Children under 18 without health insurance coverage in 2007: 20,897 (10%)Most common underlying causes of death in Bergen County, New Jersey in 1999 - 2019:
Atherosclerotic heart disease (15,288)
Bronchus or lung, unspecified - Malignant neoplasms (8,625)
Acute myocardial infarction, unspecified (8,622)
Unspecified dementia (5,187)
Alzheimer disease, unspecified (4,226)
Chronic obstructive pulmonary disease, unspecified (4,140)
Stroke, not specified as haemorrhage or infarction (4,130)
Congestive heart failure (3,534)
Septicaemia, unspecified (3,174)
Breast, unspecified - Malignant neoplasms (3,118)
Population without health insurance coverage in 2000: 10%Children under 18 without health insurance coverage in 2000: 7%
Short term general hospitals per 100,000 population in 2004: 0.55Short term general hospital admissions per 100,000 population in 2004: 15,424Short term general hospital beds per 100,000 population in 2004: 208Emergency room visits per 100,000 population in 2004: 23,949General practice office based MDs per 100,000 population in 2005: 1,072Medical specialist MDs per 100,000 population in 2005: 794Dentists per 100,000 population in 1998: 19Total births per 100,000 population, July 2005 - July 2006 : 107Total deaths per 100,000 population, July 2005 - July 2006: 109Limited-service eating places per 100,000 population in 2005 : 22Beer, wine & liquor stores per 100,000 population in 2005: 1Fitness & recreation sports centers per 100,000 population in 2005: 2,704EPA green book nonattainment status in 2004-2006: 1
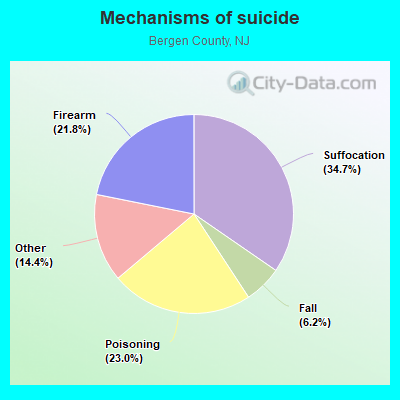
Suicides per 1,000,000 population from 2000 to 2006: 65.0. This is less than state average.
Deaths per 1,000,000 population:
Suffocation - 22.5
Poisoning - 15.0
Firearm - 14.2
Fall - 4.0
Other - 9.3
Household type by relationship:
Households: 957,736
Male householders: 182,867 (34,403 living alone ), Female householders: 173,571 (54,711 living alone )194,421 spouses (192,041 opposite-sex spouses ), 20,529 unmarried partners , (20,048 opposite-sex unmarried partners ), 296,976 children (285,907 natural , 3,254 adopted , 7,815 stepchildren ), 9,573 grandchildren , 10,338 brothers or sisters , 25,439 parents , 0 foster children , 15,303 other relatives , 17,648 non-relatives In group quarters: 11,071
Size of family households: 95,827 2-persons , 61,740 3-persons , 60,748 4-persons , 23,853 5-persons , 6,631 6-persons , 2,671 7-or-more-persons .
Size of nonfamily households: 89,114 1-person , 13,709 2-persons , 1,217 3-persons , 696 4-persons , 232 6-persons .
145,898 married couples with children. single-parent households (10,564 men , 26,833 women ).
56.3% of residents of Bergen speak English at home. of residents speak Spanish at home (63% speak English very well , 19% speak English well , 14% speak English not well , 5% don't speak English at all ).of residents speak other Indo-European language at home (67% speak English very well , 24% speak English well , 8% speak English not well , 1% don't speak English at all ).of residents speak Asian or Pacific Island language at home (54% speak English very well , 27% speak English well , 15% speak English not well , 3% don't speak English at all ).of residents speak other language at home (81% speak English very well , 12% speak English well , 7% speak English not well , 1% don't speak English at all ).
In fiscal year 2004:
Federal Government expenditure: $4,561,601,000 ($5,052 per capita )Department of Defense expenditure: $487,297,000Federal direct payments to individuals for retirement and disability: $2,080,583,000Federal other direct payments to individuals: $1,137,311,000Federal direct payments not to individuals: $4,482,000Federal grants: $508,447,000Federal procurement contracts: $591,832,000 ($449,508,000 Department of Defense )Federal salaries and wages: $238,945,000 ($14,222,000 Department of Defense )Federal Government direct loans: $29,261,000Federal guaranteed/insured loans: $310,951,000Federal Government insurance: $1,574,097,000
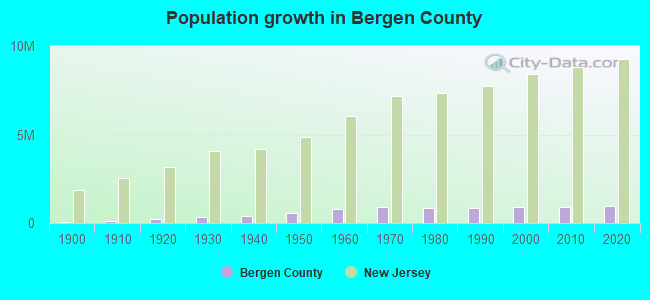
Population change from April 1, 2000 to July 1, 2005:
Births: 54,077Here:
60 per 1000 residentsState:
69 per 1000 residents
Deaths: 38,625Here:
43 per 1000 residentsState:
44 per 1000 residents
Net international migration: +39,105Here:
+43 per 1000 residentsState:
+33 per 1000 residents
Net internal migration: -34,423
Here : State :
Total withdrawal of fresh water for public supply: 112.29 millions of gallons per day (22% from ground, 78% from surface )
Median number of rooms in houses and condos:
Median number of rooms in apartments:
Year house built in Bergen County, New Jersey
6,821 2020 or later21,625 2010 to 201924,017 2000 to 200918,102 1990 to 199929,610 1980 to 198934,912 1970 to 197951,652 1960 to 196972,946 1950 to 195936,120 1940 to 194974,659 1939 or earlier
Rooms in houses/apartments in Bergen County, New Jersey
Owner-occupied Renter-occupied
Rooms in owner-occupied houses in Bergen County, New Jersey
1,532 1 room 1,553 2 rooms 9,945 3 rooms 22,112 4 rooms 32,259 5 rooms 37,957 6 rooms 37,234 7 rooms 35,195 8 rooms 53,276 9+ rooms
Rooms in renter-occupied apartments in Bergen County, New Jersey
8,690 1 room 11,812 2 rooms 33,423 3 rooms 31,021 4 rooms 20,457 5 rooms 11,265 6 rooms 3,679 7 rooms 2,913 8 rooms 2,115 9+ rooms
Bedrooms in houses/apartments in Bergen County, New Jersey
Owner-occupied Renter-occupied
Bedrooms in owner-occupied houses in Bergen County, New Jersey
1,842 no bedroom 11,365 1 bedroom 36,563 2 bedrooms 89,819 3 bedrooms 67,431 4 bedrooms 24,043 5+ bedrooms
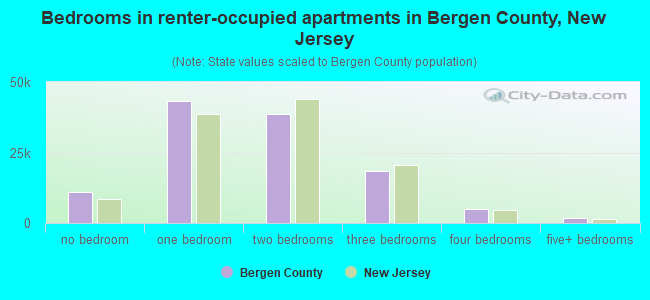
Bedrooms in renter-occupied apartments in Bergen County, New Jersey
9,812 no bedroom 44,434 1 bedroom 45,521 2 bedrooms 20,476 3 bedrooms 4,205 4 bedrooms 927 5+ bedrooms
Cars and other vehicles available in Bergen County, New Jersey in houses/condos/apartments
Owner-occupied Renter-occupied
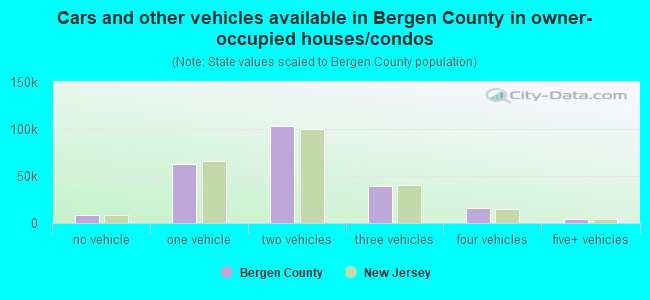
Cars and other vehicles available in Bergen County in owner-occupied houses/condos
7,823 no vehicle 65,535 1 vehicle 98,058 2 vehicles 42,724 3 vehicles 13,481 4 vehicles 3,442 5+ vehicles
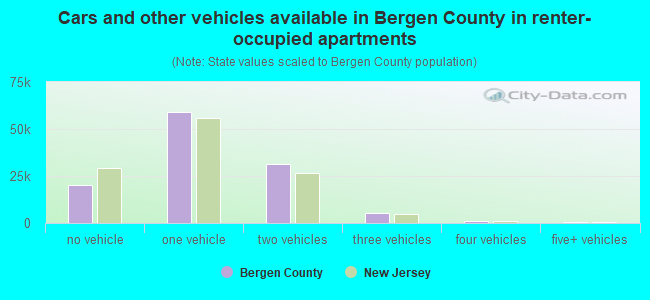
Cars and other vehicles available in Bergen County in renter-occupied apartments
19,688 no vehicle 65,045 1 vehicle 33,135 2 vehicles 5,754 3 vehicles 1,069 4 vehicles 684 5+ vehicles
91.0% of Bergen County residents lived in the same house 1 years ago.
Out of people who lived in different houses, 34% lived in this county.
Out of people who lived in different counties, 46% lived in New Jersey.
Bergen County:
91.0%State average:
90.6%
Place of birth for U.S.-born residents:
This state: 397,224Other state: 238,742Northeast: 201,122Midwest: 10,775South: 18,848West: 7,997 Private vs. public school enrollment:
Students in private schools in grades 1 to 8 (elementary and middle school): 9,353
Here:
10.4%New Jersey:
12.4%
Students in private schools in grades 9 to 12 (high school): 5,863
Here:
11.8%New Jersey:
12.5%
Students in private undergraduate colleges: 15,007
Here:
34.0%New Jersey:
33.5%
Bergen County government finances - Expenditure in 2022:
Assistance and Subsidies - State Scholarships and Other Subsidies - Education: $-10,913,000
Charges - Hospital Public: $298,349,000
Sewerage: $78,363,000 Elementary and Secondary Education - Other: $49,490,000 Higher Education - Other: $48,494,000 Other: $18,317,000 Parks and Recreation: $10,564,000 Solid Waste Management: $9,930,000 Housing and Community Development: $3,838,000 Elementary and Secondary Education School Tuition and Transportation: $1,349,000 Higher Education Auxiliary Enterprises: $143,000 Elementary and Secondary Education School Lunch: $26,000 Parking Facilities: $6,000Construction - Elementary and Secondary Education: $14,064,000
Sewerage: $13,369,000 Other Higher Education: $3,214,000Current Operations - General - Other: $303,061,000
Hospitals: $275,800,000 Elementary and Secondary Education: $251,159,000 Other Higher Education: $110,317,000 Housing and Community Development: $55,509,000 Sewerage: $48,261,000 Correctional Institutions: $47,872,000 Judicial and Legal Services: $39,468,000 Police Protection: $37,005,000 Public Welfare - Other: $19,799,000 Regular Highways: $19,646,000 General Public Buildings: $19,150,000 Health - Other: $16,225,000 Parks and Recreation: $14,251,000 Solid Waste Management: $11,414,000 Financial Administration: $3,037,000 Central Staff Services: $2,146,000 Protective Inspection and Regulation - Other: $953,000 Higher Education Auxiliary Enterprises: $276,000Federal Intergovernmental - Other: $100,917,000
General - Interest on Debt: $38,067,000
Intergovernmental to Local - Other - General - Other: $291,000
Intergovernmental to State - General - Other: $48,000
Local Intergovernmental - Other: $163,014,000
Long Term Debt - Beginning Outstanding - Unspecified Public Purpose: $1,688,563,000
Outstanding Unspecified Public Purpose: $1,575,166,000 Retired Unspecified Public Purpose: $290,926,000 Issue, Unspecified Public Purpose: $177,530,000Miscellaneous - General Revenue - Other: $32,799,000
Interest Earnings: $1,697,000Short Term Debt Outstanding - End of Fiscal Year: $127,629,000
Beginning: $105,818,000State Intergovernmental - Other: $187,204,000
Tax - Property: $449,233,000
Documentary and Stock Transfer: $14,405,000Total Salaries and Wages: $192,993,000
Bergen County government finances - Revenue in 2022:
Assistance and Subsidies - State Scholarships and Other Subsidies - Education: $-10,913,000
Charges - Hospital Public: $298,349,000
Sewerage: $78,363,000 Elementary and Secondary Education - Other: $49,490,000 Higher Education - Other: $48,494,000 Other: $18,317,000 Parks and Recreation: $10,564,000 Solid Waste Management: $9,930,000 Housing and Community Development: $3,838,000 Elementary and Secondary Education School Tuition and Transportation: $1,349,000 Higher Education Auxiliary Enterprises: $143,000 Elementary and Secondary Education School Lunch: $26,000 Parking Facilities: $6,000Construction - Elementary and Secondary Education: $14,064,000
Sewerage: $13,369,000 Other Higher Education: $3,214,000Current Operations - General - Other: $303,061,000
Hospitals: $275,800,000 Elementary and Secondary Education: $251,159,000 Other Higher Education: $110,317,000 Housing and Community Development: $55,509,000 Sewerage: $48,261,000 Correctional Institutions: $47,872,000 Judicial and Legal Services: $39,468,000 Police Protection: $37,005,000 Public Welfare - Other: $19,799,000 Regular Highways: $19,646,000 General Public Buildings: $19,150,000 Health - Other: $16,225,000 Parks and Recreation: $14,251,000 Solid Waste Management: $11,414,000 Financial Administration: $3,037,000 Central Staff Services: $2,146,000 Protective Inspection and Regulation - Other: $953,000 Higher Education Auxiliary Enterprises: $276,000Federal Intergovernmental - Other: $100,917,000
General - Interest on Debt: $38,067,000
Intergovernmental to Local - Other - General - Other: $291,000
Intergovernmental to State - General - Other: $48,000
Local Intergovernmental - Other: $163,014,000
Long Term Debt - Beginning Outstanding - Unspecified Public Purpose: $1,688,563,000
Outstanding Unspecified Public Purpose: $1,575,166,000 Retired Unspecified Public Purpose: $290,926,000 Issue, Unspecified Public Purpose: $177,530,000Miscellaneous - General Revenue - Other: $32,799,000
Interest Earnings: $1,697,000Short Term Debt Outstanding - End of Fiscal Year: $127,629,000
Beginning: $105,818,000State Intergovernmental - Other: $187,204,000
Tax - Property: $449,233,000
Documentary and Stock Transfer: $14,405,000Total Salaries and Wages: $192,993,000
Bergen County government finances - Debt in 2022:
Assistance and Subsidies - State Scholarships and Other Subsidies - Education: $-10,913,000
Charges - Hospital Public: $298,349,000
Sewerage: $78,363,000 Elementary and Secondary Education - Other: $49,490,000 Higher Education - Other: $48,494,000 Other: $18,317,000 Parks and Recreation: $10,564,000 Solid Waste Management: $9,930,000 Housing and Community Development: $3,838,000 Elementary and Secondary Education School Tuition and Transportation: $1,349,000 Higher Education Auxiliary Enterprises: $143,000 Elementary and Secondary Education School Lunch: $26,000 Parking Facilities: $6,000Construction - Elementary and Secondary Education: $14,064,000
Sewerage: $13,369,000 Other Higher Education: $3,214,000Current Operations - General - Other: $303,061,000
Hospitals: $275,800,000 Elementary and Secondary Education: $251,159,000 Other Higher Education: $110,317,000 Housing and Community Development: $55,509,000 Sewerage: $48,261,000 Correctional Institutions: $47,872,000 Judicial and Legal Services: $39,468,000 Police Protection: $37,005,000 Public Welfare - Other: $19,799,000 Regular Highways: $19,646,000 General Public Buildings: $19,150,000 Health - Other: $16,225,000 Parks and Recreation: $14,251,000 Solid Waste Management: $11,414,000 Financial Administration: $3,037,000 Central Staff Services: $2,146,000 Protective Inspection and Regulation - Other: $953,000 Higher Education Auxiliary Enterprises: $276,000Federal Intergovernmental - Other: $100,917,000
General - Interest on Debt: $38,067,000
Intergovernmental to Local - Other - General - Other: $291,000
Intergovernmental to State - General - Other: $48,000
Local Intergovernmental - Other: $163,014,000
Long Term Debt - Beginning Outstanding - Unspecified Public Purpose: $1,688,563,000
Outstanding Unspecified Public Purpose: $1,575,166,000 Retired Unspecified Public Purpose: $290,926,000 Issue, Unspecified Public Purpose: $177,530,000Miscellaneous - General Revenue - Other: $32,799,000
Interest Earnings: $1,697,000Short Term Debt Outstanding - End of Fiscal Year: $127,629,000
Beginning: $105,818,000State Intergovernmental - Other: $187,204,000
Tax - Property: $449,233,000
Documentary and Stock Transfer: $14,405,000Total Salaries and Wages: $192,993,000
Bergen County government finances - Cash and Securities in 2022:
Assistance and Subsidies - State Scholarships and Other Subsidies - Education: $-10,913,000
Charges - Hospital Public: $298,349,000
Sewerage: $78,363,000 Elementary and Secondary Education - Other: $49,490,000 Higher Education - Other: $48,494,000 Other: $18,317,000 Parks and Recreation: $10,564,000 Solid Waste Management: $9,930,000 Housing and Community Development: $3,838,000 Elementary and Secondary Education School Tuition and Transportation: $1,349,000 Higher Education Auxiliary Enterprises: $143,000 Elementary and Secondary Education School Lunch: $26,000 Parking Facilities: $6,000Construction - Elementary and Secondary Education: $14,064,000
Sewerage: $13,369,000 Other Higher Education: $3,214,000Current Operations - General - Other: $303,061,000
Hospitals: $275,800,000 Elementary and Secondary Education: $251,159,000 Other Higher Education: $110,317,000 Housing and Community Development: $55,509,000 Sewerage: $48,261,000 Correctional Institutions: $47,872,000 Judicial and Legal Services: $39,468,000 Police Protection: $37,005,000 Public Welfare - Other: $19,799,000 Regular Highways: $19,646,000 General Public Buildings: $19,150,000 Health - Other: $16,225,000 Parks and Recreation: $14,251,000 Solid Waste Management: $11,414,000 Financial Administration: $3,037,000 Central Staff Services: $2,146,000 Protective Inspection and Regulation - Other: $953,000 Higher Education Auxiliary Enterprises: $276,000Federal Intergovernmental - Other: $100,917,000
General - Interest on Debt: $38,067,000
Intergovernmental to Local - Other - General - Other: $291,000
Intergovernmental to State - General - Other: $48,000
Local Intergovernmental - Other: $163,014,000
Long Term Debt - Beginning Outstanding - Unspecified Public Purpose: $1,688,563,000
Outstanding Unspecified Public Purpose: $1,575,166,000 Retired Unspecified Public Purpose: $290,926,000 Issue, Unspecified Public Purpose: $177,530,000Miscellaneous - General Revenue - Other: $32,799,000
Interest Earnings: $1,697,000Short Term Debt Outstanding - End of Fiscal Year: $127,629,000
Beginning: $105,818,000State Intergovernmental - Other: $187,204,000
Tax - Property: $449,233,000
Documentary and Stock Transfer: $14,405,000Total Salaries and Wages: $192,993,000
Supplemental Security Income (SSI) in 2006:
Total number of recipients: 10,317Number of aged recipients: 4,496Number of blind and disabled recipients: 5,821Number of recipients under 18: 678Number of recipients between 18 and 64: 3,964Number of recipients older than 64: 5,675Number of recipients also receiving OASDI: 3,040Amount of payments (thousands of dollars): 4,662
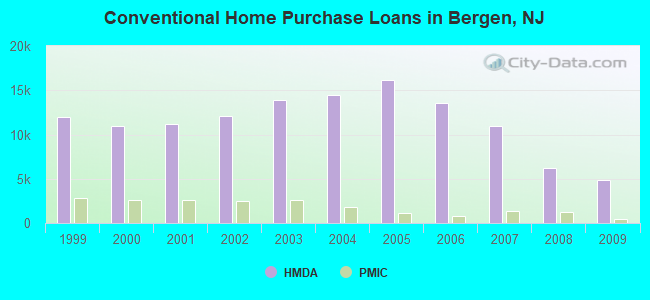
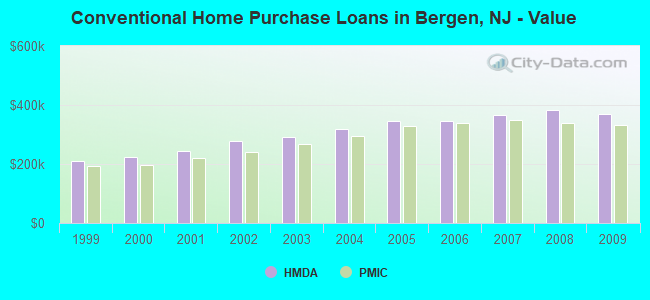
Home Mortgage Disclosure Act Aggregated Statistics For Year 2009(Based on 163 full tracts) A) FHA, FSA/RHS & VA B) Conventional C) Refinancings D) Home Improvement Loans E) Loans on Dwellings For 5+ Families F) Non-occupant Loans on G) Loans On Manufactured Number Average Value Number Average Value Number Average Value Number Average Value Number Average Value Number Average Value Number Average Value
LOANS ORIGINATED 1,534 $334,807 4,856 $367,814 19,782 $330,079 1,128 $185,584 53 $3,236,981 584 $304,810 7 $87,000 APPLICATIONS APPROVED, NOT ACCEPTED 134 $346,015 580 $384,898 1,718 $332,762 161 $122,627 4 $1,545,000 78 $338,205 1 $102,000 APPLICATIONS DENIED 357 $337,759 906 $363,405 7,404 $353,788 733 $121,420 7 $5,164,286 433 $251,224 6 $162,667 APPLICATIONS WITHDRAWN 280 $326,732 665 $368,164 4,220 $341,656 193 $202,337 7 $607,000 158 $295,266 2 $259,500 FILES CLOSED FOR INCOMPLETENESS 100 $324,860 218 $326,601 1,329 $354,747 90 $148,089 3 $10,258,333 56 $272,196 1 $30,000
Aggregated Statistics For Year 2008(Based on 163 full tracts) A) FHA, FSA/RHS & VA B) Conventional C) Refinancings D) Home Improvement Loans E) Loans on Dwellings For 5+ Families F) Non-occupant Loans on G) Loans On Manufactured Number Average Value Number Average Value Number Average Value Number Average Value Number Average Value Number Average Value Number Average Value
LOANS ORIGINATED 650 $351,094 6,211 $381,901 9,434 $332,291 1,755 $135,269 119 $2,473,471 772 $318,162 8 $115,125 APPLICATIONS APPROVED, NOT ACCEPTED 65 $336,138 1,122 $378,120 2,229 $318,369 453 $126,715 7 $2,753,571 152 $297,678 3 $156,667 APPLICATIONS DENIED 210 $346,486 1,414 $409,206 5,756 $365,939 1,381 $107,986 24 $387,000 479 $308,777 10 $196,000 APPLICATIONS WITHDRAWN 129 $348,512 1,060 $388,186 2,511 $351,442 230 $173,400 16 $1,262,000 157 $338,331 1 $105,000 FILES CLOSED FOR INCOMPLETENESS 44 $356,227 267 $368,948 686 $380,144 101 $140,376 2 $2,010,000 61 $304,869 2 $85,000
Aggregated Statistics For Year 2007(Based on 163 full tracts) A) FHA, FSA/RHS & VA B) Conventional C) Refinancings D) Home Improvement Loans E) Loans on Dwellings For 5+ Families F) Non-occupant Loans on G) Loans On Manufactured Number Average Value Number Average Value Number Average Value Number Average Value Number Average Value Number Average Value Number Average Value
LOANS ORIGINATED 111 $359,189 10,926 $367,273 13,541 $334,828 3,034 $121,667 128 $1,746,953 1,294 $353,790 14 $85,500 APPLICATIONS APPROVED, NOT ACCEPTED 17 $339,294 1,908 $375,959 3,142 $315,867 735 $107,208 3 $856,667 255 $356,412 3 $65,333 APPLICATIONS DENIED 45 $332,022 2,574 $392,521 8,120 $367,388 1,877 $118,174 21 $1,436,476 660 $325,168 20 $76,100 APPLICATIONS WITHDRAWN 38 $346,711 1,567 $387,763 3,545 $354,656 379 $167,958 12 $613,083 251 $357,598 5 $316,800 FILES CLOSED FOR INCOMPLETENESS 3 $226,667 380 $398,405 1,353 $383,194 86 $200,233 1 $201,000 73 $372,466 0 $0
Aggregated Statistics For Year 2006(Based on 163 full tracts) A) FHA, FSA/RHS & VA B) Conventional C) Refinancings D) Home Improvement Loans E) Loans on Dwellings For 5+ Families F) Non-occupant Loans on G) Loans On Manufactured Number Average Value Number Average Value Number Average Value Number Average Value Number Average Value Number Average Value Number Average Value
LOANS ORIGINATED 76 $341,868 13,615 $344,661 17,533 $314,211 3,863 $124,024 89 $1,573,315 1,636 $325,447 12 $179,750 APPLICATIONS APPROVED, NOT ACCEPTED 11 $344,636 1,970 $345,827 3,405 $290,318 824 $115,347 2 $23,999,000 281 $318,377 4 $43,000 APPLICATIONS DENIED 21 $361,238 3,200 $368,545 7,315 $334,501 2,096 $122,030 25 $385,320 594 $309,603 32 $173,156 APPLICATIONS WITHDRAWN 14 $309,929 2,065 $373,908 5,401 $329,685 467 $181,638 18 $1,180,722 332 $361,777 12 $270,500 FILES CLOSED FOR INCOMPLETENESS 1 $352,000 491 $338,043 1,544 $352,526 140 $135,879 1 $800,000 71 $319,394 10 $171,800
Aggregated Statistics For Year 2005(Based on 163 full tracts) A) FHA, FSA/RHS & VA B) Conventional C) Refinancings D) Home Improvement Loans E) Loans on Dwellings For 5+ Families F) Non-occupant Loans on G) Loans On Manufactured Number Average Value Number Average Value Number Average Value Number Average Value Number Average Value Number Average Value Number Average Value
LOANS ORIGINATED 101 $297,723 16,133 $346,888 19,990 $307,002 3,963 $124,313 86 $2,824,326 2,043 $307,119 20 $116,600 APPLICATIONS APPROVED, NOT ACCEPTED 6 $302,333 1,961 $363,504 3,372 $283,515 674 $110,684 1 $3,713,000 268 $295,731 13 $67,154 APPLICATIONS DENIED 19 $324,421 3,157 $346,353 7,191 $313,548 1,944 $105,494 21 $509,667 582 $294,107 39 $119,282 APPLICATIONS WITHDRAWN 35 $315,286 2,711 $355,235 6,826 $302,144 780 $233,449 28 $564,036 458 $314,428 11 $165,091 FILES CLOSED FOR INCOMPLETENESS 2 $194,000 615 $327,351 2,349 $330,243 131 $117,641 3 $368,000 82 $308,159 2 $119,000
Aggregated Statistics For Year 2004(Based on 163 full tracts) A) FHA, FSA/RHS & VA B) Conventional C) Refinancings D) Home Improvement Loans E) Loans on Dwellings For 5+ Families F) Non-occupant Loans on G) Loans On Manufactured Number Average Value Number Average Value Number Average Value Number Average Value Number Average Value Number Average Value Number Average Value
LOANS ORIGINATED 226 $264,080 14,413 $319,739 20,067 $259,263 3,297 $104,348 120 $808,692 1,677 $259,249 38 $79,079 APPLICATIONS APPROVED, NOT ACCEPTED 22 $243,045 1,968 $322,958 3,202 $241,355 805 $87,004 5 $6,523,800 266 $244,996 12 $37,750 APPLICATIONS DENIED 43 $254,837 2,321 $333,141 6,413 $271,647 1,887 $89,531 17 $683,647 588 $229,658 31 $57,581 APPLICATIONS WITHDRAWN 38 $272,316 2,014 $335,577 4,788 $256,718 597 $125,266 24 $1,083,250 323 $275,926 7 $110,429 FILES CLOSED FOR INCOMPLETENESS 7 $246,714 457 $318,370 1,426 $284,428 156 $92,237 5 $418,200 72 $220,875 0 $0
Aggregated Statistics For Year 2003(Based on 163 full tracts) A) FHA, FSA/RHS & VA B) Conventional C) Refinancings D) Home Improvement Loans E) Loans on Dwellings For 5+ Families F) Non-occupant Loans on Number Average Value Number Average Value Number Average Value Number Average Value Number Average Value Number Average Value
LOANS ORIGINATED 459 $242,447 13,900 $290,220 53,014 $227,120 2,692 $74,552 123 $2,366,431 2,053 $212,244 APPLICATIONS APPROVED, NOT ACCEPTED 29 $217,966 1,597 $309,205 6,947 $216,637 847 $71,190 1 $234,000 283 $207,223 APPLICATIONS DENIED 65 $231,492 1,615 $305,254 10,742 $238,410 1,524 $67,490 8 $1,024,500 626 $198,248 APPLICATIONS WITHDRAWN 93 $221,011 1,634 $299,635 7,062 $234,263 436 $73,078 6 $597,000 320 $211,866 FILES CLOSED FOR INCOMPLETENESS 13 $247,308 418 $312,768 1,735 $258,969 174 $90,374 0 $0 83 $210,831
Aggregated Statistics For Year 2002(Based on 190 full tracts) A) FHA, FSA/RHS & VA B) Conventional C) Refinancings D) Home Improvement Loans E) Loans on Dwellings For 5+ Families F) Non-occupant Loans on Number Average Value Number Average Value Number Average Value Number Average Value Number Average Value Number Average Value
LOANS ORIGINATED 428 $217,044 12,084 $277,787 36,535 $231,209 4,244 $71,368 111 $1,842,514 1,494 $192,232 APPLICATIONS APPROVED, NOT ACCEPTED 58 $195,638 1,505 $277,500 5,370 $198,009 1,244 $58,888 1 $800,000 241 $194,473 APPLICATIONS DENIED 67 $213,672 1,280 $304,287 7,850 $191,692 2,012 $62,207 8 $2,804,125 394 $184,221 APPLICATIONS WITHDRAWN 53 $197,264 1,252 $457,942 5,424 $237,681 562 $63,077 10 $1,528,600 190 $292,247 FILES CLOSED FOR INCOMPLETENESS 20 $195,200 393 $277,427 2,172 $215,468 171 $80,251 1 $800,000 70 $184,900
Aggregated Statistics For Year 2001(Based on 188 full tracts) A) FHA, FSA/RHS & VA B) Conventional C) Refinancings D) Home Improvement Loans E) Loans on Dwellings For 5+ Families F) Non-occupant Loans on Number Average Value Number Average Value Number Average Value Number Average Value Number Average Value Number Average Value
LOANS ORIGINATED 739 $191,854 11,171 $243,041 21,375 $203,299 3,157 $56,468 68 $1,162,956 969 $176,897 APPLICATIONS APPROVED, NOT ACCEPTED 73 $182,014 1,297 $250,754 3,417 $169,463 1,042 $55,418 6 $184,500 149 $157,242 APPLICATIONS DENIED 88 $195,170 1,242 $252,688 6,420 $161,864 1,997 $49,762 8 $430,500 322 $165,081 APPLICATIONS WITHDRAWN 89 $181,730 1,029 $250,513 4,757 $172,940 843 $53,839 7 $1,177,000 171 $152,737 FILES CLOSED FOR INCOMPLETENESS 20 $209,300 305 $253,856 1,333 $179,786 146 $59,130 0 $0 38 $185,474
Aggregated Statistics For Year 2000(Based on 177 full tracts) A) FHA, FSA/RHS & VA B) Conventional C) Refinancings D) Home Improvement Loans E) Loans on Dwellings For 5+ Families F) Non-occupant Loans on Number Average Value Number Average Value Number Average Value Number Average Value Number Average Value Number Average Value
LOANS ORIGINATED 752 $175,749 11,008 $223,175 5,555 $153,036 3,192 $46,485 58 $1,164,966 648 $154,390 APPLICATIONS APPROVED, NOT ACCEPTED 79 $170,772 1,236 $233,195 1,881 $140,534 1,088 $42,994 3 $222,000 100 $126,540 APPLICATIONS DENIED 106 $178,736 1,755 $216,907 4,253 $133,063 1,887 $42,213 7 $494,286 273 $133,447 APPLICATIONS WITHDRAWN 122 $170,139 1,171 $233,485 2,810 $124,962 629 $55,353 10 $337,200 145 $146,710 FILES CLOSED FOR INCOMPLETENESS 16 $161,812 301 $239,870 742 $168,724 138 $57,232 0 $0 32 $166,625
Aggregated Statistics For Year 1999(Based on 182 full tracts) A) FHA, FSA/RHS & VA B) Conventional C) Refinancings D) Home Improvement Loans E) Loans on Dwellings For 5+ Families F) Non-occupant Loans on Number Average Value Number Average Value Number Average Value Number Average Value Number Average Value Number Average Value
LOANS ORIGINATED 1,062 $166,458 12,011 $209,909 14,020 $165,978 3,227 $43,736 107 $621,215 907 $145,197 APPLICATIONS APPROVED, NOT ACCEPTED 67 $163,433 1,232 $219,141 3,031 $145,521 815 $42,065 1 $390,000 183 $145,366 APPLICATIONS DENIED 118 $164,415 1,402 $207,856 4,694 $141,728 1,737 $41,899 19 $843,684 313 $123,859 APPLICATIONS WITHDRAWN 128 $166,422 1,056 $206,269 3,843 $137,199 506 $66,943 15 $860,467 178 $145,079 FILES CLOSED FOR INCOMPLETENESS 23 $147,000 313 $226,658 1,025 $173,262 109 $55,376 1 $90,000 49 $144,367
Private Mortgage Insurance Companies Aggregated Statistics For Year 2009(Based on 156 full tracts) A) Conventional B) Refinancings C) Non-occupant Loans on Number Average Value Number Average Value Number Average Value
LOANS ORIGINATED 493 $333,144 196 $353,745 0 $0 APPLICATIONS APPROVED, NOT ACCEPTED 203 $351,232 127 $361,362 0 $0 APPLICATIONS DENIED 131 $312,962 142 $367,923 0 $0 APPLICATIONS WITHDRAWN 62 $323,323 59 $343,780 0 $0 FILES CLOSED FOR INCOMPLETENESS 21 $337,429 10 $342,900 1 $325,000
Aggregated Statistics For Year 2008(Based on 156 full tracts) A) Conventional B) Refinancings C) Non-occupant Loans on Number Average Value Number Average Value Number Average Value
LOANS ORIGINATED 1,233 $340,107 393 $365,644 40 $306,925 APPLICATIONS APPROVED, NOT ACCEPTED 531 $356,761 302 $393,722 15 $306,267 APPLICATIONS DENIED 229 $355,825 107 $399,561 54 $365,648 APPLICATIONS WITHDRAWN 85 $361,424 35 $405,600 4 $588,000 FILES CLOSED FOR INCOMPLETENESS 24 $399,667 12 $433,000 10 $504,300
Aggregated Statistics For Year 2007(Based on 155 full tracts) A) Conventional B) Refinancings C) Non-occupant Loans on D) Loans On Manufactured Number Average Value Number Average Value Number Average Value Number Average Value
LOANS ORIGINATED 1,312 $348,769 509 $388,283 54 $354,185 1 $272,000 APPLICATIONS APPROVED, NOT ACCEPTED 225 $361,836 203 $392,419 14 $411,000 0 $0 APPLICATIONS DENIED 69 $422,145 55 $579,782 20 $465,500 1 $238,000 APPLICATIONS WITHDRAWN 92 $360,185 63 $421,460 8 $337,750 0 $0 FILES CLOSED FOR INCOMPLETENESS 7 $326,143 5 $580,000 2 $201,000 0 $0
Aggregated Statistics For Year 2006(Based on 149 full tracts) A) Conventional B) Refinancings C) Non-occupant Loans on D) Loans On Manufactured Number Average Value Number Average Value Number Average Value Number Average Value
LOANS ORIGINATED 794 $338,963 307 $387,935 45 $351,356 0 $0 APPLICATIONS APPROVED, NOT ACCEPTED 220 $348,991 133 $388,383 20 $312,450 1 $144,000 APPLICATIONS DENIED 41 $434,927 22 $469,909 15 $504,867 0 $0 APPLICATIONS WITHDRAWN 67 $368,478 45 $375,089 7 $364,571 0 $0 FILES CLOSED FOR INCOMPLETENESS 6 $401,333 3 $320,333 1 $450,000 0 $0
Aggregated Statistics For Year 2005(Based on 158 full tracts) A) Conventional B) Refinancings C) Non-occupant Loans on Number Average Value Number Average Value Number Average Value
LOANS ORIGINATED 1,133 $328,223 344 $334,869 67 $331,925 APPLICATIONS APPROVED, NOT ACCEPTED 335 $328,504 150 $323,060 31 $289,032 APPLICATIONS DENIED 48 $405,083 16 $381,812 13 $322,231 APPLICATIONS WITHDRAWN 128 $356,219 45 $339,067 16 $301,125 FILES CLOSED FOR INCOMPLETENESS 24 $302,708 13 $348,692 1 $309,000
Aggregated Statistics For Year 2004(Based on 156 full tracts) A) Conventional B) Refinancings C) Non-occupant Loans on Number Average Value Number Average Value Number Average Value
LOANS ORIGINATED 1,795 $295,223 363 $290,758 97 $288,639 APPLICATIONS APPROVED, NOT ACCEPTED 491 $301,957 235 $291,787 28 $276,750 APPLICATIONS DENIED 67 $330,000 10 $302,900 16 $294,250 APPLICATIONS WITHDRAWN 194 $306,356 61 $312,377 20 $337,050 FILES CLOSED FOR INCOMPLETENESS 31 $305,968 23 $250,783 3 $367,000
Aggregated Statistics For Year 2003(Based on 161 full tracts) A) Conventional B) Refinancings C) Non-occupant Loans on Number Average Value Number Average Value Number Average Value
LOANS ORIGINATED 2,627 $267,105 929 $249,450 107 $257,084 APPLICATIONS APPROVED, NOT ACCEPTED 543 $272,737 409 $256,687 44 $263,682 APPLICATIONS DENIED 69 $301,870 21 $280,714 13 $318,000 APPLICATIONS WITHDRAWN 161 $293,180 96 $266,167 13 $217,308 FILES CLOSED FOR INCOMPLETENESS 11 $347,727 7 $278,143 1 $280,000
Aggregated Statistics For Year 2002(Based on 158 full tracts) A) Conventional B) Refinancings C) Non-occupant Loans on Number Average Value Number Average Value Number Average Value
LOANS ORIGINATED 2,438 $241,689 716 $235,113 110 $230,491 APPLICATIONS APPROVED, NOT ACCEPTED 621 $248,934 346 $239,217 26 $206,077 APPLICATIONS DENIED 65 $282,400 41 $278,488 12 $311,000 APPLICATIONS WITHDRAWN 164 $243,512 95 $249,389 11 $208,545 FILES CLOSED FOR INCOMPLETENESS 13 $215,154 6 $218,500 4 $205,250
Aggregated Statistics For Year 2001(Based on 158 full tracts) A) Conventional B) Refinancings C) Non-occupant Loans on Number Average Value Number Average Value Number Average Value
LOANS ORIGINATED 2,607 $219,921 852 $219,516 78 $196,321 APPLICATIONS APPROVED, NOT ACCEPTED 628 $217,753 220 $221,705 24 $205,958 APPLICATIONS DENIED 76 $243,421 55 $245,636 17 $213,824 APPLICATIONS WITHDRAWN 48 $218,938 28 $210,857 3 $221,000 FILES CLOSED FOR INCOMPLETENESS 23 $217,783 7 $200,000 0 $0
Aggregated Statistics For Year 2000(Based on 160 full tracts) A) Conventional B) Refinancings C) Non-occupant Loans on Number Average Value Number Average Value Number Average Value
LOANS ORIGINATED 2,569 $197,221 295 $191,814 81 $133,321 APPLICATIONS APPROVED, NOT ACCEPTED 406 $198,862 80 $190,450 20 $117,400 APPLICATIONS DENIED 103 $199,612 26 $269,346 4 $102,250 APPLICATIONS WITHDRAWN 51 $210,235 16 $220,938 4 $234,250 FILES CLOSED FOR INCOMPLETENESS 24 $163,667 6 $194,833 3 $141,000
Aggregated Statistics For Year 1999(Based on 161 full tracts) A) Conventional B) Refinancings C) Non-occupant Loans on Number Average Value Number Average Value Number Average Value
LOANS ORIGINATED 2,820 $192,334 777 $176,885 64 $150,266 APPLICATIONS APPROVED, NOT ACCEPTED 369 $200,531 218 $183,083 17 $144,647 APPLICATIONS DENIED 150 $191,440 44 $235,659 16 $150,250 APPLICATIONS WITHDRAWN 70 $218,586 37 $211,703 6 $131,333 FILES CLOSED FOR INCOMPLETENESS 27 $211,148 15 $193,067 2 $241,000
Most common first names in Bergen County, NJ among deceased individuals Name Count Lived (average)
John 9,137 74.7 years Mary 7,920 81.1 years Joseph 6,348 75.2 years William 5,486 75.3 years Anna 4,726 82.7 years Helen 3,862 80.4 years Frank 3,702 76.1 years George 3,632 75.5 years Charles 3,498 75.8 years Margaret 3,472 80.1 years
Most common last names in Bergen County, NJ among deceased individuals Last name Count Lived (average)
Smith 1,192 77.2 years Miller 774 77.3 years Johnson 630 76.5 years Brown 577 76.0 years Murphy 449 75.6 years Williams 444 74.6 years Jones 431 74.4 years Kelly 407 75.9 years Anderson 392 77.9 years Martin 388 76.4 years
Businesses in Bergen County, NJ
Name Count Name Count
24 Hour Fitness 2 IHOP 5 7-Eleven 39 J. Jill 1 A&P 9 J.Crew 4 ALDO 3 JCPenney 1 AMF Bowling 1 Jamba Juice 2 AT&T 21 JoS. A. Bank 4 Abercrombie & Fitch 2 Johnny Rockets 1 Abercrombie Kids 1 Jones New York 6 Ace Hardware 2 Journeys 1 Advance Auto Parts 5 Justice 2 Aeropostale 3 KFC 11 Aerosoles 2 Kincaid 1 American Eagle Outfitters 1 Kmart 5 Ann Taylor 7 Kohl's 2 Apple Store 2 Kroger 1 Applebee's 4 La Quinta 1 Arby's 1 La-Z-Boy 3 Ashley Furniture 1 Lane Furniture 3 Audi 3 LensCrafters 6 AutoZone 4 Lowe's 2 Avenue 6 Macy's 3 BMW 3 Marriott 10 Baja Fresh Mexican Grill 1 Marshalls 5 Bakers 2 MasterBrand Cabinets 62 Bally Total Fitness 2 McDonald's 19 Banana Republic 5 Men's Wearhouse 4 Barnes & Noble 2 Motherhood Maternity 3 Baskin-Robbins 26 New Balance 21 Bath & Body Works 4 New York & Co 4 Bebe 1 Nike 49 Bed Bath & Beyond 4 Nissan 5 Ben & Jerry's 3 Nordstrom 2 Best Cellars 1 Office Depot 1 Best Western 3 Old Navy 3 Blockbuster 13 Olive Garden 1 Brooks Brothers 2 On The Border 1 Brookstone 3 Outback 2 Brunswick Bowling & Billiards 1 Outback Steakhouse 2 Budget Car Rental 4 Pac Sun 1 Burger King 20 Panera Bread 8 Buybuy BABY 1 Papa John's Pizza 5 CVS 38 Pathmark 6 Cache 2 Payless 14 Casual Male XL 2 Penske 4 Catherines 1 PetSmart 1 Century 21 1 Pier 1 Imports 4 Charlotte Russe 2 Pizza Hut 7 Chevrolet 3 Popeyes 7 Chick-Fil-A 1 Pottery Barn 2 Chico's 7 Pottery Barn Kids 1 Chipotle 2 Qdoba Mexican Grill 2 Cinnabon 4 Quality 1 Circle K 5 Quiznos 4 Clarks 1 RadioShack 19 Cold Stone Creamery 3 Ramada 1 Coldwater Creek 1 Raymour & Flanigan 1 Comfort Inn 2 Red Lobster 1 Comfort Suites 1 Rite Aid 18 Costco 1 Ruby Tuesday 1 Crate & Barrel 1 Ryder Rental & Truck Leasing 1 Curves 3 SONIC Drive-In 1 DHL 6 Saks Fifth Avenue 1 Dairy Queen 15 Sears 12 Days Inn 1 Sephora 2 Decora Cabinetry 20 Sheraton 1 Domino's Pizza 6 Skechers USA 2 DressBarn 6 Soma Intimates 2 Dressbarn 6 Sprint Nextel 9 Dunkin Donuts 104 Staples 12 Econo Lodge 2 Starbucks 31 Express 4 Stop & Shop 12 Extended Stay America 2 Subaru 3 Famous Footwear 1 Subway 7 Fashion Bug 1 Super 8 1 FedEx 212 T-Mobile 2 Finish Line 1 T.G.I. Driday's 2 Firestone Complete Auto Care 5 T.J.Maxx 5 Food Basics 2 Taco Bell 7 Foot Locker 2 Talbots 5 Ford 5 Target 3 Forever 21 1 The Cheesecake Factory 1 GNC 20 The Room Place 6 GameStop 18 Toyota 5 Gap 10 Toys"R"Us 10 Goodwill 4 Trader Joe's 3 Gymboree 6 True Value 10 H&M 2 U-Haul 23 H&R Block 24 UPS 289 Haagen-Dazs 1 Urban Outfitters 1 Harmon Face Values 6 Verizon Wireless 8 Haworth 1 Victoria's Secret 6 Hilton 10 Volkswagen 4 Holiday Inn 9 Walgreens 18 Hollister Co. 2 Walmart 2 Home Depot 3 Wendy's 14 Homestead Studio Suites 1 Wet Seal 1 Honda 2 White Castle 2 Hot Topic 1 Whole Foods Market 4 Houlihan's 3 Wine & Spirits 1 Howard Johnson 1 World Gym 1 Hyatt 1 YMCA 6 Hyundai 2
Bergen County on our top lists :
#11 on the list of "Top 101 counties with the largest number of people without health insurance coverage in 2000 (pop. 50,000+)"
#11 on the list of "Top 101 counties with the most Orthodox adherents"
#11 on the list of "Top 101 counties with the most Orthodox adherents (pop. 50,000+)"
#14 on the list of "Top 101 counties with the lowest number of infant deaths per 1000 residents 2007-2013 (pop. 50,000+)"
#15 on the list of "Top 101 counties with the most Orthodox congregations (pop. 50,000+)"
#16 on the list of "Top 101 counties with the most Orthodox congregations"
#19 on the list of "Top 101 counties with the most Mainline Protestant congregations"
#19 on the list of "Top 101 counties with the most Mainline Protestant congregations (pop. 50,000+)"
#20 on the list of "Top 101 counties with the lowest percentage of residents that keep firearms around their homes"
#20 on the list of "Top 101 counties with the most Catholic adherents"
#20 on the list of "Top 101 counties with the most Catholic adherents (pop. 50,000+)"
#24 on the list of "Top 101 counties with the most Catholic congregations"
#24 on the list of "Top 101 counties with the most Catholic congregations (pop. 50,000+)"
#30 on the list of "Top 101 counties with the highest percentage of residents that visited a dentist within the past year"
#37 on the list of "Top 101 counties with the lowest Ozone (1-hour) air pollution readings in 2012 (ppm)"
#42 on the list of "Top 101 counties with the most Other congregations (pop. 50,000+)"
#43 on the list of "Top 101 counties with the most Other congregations"
#45 on the list of "Top 101 counties with the largest decrease in the number of infant deaths per 1000 residents 2000-2006 to 2007-2013 (pop. 50,000+)"
#46 on the list of "Top 101 counties with the most Other adherents"
#46 on the list of "Top 101 counties with the most Other adherents (pop. 50,000+)"
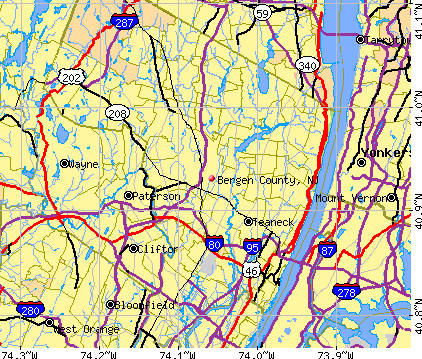


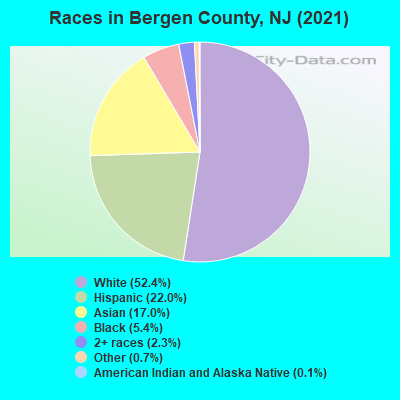


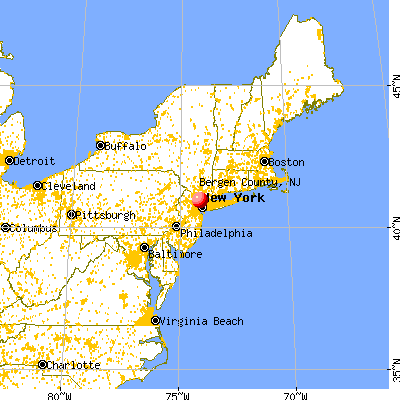
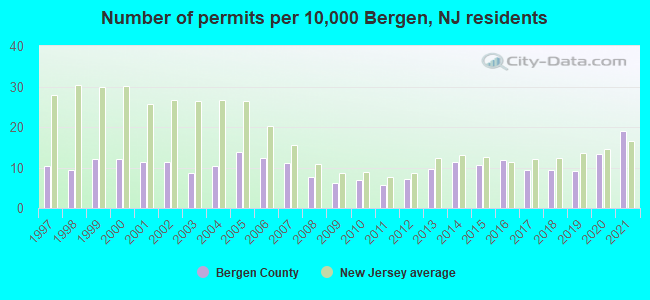
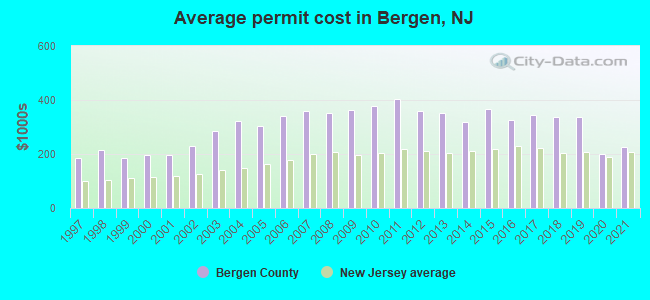
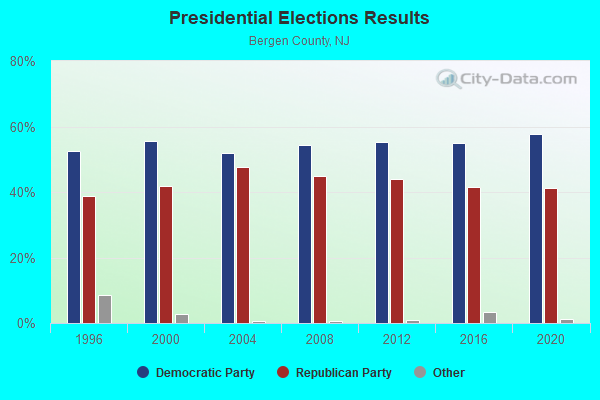
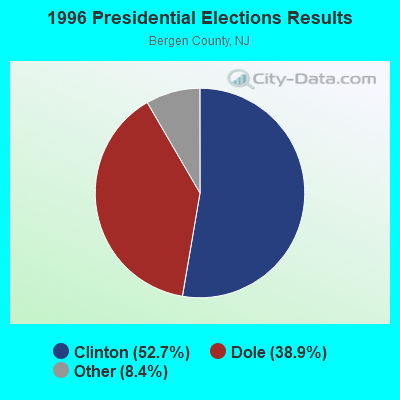
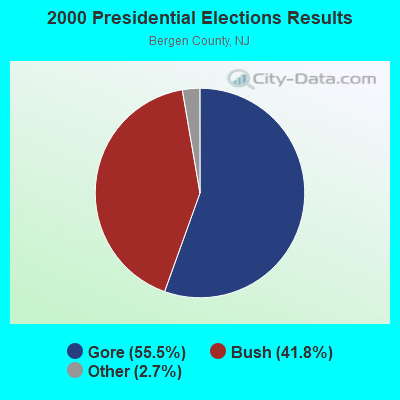
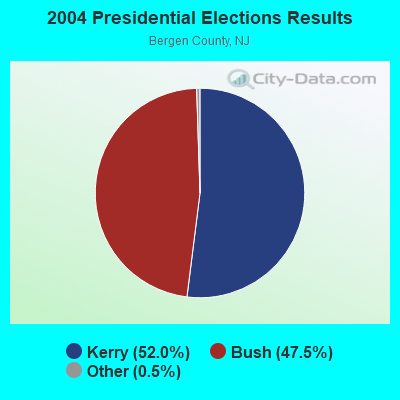
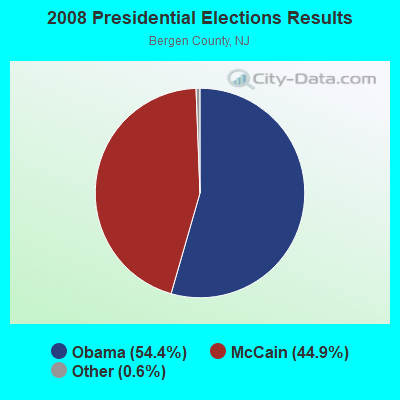


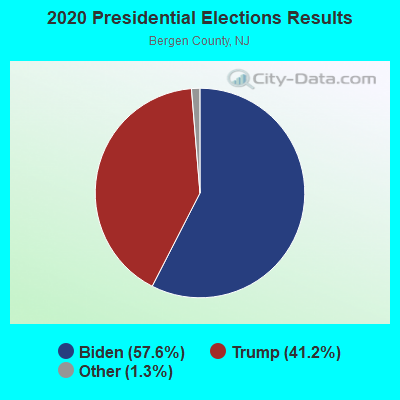

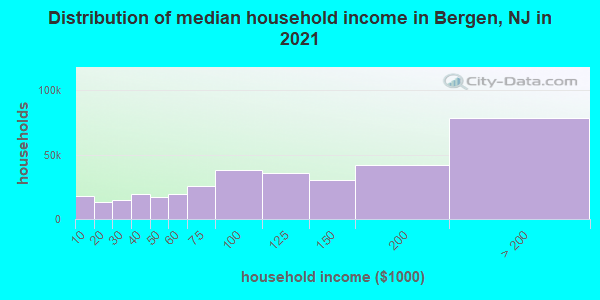
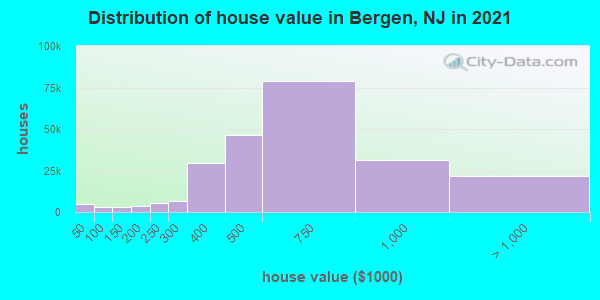
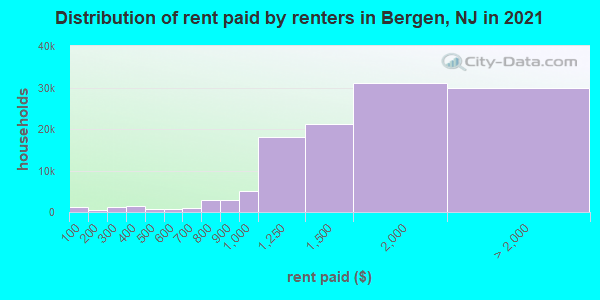
 , Pershing County, Nevada
  , Centre County, Pennsylvania