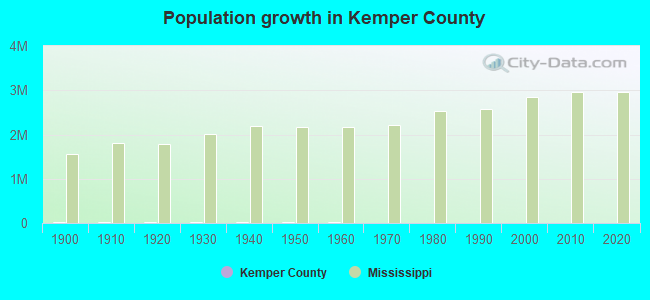
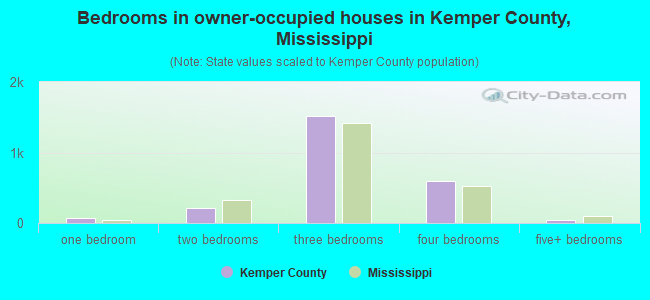
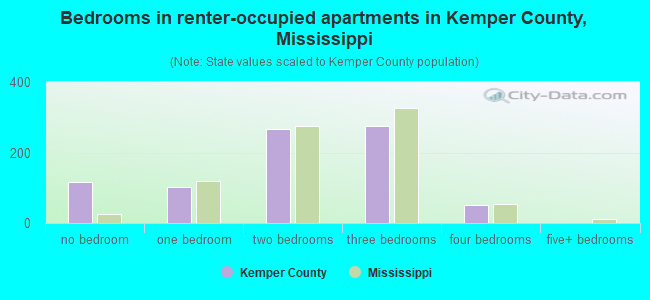
County population in 2023: 8,819 (all rural); it was 10,453 in 2000County owner-occupied with a mortgage or a loan houses and condos in 2010: 1,539 County owner-occupied free and clear houses and condos in 2010: 1,679 County owner-occupied houses and condos in 2000: 3,279 Renter-occupied apartments: 702 (it was 630 in 2000)
% of renters here:
16%
State:
30%
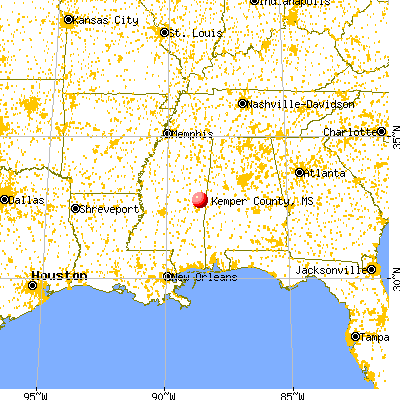
Land area: 766 sq. mi.
Water area: 0.9 sq. mi.
Population density: 12 people per square mile (low).
December 2024 cost of living index in Kemper County: 77.5 (low, U.S. average is 100)
Industries providing employment: Educational, health and social services (35.9%), Manufacturing (11.5%), Retail trade (11.1%).
Median real estate property taxes paid for housing units with mortgages in 2023: $604 (0.6%) Median real estate property taxes paid for housing units with no mortgage in 2023: $559 (0.7%)
Percentage of residents living in poverty in 2023: 23.3%
Kemper County:
23.3%
Mississippi:
18.0%
(11.2% for White Non-Hispanic residents, 29.8% for Black residents, 57.7% for Hispanic or Latino residents, 16.2% for American Indian residents, 22.2% for other race residents, 21.8% for two or more races residents)
Median age of residents in 2023: 41.7 years old
(Males: 39.2 years old, Females: 45.7 years old)
(Median age for: White residents: 52.8 years old, Black residents: 37.8 years old, American Indian residents: 35.1 years old, Hispanic or Latino residents: 51.5 years old, Other race residents: 75.3 years old)
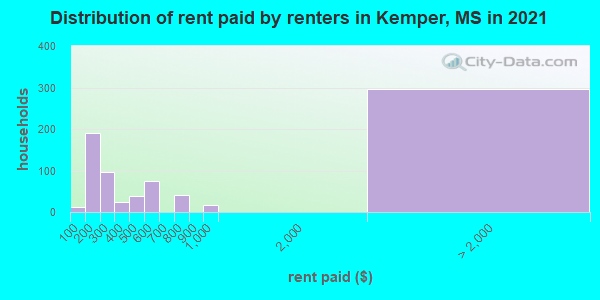
Fair market rent in 2006 for a 1-bedroom apartment in Kemper County is $420 a month. Fair market rent for a 2-bedroom apartment is $483 a month. Fair market rent for a 3-bedroom apartment is $632 a month.
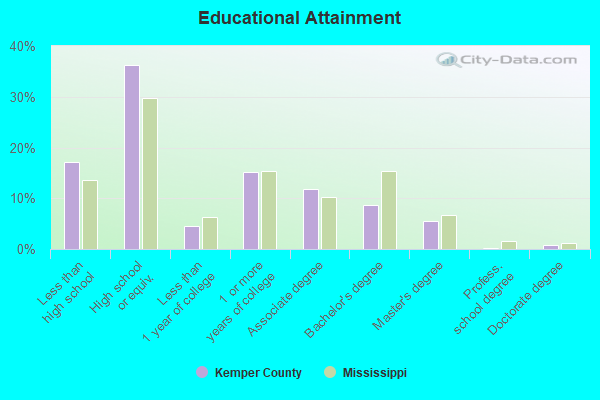
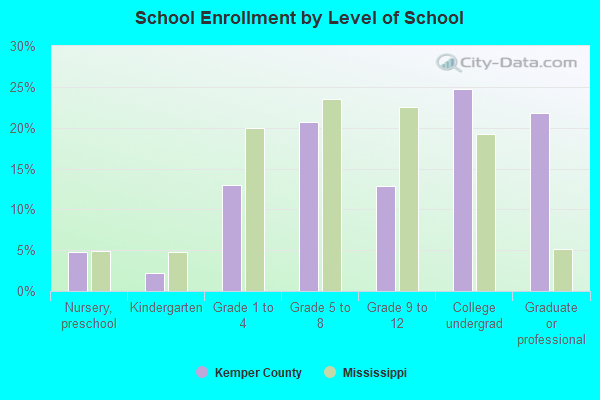
Current college students: 729 People 25 years of age or older with a high school degree or higher: 79.6% People 25 years of age or older with a bachelor's degree or higher: 17.8%
Number of foreign born residents: 24 (44.5% naturalized citizens)
Kemper County:
0.3%
Whole state:
2.6%
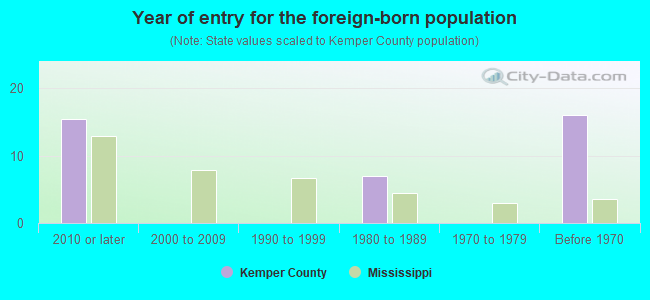
Year of entry for the foreign-born population
132010 or later
02000 to 2009
01990 to 1999
71980 to 1989
01970 to 1979
16Before 1970
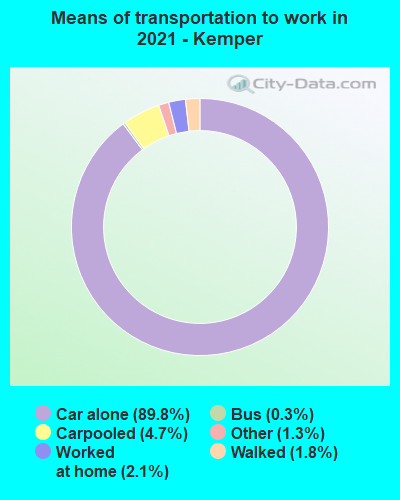
Mean travel time to work (commute): minutes
Percentage of county residents living and working in this county: 93.9%
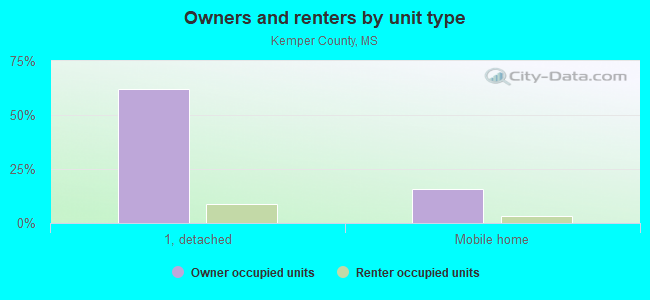
Housing units in structures:
One, detached: 2,784
One, attached: 7
Two: 26
3 or 4: 145
5 to 9: 82
10 to 19: 41
50 or more: 3
Mobile homes: 891
Boats, RVs, vans, etc.: 12
Housing units in Kemper County with a mortgage: 775 (24 second mortgage, 0 home equity loan, 18 both second mortgage and home equity loan) Houses without a mortgage: 0
Here:
100.0% with mortgage
State:
97.7% with mortgage
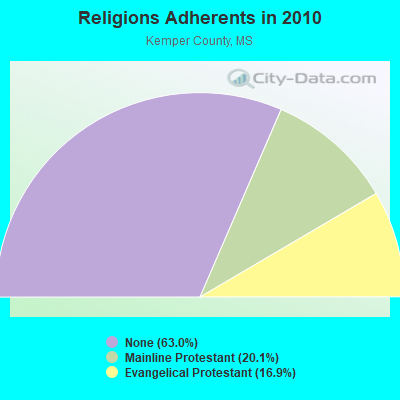
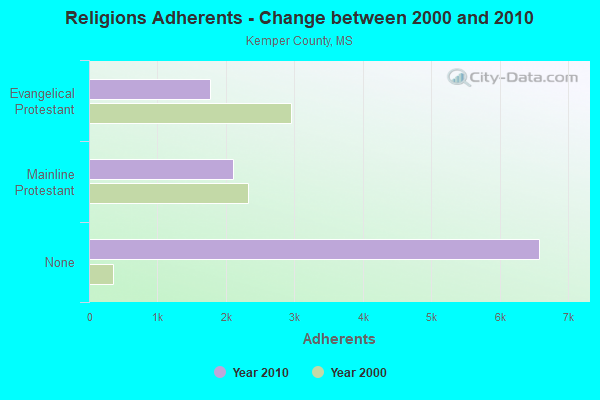
Religion statistics for Kemper County
Religion
Adherents
Congregations
Mainline Protestant
2,104
25
Evangelical Protestant
1,769
24
Other
-
1
None
6,583
-
Kemper County Religion Details
Source: Clifford Grammich, Kirk Hadaway, Richard Houseal, Dale E.Jones, Alexei Krindatch, Richie Stanley and Richard H.Taylor. 2012. 2010 U.S.Religion Census: Religious Congregations & Membership Study. Association of Statisticians of American Religious Bodies. Jones, Dale E., et al. 2002. Congregations and Membership in the United States 2000. Nashville, TN: Glenmary Research Center.
Food Environment Statistics:
Number of grocery stores: 3
Kemper County:
2.98 / 10,000 pop.
State:
2.08 / 10,000 pop.
Number of convenience stores (with gas): 7
Kemper County:
6.94 / 10,000 pop.
Mississippi:
6.36 / 10,000 pop.
Number of full-service restaurants: 1
This county:
0.99 / 10,000 pop.
State:
5.03 / 10,000 pop.
Adult diabetes rate:
Kemper County:
15.2%
Mississippi:
12.3%
Adult obesity rate:
Kemper County:
37.2%
State:
33.1%
Low-income preschool obesity rate:
Here:
13.1%
State:
14.4%
Agriculture in Kemper County:
Average size of farms: 245 acres Average value of agricultural products sold per farm: $19,512 Average value of crops sold per acre for harvested cropland: $62.20 The value of nursery, greenhouse, floriculture, and sod as a percentage of the total market value of agricultural products sold: 0.00% The value of livestock, poultry, and their products as a percentage of the total market value of agricultural products sold: 91.92% Average total farm production expenses per farm: $16,635 Harvested cropland as a percentage of land in farms: 10.36% Irrigated harvested cropland as a percentage of land in farms: 1.86% Average market value of all machinery and equipment per farm: $31,695 The percentage of farms operated by a family or individual: 96.42% Average age of principal farm operators: 59 years Average number of cattle and calves per 100 acres of all land in farms: 10.76 Milk cows as a percentage of all cattle and calves: 0.26% Corn for grain: 484 harvested acres Vegetables: 123 harvested acres Land in orchards: 13 acres
Earthquake activity:
Kemper County-area historical earthquake activity is significantly above Mississippi state average. It is 167% greater than the overall U.S. average.
On 1/18/1999 at 07:00:53, a magnitude 4.8 (4.8 MB, 4.0 LG, Depth: 0.6 mi, Class: Light, Intensity: IV - V) earthquake occurred 92.7 miles away from Kemper County center On 10/24/1997 at 08:35:17, a magnitude 4.9 (4.8 MB, 4.2 MS, 4.9 LG, Depth: 6.2 mi) earthquake occurred 138.8 miles away from the county center On 6/24/1975 at 11:11:36, a magnitude 4.5 (4.5 MB) earthquake occurred 81.7 miles away from the county center On 11/7/2004 at 11:20:21, a magnitude 4.3 (4.3 MW, Depth: 3.1 mi) earthquake occurred 42.5 miles away from the county center On 3/25/1976 at 00:41:20, a magnitude 5.0 (4.9 MB, 5.0 LG, Class: Moderate, Intensity: VI - VII) earthquake occurred 221.3 miles away from Kemper County center On 4/29/2003 at 08:59:39, a magnitude 4.9 (4.4 MB, 4.6 MW, 4.9 LG) earthquake occurred 211.7 miles away from the county center Magnitude types: regional Lg-wave magnitude (LG), body-wave magnitude (MB), surface-wave magnitude (MS), moment magnitude (MW)
Most recent natural disasters:
Mississippi Covid-19 Pandemic, Incident Period: January 20, 2020, FEMA Id: 4528, Natural disaster type: Other
Mississippi Severe Storms, Tornadoes, Straight-line Winds, And Flooding, Incident Period: April 13, 2019 - April 14, 2019, FEMA Id: 4450, Natural disaster type: Storm, Tornado, Flood, Wind
Mississippi Hurricane Isaac, Incident Period: August 26, 2012 to September 11, 2012, Major Disaster (Presidential) Declared DR-4081: August 29, 2012, FEMA Id: 4081, Natural disaster type: Hurricane
Mississippi Severe Storms, Tornadoes, Straight-line Winds, and Associated Flooding, Incident Period: April 15, 2011 to April 28, 2011, Major Disaster (Presidential) Declared DR-1972: April 29, 2011, FEMA Id: 1972, Natural disaster type: Storm, Tornado, Flood, Wind
Mississippi Hurricane Katrina, Incident Period: August 29, 2005 to October 14, 2005, Major Disaster (Presidential) Declared DR-1604: August 29, 2005, FEMA Id: 1604, Natural disaster type: Hurricane
Mississippi Hurricane Dennis, Incident Period: July 10, 2005 to July 15, 2005, Major Disaster (Presidential) Declared DR-1594: July 10, 2005, FEMA Id: 1594, Natural disaster type: Hurricane
Mississippi Severe Storms, Tornadoes and Flooding, Incident Period: April 06, 2003 to April 25, 2003, Major Disaster (Presidential) Declared DR-1459: April 24, 2003, FEMA Id: 1459, Natural disaster type: Storm, Tornado, Flood
Mississippi Severe Winter Storms, Ice and Freezing Rain, Incident Period: December 23, 1998 to December 26, 1998, Major Disaster (Presidential) Declared DR-1265: January 25, 1999, FEMA Id: 1265, Natural disaster type: Winter Storm, Freeze
Mississippi High Winds, Severe Storm, Tornadoes, Incident Period: November 21, 1992 to November 22, 1992, Major Disaster (Presidential) Declared DR-968: November 25, 1992, FEMA Id: 968, Natural disaster type: Storm, Tornado, Wind
Mississippi Flooding, Severe Storm, Tornado, Incident Period: January 24, 1990 to March 15, 1990, Major Disaster (Presidential) Declared DR-859: February 28, 1990, FEMA Id: 859, Natural disaster type: Storm, Tornado, Flood
6 other natural disasters have been reported since 1953.
The number of natural disasters in Kemper County (16) is near the US average (19). Major Disasters (Presidential) Declared: 10
Causes of natural disasters: Floods: 6, Storms: 6, Tornadoes: 6, Hurricanes: 5, Winds: 3, Winter Storms: 2, Freeze: 1, Heavy Rain: 1, Other: 2 (Note: some incidents may be assigned to more than one category).
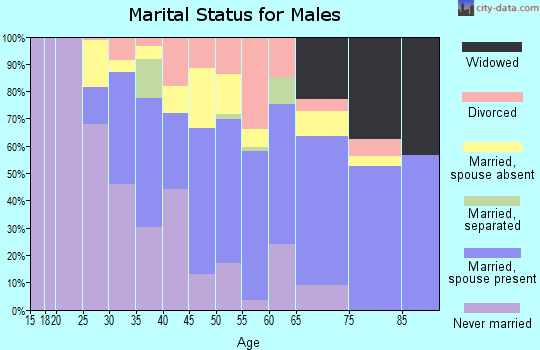
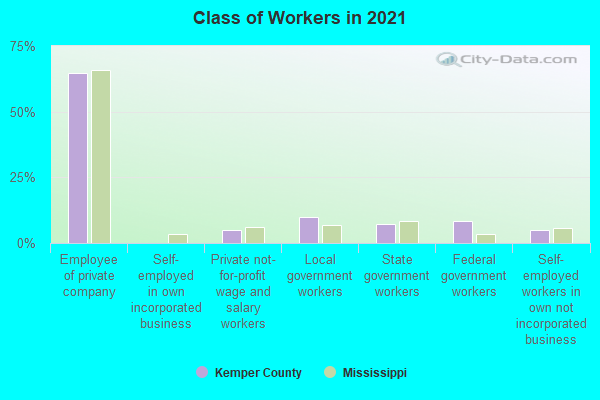
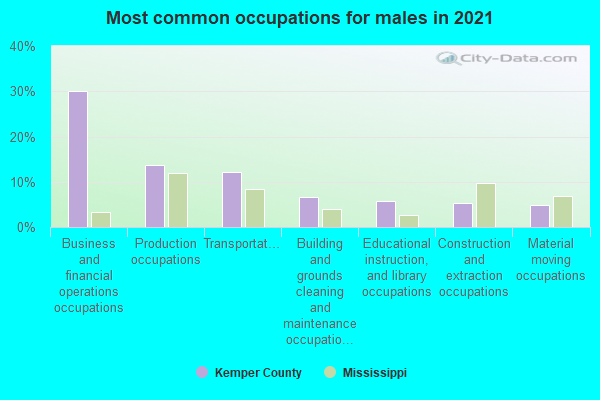
Business and financial operations occupations (18%)
Transportation occupations (14%)
Production occupations (11%)
Construction and extraction occupations (9%)
Community and social service occupations (7%)
Office and administrative support occupations (7%)
Material moving occupations (6%)
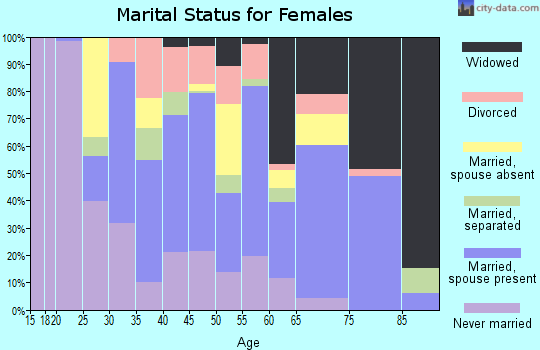
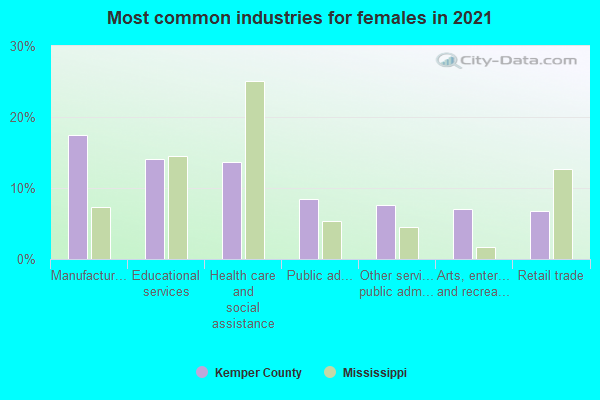
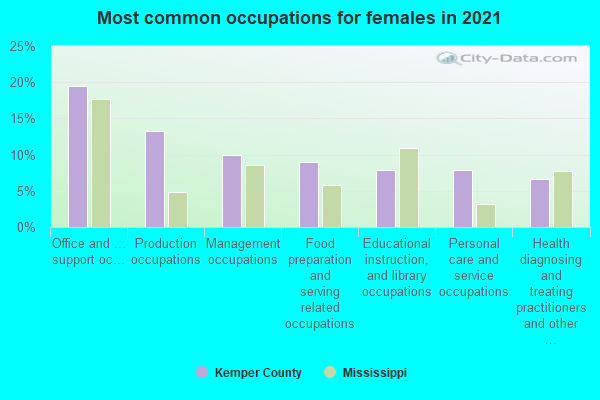
Office and administrative support occupations (24%)
Educational instruction, and library occupations (11%)
Management occupations (8%)
Personal care and service occupations (8%)
Health diagnosing and treating practitioners and other technical occupations (8%)
Healthcare support occupations (8%)
Health technologists and technicians (7%)
Germany (43%)
Mexico (35%)
Nepal (13%)
Jamaica (4%)
Norway (0%)
Sweden (0%)
United Kingdom, excluding England and Scotland (0%)
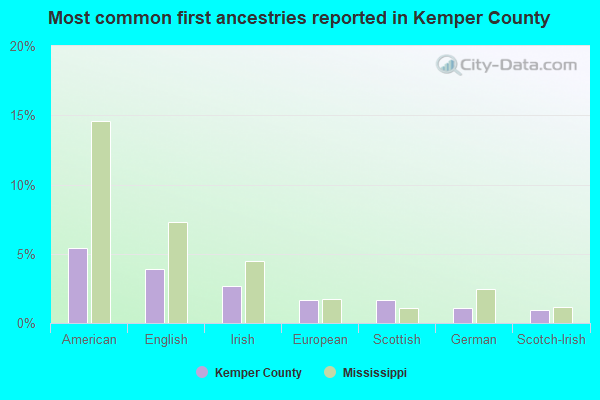
American (11%)
Irish (3%)
English (3%)
German (1%)
European (1%)
Italian (1%)
Scottish (1%)
People in group quarters in Kemper County, Mississippi in 2010:
333 people in state prisons
289 people in college/university student housing
60 people in nursing facilities/skilled-nursing facilities
26 people in group homes intended for adults
People in group quarters in Kemper County, Mississippi in 2000:
309 people in college dormitories (includes college quarters off campus)
81 people in nursing homes
7 people in local jails and other confinement facilities (including police lockups)
Average gross adjusted income of non-migrant taxpayers in this county in 2020 was $39,255.
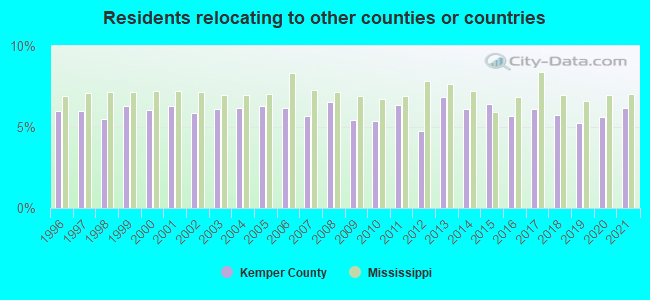
5.03% of this county's 2021 resident taxpayers lived in other counties in 2020 ($39,494 average adjusted gross income)
Here:
5.03%
Mississippi average:
6.85%
10 or fewer of this county's residents moved from foreign countries.
3.83% relocated from other counties in Mississippi ($28,975 average AGI)
1.19% relocated from other states ($10,525 average AGI)
Kemper County:
1.19%
Mississippi average:
2.80%
Top counties from which taxpayers relocated into this county between 2020 and 2021:
6.20% of this county's 2020 resident taxpayers moved to other counties in 2021 ($33,810 average adjusted gross income)
Here:
6.20%
Mississippi average:
7.03%
10 or fewer of this county's residents moved to foreign countries.
4.90% relocated to other counties in Mississippi ($25,040 average AGI)
1.30% relocated to other states ($8,770 average AGI)
Kemper County:
1.30%
Mississippi average:
2.99%
Top counties to which taxpayers relocated from this county between 2020 and 2021:
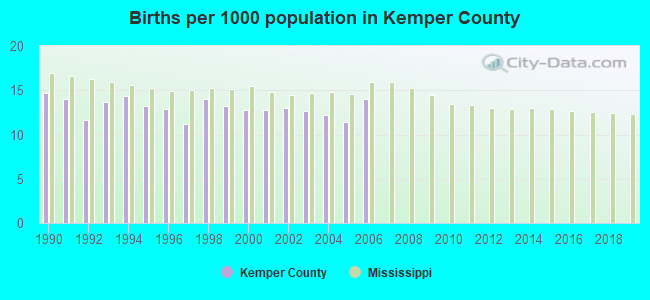
Births per 1000 population from 1990 to 1999: 13.3 Births per 1000 population from 2000 to 2006: 12.7
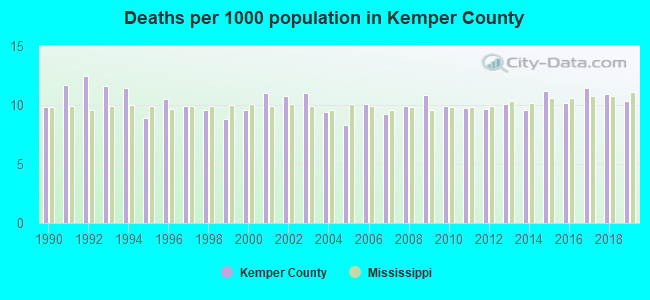
Deaths per 1000 population from 1990 to 1999: 10.5 Deaths per 1000 population from 2000 to 2009: 10.0 Deaths per 1000 population from 2010 to 2020: 10.6
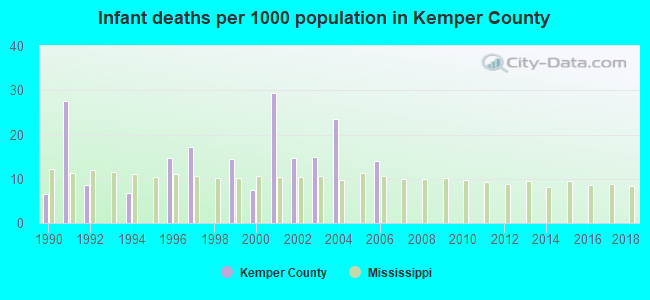
Infant deaths per 1000 live births from 1990 to 1999: 9.6 Infant deaths per 1000 live births from 2000 to 2006: 14.9
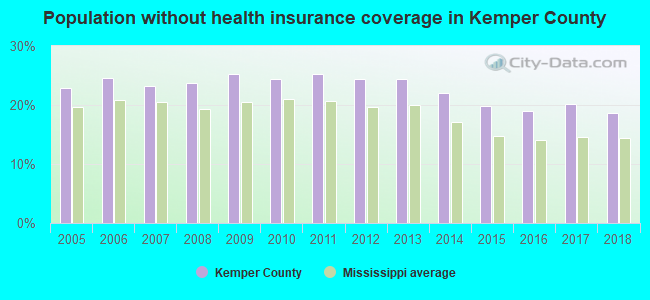
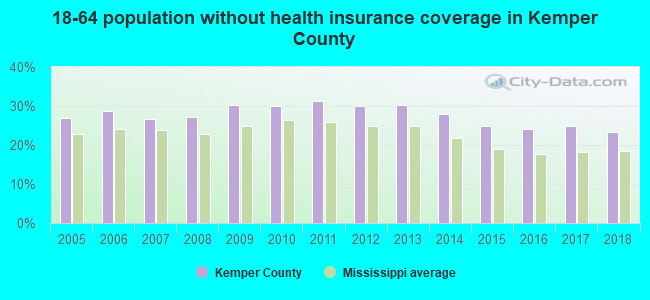
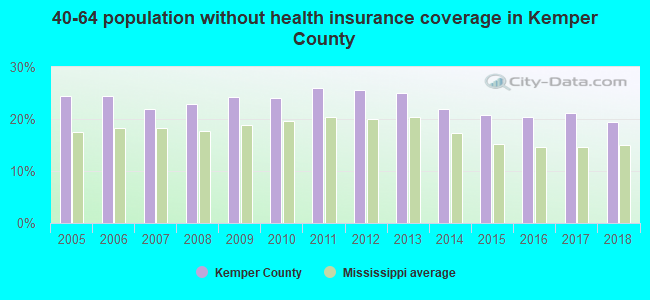
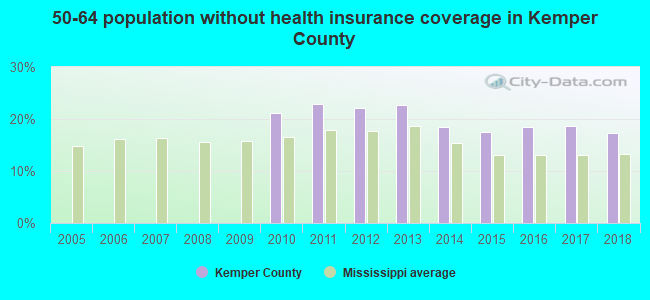
Population without health insurance coverage in 2018: 18.7% Persons under 19 years old without health insurance coverage in 2018: 5.6%
Percentage of population without health insurance coverage in Kemper County
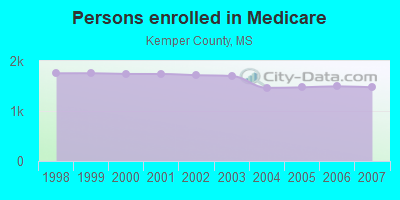
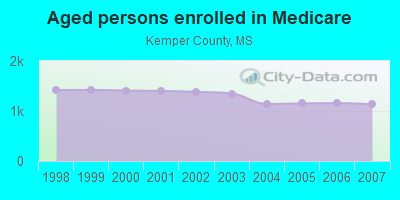
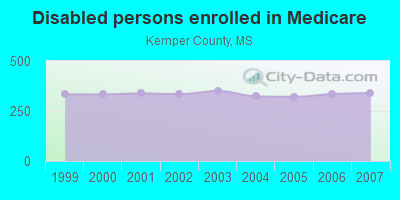
Persons enrolled in hospital insurance and/or supplemental medical insurance (Medicare) in July 1, 2007: 1,474 (1,134 aged, 340 disabled) Children under 18 without health insurance coverage in 2007: 316 (14%)
Most common underlying causes of death in Kemper County, Mississippi in 1999 - 2019:
Acute myocardial infarction, unspecified (128)
Atherosclerotic heart disease (55)
Bronchus or lung, unspecified - Malignant neoplasms (20)
Sudden cardiac death, so described (13)
Stroke, not specified as haemorrhage or infarction (10)
Population without health insurance coverage in 2000: 21% Children under 18 without health insurance coverage in 2000: 17%
General practice office based MDs per 100,000 population in 2005: 1,132 Medical specialist MDs per 100,000 population in 2005: 966 Dentists per 100,000 population in 1998: 29
Total births per 100,000 population, July 2005 - July 2006 : 9 Total deaths per 100,000 population, July 2005 - July 2006: 10
Crimes per 100,000 population in 1996: 1
Household type by relationship:
Households: 8,819
Male householders: 1,289 (298 living alone), Female householders: 2,023 (676 living alone)
Size of family households: 1,269 2-persons, 534 3-persons, 159 4-persons, 159 5-persons, 9 6-persons, 50 7-or-more-persons.
Size of nonfamily households: 963 1-person, 140 2-persons, 23 3-persons.
443 married couples with children.
961 single-parent households (250 men, 711 women).
96.9% of residents of Kemper speak English at home.
1.3% of residents speak Spanish at home (81% speak English very well, 5% speak English well, 7% speak English not well, 8% don't speak English at all).
0.3% of residents speak other Indo-European language at home (92% speak English very well, 8% speak English well).
0.1% of residents speak Asian or Pacific Island language at home (100% speak English very well).
1.6% of residents speak other language at home (62% speak English very well, 32% speak English well, 6% speak English not well).
In fiscal year 2004:
Federal Government expenditure: $78,700,000 ($7,613 per capita) Department of Defense expenditure: $3,199,000 Federal direct payments to individuals for retirement and disability: $24,951,000 Federal other direct payments to individuals: $22,781,000 Federal direct payments not to individuals: $375,000 Federal grants: $26,117,000 Federal procurement contracts: $398,000 ($0,000 Department of Defense) Federal salaries and wages: $4,078,000 ($1,736,000 Department of Defense) Federal Government direct loans: $323,000 Federal guaranteed/insured loans: $394,000 Federal Government insurance: $0,000
Population change from April 1, 2000 to July 1, 2005:
Births: 755
Here:
74 per 1000 residents
State:
78 per 1000 residents
Deaths: 580
Here:
57 per 1000 residents
State:
51 per 1000 residents
Net international migration: +4
Here:
+0 per 1000 residents
State:
+4 per 1000 residents
Net internal migration: -364
Here:
-36 per 1000 residents
State:
-4 per 1000 residents
Total withdrawal of fresh water for public supply: 0.48 millions of gallons per day (all from ground)
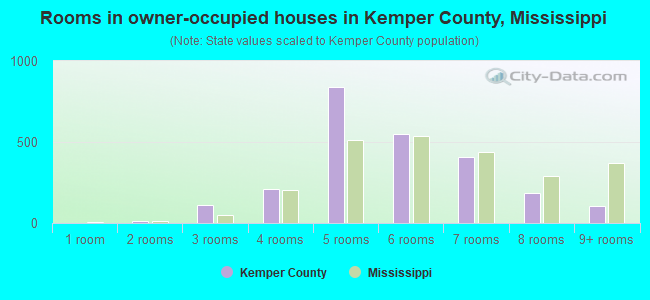
Median number of rooms in houses and condos:
Here:
5.6
State:
6.2
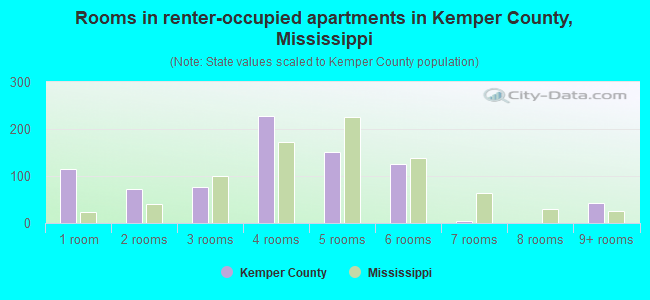
Median number of rooms in apartments:
Here:
4.8
State:
4.6
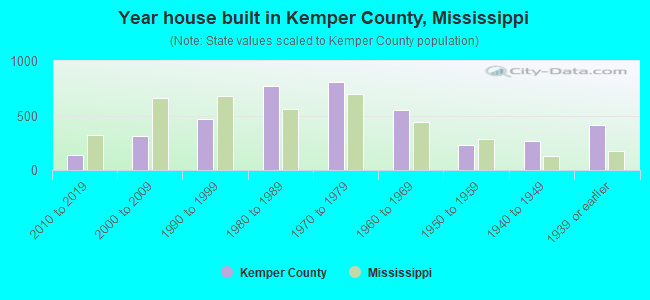
Year house built in Kemper County, Mississippi
02020 or later
2672010 to 2019
4162000 to 2009
6161990 to 1999
5331980 to 1989
1,0231970 to 1979
5011960 to 1969
1751950 to 1959
861940 to 1949
2761939 or earlier
Rooms in houses/apartments in Kemper County, Mississippi
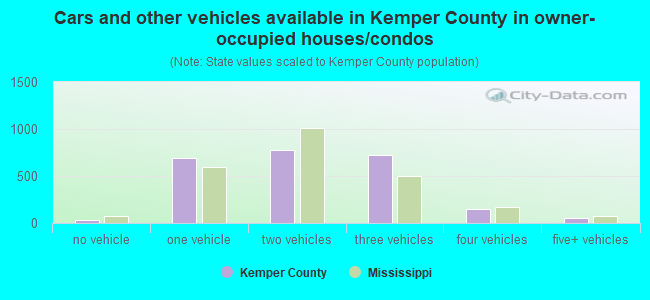
Cars and other vehicles available in Kemper County in owner-occupied houses/condos
101no vehicle
7651 vehicle
8752 vehicles
6303 vehicles
2324 vehicles
255+ vehicles
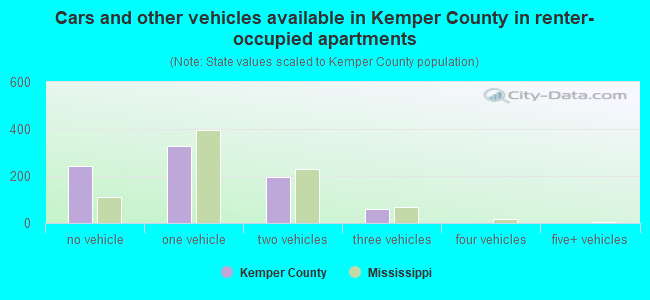
Cars and other vehicles available in Kemper County in renter-occupied apartments
60no vehicle
4241 vehicle
1392 vehicles
783 vehicles
04 vehicles
05+ vehicles
90.2% of Kemper County residents lived in the same house 1 years ago. Out of people who lived in different houses, 14% lived in this county. Out of people who lived in different counties, 53% lived in Mississippi.
Kemper County:
90.2%
State average:
89.5%
Place of birth for U.S.-born residents:
This state: 7,031
Other state: 1,698
Northeast: 72
Midwest: 378
South: 1,138
West: 108
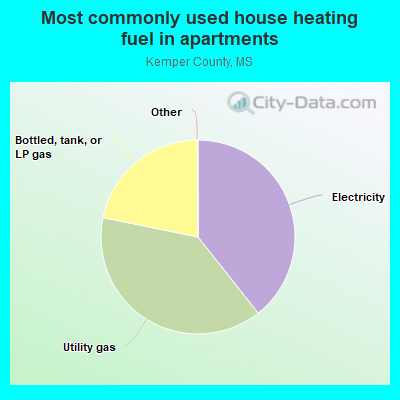
Most commonly used house heating fuel in Kemper County


 , Richland Parish, Louisiana
  , Union Parish, Louisiana
  , Johnson County, Georgia