Estimated zip code population in 2023: 7,031 Zip code population in 2010: 6,712 Zip code population in 2000: 7,111
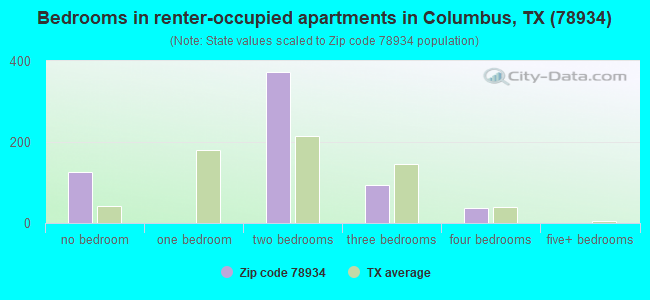
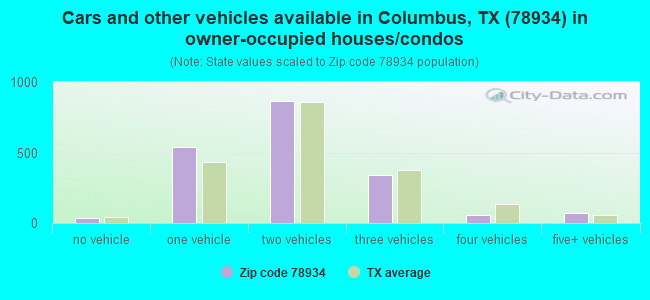
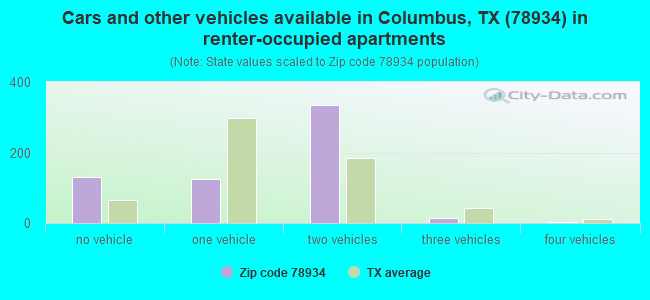
Houses and condos: 3,333 Renter-occupied apartments: 645
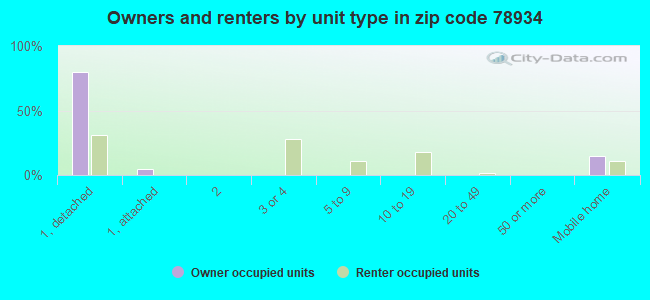
% of renters here:
26%
State:
37%
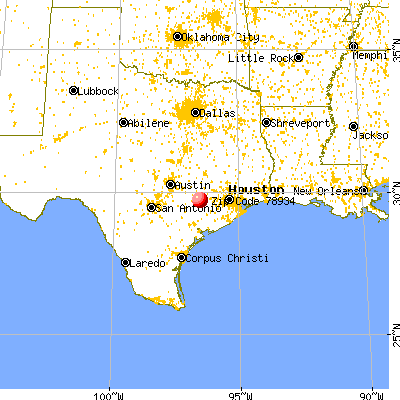
March 2022 cost of living index in zip code 78934: 80.5 (low, U.S. average is 100)
Land area: 191.9 sq. mi. Water area: 2.9 sq. mi.
Population density: 37 people per square mile
(very low).
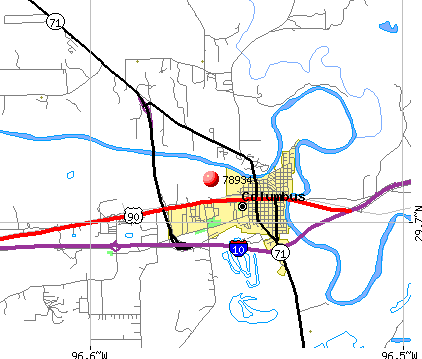
OSM Map
General Map
Google Map
MSN Map
OSM Map
General Map
Google Map
MSN Map
OSM Map
General Map
Google Map
MSN Map
OSM Map
General Map
Google Map
MSN Map
Please wait while loading the map...
Real estate property taxes paid for housing units in 2023:
This zip code:
0.9% ($2,253)
Texas:
1.4% ($4,274)
Median real estate property taxes paid for housing units with mortgages in 2023: $2,371 (0.6%) Median real estate property taxes paid for housing units with no mortgage in 2023: $2,227 (1.0%)
Averages for the 2020 tax year for zip code 78934, filed in 2021:
Average Adjusted Gross Income (AGI) in 2020: $76,514 (Individual Income Tax Returns)
Here:
$76,514
State:
$77,054
Salary/wage: $54,295 (reported on 76.5% of returns)
Here:
$54,295
State:
$62,766
(% of AGI for various income ranges: 1287.7% for AGIs below $25k, 3769.1% for AGIs $25k-50k, 6648.1% for AGIs $50k-75k, 9520.6% for AGIs $75k-100k, 17280.0% for AGIs $100k-200k, 97923.3% for AGIs over 200k)
Taxable interest for individuals: $2,783 (reported on 36.6% of returns)
This zip code:
$2,783
Texas:
$2,665
(% of AGI for various income ranges: 32.3% for AGIs below $25k, 37.5% for AGIs $25k-50k, 80.6% for AGIs $50k-75k, 172.8% for AGIs $75k-100k, 404.1% for AGIs $100k-200k, 4780.0% for AGIs over 200k)
Ordinary dividends: $8,555 (reported on 22.6% of returns)
Here:
$8,555
State:
$10,044
(% of AGI for various income ranges: 46.4% for AGIs below $25k, 62.1% for AGIs $25k-50k, 127.7% for AGIs $50k-75k, 328.9% for AGIs $75k-100k, 820.5% for AGIs $100k-200k, 9453.3% for AGIs over 200k)
Net capital gain/loss in AGI: +$45,257 (reported on 20.7% of returns)
Here:
+$45,257
State:
+$39,590
(% of AGI for various income ranges: 10.1% for AGIs below $25k, 41.4% for AGIs $25k-50k, 109.0% for AGIs $50k-75k, 271.7% for AGIs $75k-100k, 1243.2% for AGIs $100k-200k, 89670.0% for AGIs over 200k)
Profit/loss from business: +$16,826 (reported on 20.7% of returns)
Here:
+$16,826
State:
+$10,888
(% of AGI for various income ranges: 134.7% for AGIs below $25k, 142.6% for AGIs $25k-50k, 324.8% for AGIs $50k-75k, 506.7% for AGIs $75k-100k, 1850.5% for AGIs $100k-200k, 12096.7% for AGIs over 200k)
Taxable individual retirement arrangement distribution: $22,095 (reported on 11.9% of returns)
78934:
$22,095
Texas:
$24,740
(% of AGI for various income ranges: 92.5% for AGIs below $25k, 134.7% for AGIs $25k-50k, 310.6% for AGIs $50k-75k, 728.3% for AGIs $75k-100k, 1552.7% for AGIs $100k-200k, 4883.3% for AGIs over 200k)
Self-employed (Keogh) retirement plans: $18,400 (reported on 0.6% of returns)
78934:
$18,400
Texas:
$29,298
(% of AGI for various income ranges: 204.4% for AGIs $75k-100k)
Total itemized deductions: $53,905 (reported on 6.1% of returns)
Here:
$53,905
State:
$40,428
(% of AGI for various income ranges: 153.5% for AGIs $25k-50k, 232.6% for AGIs $50k-75k, 488.9% for AGIs $75k-100k, 868.6% for AGIs $100k-200k, 21313.3% for AGIs over 200k)
Charity contributions: $14,740 (reported on 4.6% of returns)
Here:
$14,740
State:
$18,201
(% of AGI for various income ranges: 130.6% for AGIs $50k-75k, 240.5% for AGIs $100k-200k, 4256.7% for AGIs over 200k)
Taxes paid: $6,728 (reported on 5.5% of returns)
78934:
$6,728
State:
$7,821
(% of AGI for various income ranges: 14.6% for AGIs $25k-50k, 35.2% for AGIs $50k-75k, 77.8% for AGIs $75k-100k, 158.6% for AGIs $100k-200k, 1766.7% for AGIs over 200k)
Earned income credit: $2,600 (reported on 17.1% of returns)
Here:
$2,600
State:
$2,584
(% of AGI for various income ranges: 128.8% for AGIs below $25k, 86.0% for AGIs $25k-50k)
Percentage of individuals using paid preparers for their 2020 taxes: 89.9%
Here:
90%
State:
92%
(% for various income ranges: 88.4% for AGIs below $25k, 89.9% for AGIs $25k-50k, 89.1% for AGIs $50k-75k, 96.7% for AGIs $75k-100k, 88.9% for AGIs $100k-200k, 93.8% for AGIs over 200k)
Averages for the 2012 tax year for zip code 78934, filed in 2013:
Average Adjusted Gross Income (AGI) in 2012: $51,757 (Individual Income Tax Returns)
Here:
$51,757
State:
$65,384
Salary/wage: $42,066 (reported on 80.9% of returns)
Here:
$42,066
State:
$52,524
(% of AGI for various income ranges: 76.3% for AGIs below $25k, 74.1% for AGIs $25k-50k, 71.4% for AGIs $50k-75k, 70.3% for AGIs $75k-100k, 67.4% for AGIs $100k-200k, 42.1% for AGIs over 200k)
Taxable interest for individuals: $2,173 (reported on 37.3% of returns)
This zip code:
$2,173
Texas:
$2,372
(% of AGI for various income ranges: 2.2% for AGIs below $25k, 1.2% for AGIs $25k-50k, 1.2% for AGIs $50k-75k, 1.5% for AGIs $75k-100k, 1.3% for AGIs $100k-200k, 2.2% for AGIs over 200k)
Ordinary dividends: $5,640 (reported on 21.0% of returns)
Here:
$5,640
State:
$9,721
(% of AGI for various income ranges: 1.4% for AGIs below $25k, 1.4% for AGIs $25k-50k, 1.8% for AGIs $50k-75k, 1.5% for AGIs $75k-100k, 3.2% for AGIs $100k-200k, 3.4% for AGIs over 200k)
Net capital gain/loss in AGI: +$6,661 (reported on 17.3% of returns)
Here:
+$6,661
State:
+$35,319
(% of AGI for various income ranges: 0.2% for AGIs below $25k, 0.6% for AGIs $25k-50k, 0.6% for AGIs $50k-75k, 0.9% for AGIs $75k-100k, 2.9% for AGIs $100k-200k, 6.4% for AGIs over 200k)
Profit/loss from business: +$17,316 (reported on 21.6% of returns)
Here:
+$17,316
State:
+$13,732
(% of AGI for various income ranges: 10.2% for AGIs below $25k, 6.0% for AGIs $25k-50k, 5.5% for AGIs $50k-75k, 6.4% for AGIs $75k-100k, 8.3% for AGIs $100k-200k, 7.4% for AGIs over 200k)
Taxable individual retirement arrangement distribution: $15,025 (reported on 11.1% of returns)
78934:
$15,025
Texas:
$19,511
(% of AGI for various income ranges: 3.3% for AGIs below $25k, 2.8% for AGIs $25k-50k, 3.5% for AGIs $50k-75k, 4.0% for AGIs $75k-100k, 5.3% for AGIs $100k-200k)
Self-employment retirement plans: $20,267 (reported on 0.9% of returns)
78934:
$20,267
Texas:
$23,938
Total itemized deductions: $22,142 (20% of AGI, reported on 18.2% of returns)
Here:
$22,142
State:
$24,724
Here:
20.0% of AGI
State:
15.9% of AGI
(% of AGI for various income ranges: 6.3% for AGIs below $25k, 6.8% for AGIs $25k-50k, 9.2% for AGIs $50k-75k, 7.5% for AGIs $75k-100k, 9.1% for AGIs $100k-200k, 6.7% for AGIs over 200k)
Charity contributions: $4,977 (reported on 13.3% of returns)
Here:
$4,977
State:
$6,808
(% of AGI for various income ranges: 0.5% for AGIs below $25k, 0.7% for AGIs $25k-50k, 0.9% for AGIs $50k-75k, 1.4% for AGIs $75k-100k, 1.5% for AGIs $100k-200k, 2.1% for AGIs over 200k)
Taxes paid: $5,497 (reported on 17.9% of returns)
78934:
$5,497
State:
$6,921
(% of AGI for various income ranges: 1.0% for AGIs below $25k, 1.3% for AGIs $25k-50k, 2.3% for AGIs $50k-75k, 1.6% for AGIs $75k-100k, 2.4% for AGIs $100k-200k, 2.1% for AGIs over 200k)
Earned income credit: $2,483 (reported on 19.4% of returns)
Here:
$2,483
State:
$2,570
(% of AGI for various income ranges: 7.2% for AGIs below $25k, 1.2% for AGIs $25k-50k)
Percentage of individuals using paid preparers for their 2012 taxes: 60.5%
Here:
60%
State:
51%
(% for various income ranges: 57.7% for AGIs below $25k, 60.3% for AGIs $25k-50k, 57.8% for AGIs $50k-75k, 60.0% for AGIs $75k-100k, 71.0% for AGIs $100k-200k, 87.5% for AGIs over 200k)
Averages for the 2004 tax year for zip code 78934, filed in 2005:
Average Adjusted Gross Income (AGI) in 2004: $42,821 (Individual Income Tax Returns)
Here:
$42,821
State:
$47,881
Salary/wage: $37,108 (reported on 79.1% of returns)
Here:
$37,108
State:
$41,947
(% of AGI for various income ranges: 161.8% for AGIs below $10k, 78.8% for AGIs $10k-25k, 75.6% for AGIs $25k-50k, 71.3% for AGIs $50k-75k, 75.9% for AGIs $75k-100k, 54.8% for AGIs over 100k)
Taxable interest for individuals: $2,512 (reported on 46.7% of returns)
This zip code:
$2,512
Texas:
$2,255
(% of AGI for various income ranges: 13.8% for AGIs below $10k, 4.3% for AGIs $10k-25k, 2.8% for AGIs $25k-50k, 2.6% for AGIs $50k-75k, 1.6% for AGIs $75k-100k, 2.4% for AGIs over 100k)
Taxable dividends: $3,157 (reported on 23.7% of returns)
Here:
$3,157
State:
$4,261
(% of AGI for various income ranges: 6.2% for AGIs below $10k, 1.2% for AGIs $10k-25k, 1.1% for AGIs $25k-50k, 1.9% for AGIs $50k-75k, 2.1% for AGIs $75k-100k, 1.9% for AGIs over 100k)
Net capital gain/loss: +$9,991 (reported on 22.2% of returns)
Here:
+$9,991
State:
+$16,110
(% of AGI for various income ranges: -1.1% for AGIs below $10k, 0.7% for AGIs $10k-25k, 0.9% for AGIs $25k-50k, 1.8% for AGIs $50k-75k, 0.8% for AGIs $75k-100k, 12.1% for AGIs over 100k)
Profit/loss from business: +$12,022 (reported on 21.7% of returns)
Here:
+$12,022
State:
+$11,013
(% of AGI for various income ranges: 9.2% for AGIs below $10k, 5.7% for AGIs $10k-25k, 5.8% for AGIs $25k-50k, 5.3% for AGIs $50k-75k, 4.5% for AGIs $75k-100k, 7.1% for AGIs over 100k)
IRA payment deduction: $3,816 (reported on 3.8% of returns)
78934:
$3,816
Texas:
$3,120
(% of AGI for various income ranges: 0.6% for AGIs $10k-25k, 0.5% for AGIs $25k-50k, 0.4% for AGIs $50k-75k, 0.2% for AGIs $75k-100k, 0.2% for AGIs over 100k)
Self-employed pension: $14,037 (reported on 0.9% of returns)
Here:
$14,037
Texas:
$16,401
Total itemized deductions: $18,232 (18% of AGI, reported on 16.0% of returns)
Here:
$18,232
State:
$19,631
Here:
18.1% of AGI
State:
18.9% of AGI
(% of AGI for various income ranges: 11.4% for AGIs below $10k, 7.2% for AGIs $10k-25k, 5.6% for AGIs $25k-50k, 7.8% for AGIs $50k-75k, 8.4% for AGIs $75k-100k, 6.2% for AGIs over 100k)
Charity contributions deductions: $4,453 (4% of AGI, reported on 12.8% of returns)
Here:
$4,453
State:
$4,753
Here:
4.0% of AGI
State:
4.2% of AGI
(% of AGI for various income ranges: 0.6% for AGIs $10k-25k, 0.8% for AGIs $25k-50k, 1.3% for AGIs $50k-75k, 1.7% for AGIs $75k-100k, 1.8% for AGIs over 100k)
Total tax: $8,082 (reported on 71.3% of returns)
78934:
$8,082
State:
$9,058
(% of AGI for various income ranges: 6.7% for AGIs below $10k, 3.7% for AGIs $10k-25k, 7.1% for AGIs $25k-50k, 9.3% for AGIs $50k-75k, 11.3% for AGIs $75k-100k, 22.6% for AGIs over 100k)
Earned income credit: $1,977 (reported on 17.7% of returns)
Here:
$1,977
State:
$2,024
Percentage of individuals using paid preparers for their 2004 taxes: 63.5%
Here:
63%
State:
57%
(% for various income ranges: 54.2% for AGIs below $10k, 64.3% for AGIs $10k-25k, 65.4% for AGIs $25k-50k, 64.5% for AGIs $50k-75k, 68.0% for AGIs $75k-100k, 80.3% for AGIs over 100k)
Household received Food Stamps/SNAP in the past 12 months: 155 Household did not receive Food Stamps/SNAP in the past 12 months: 2,347
Women who had a birth in the past 12 months: 78 (74 now married, 2 unmarried) Women who did not have a birth in the past 12 months: 1,063 (342 now married, 724 unmarried)
Housing units in zip code 78934 with a mortgage: 507 Houses without a mortgage: 50
Median monthly owner costs for units with a mortgage: $2,017 Median monthly owner costs for units without a mortgage: $587
Residents with income below the poverty level in 2023:
This zip code:
16.8%
Whole state:
13.7%
Residents with income below 50% of the poverty level in 2023:
This zip code:
4.6%
Whole state:
7.2%
Median number of rooms in houses and condos:
Here:
6.1
State:
6.2
Median number of rooms in apartments:
Here:
5.6
State:
4.0
Notable locations in this zip code not listed on our city pages
Notable locations in zip code 78934: Colorado County Courthouse Historic District (A), Zimmerscheidt Community Center (B), John Stafford House (C), Colorado County Sheriff's Office (D), Colorado County Justice of the Peace (E), Columbus Police Department (F), Balch Springs Public Library (G), Gilliam Memorial Public Library (H), McKinney Memorial Public Library (I), Nesbitt Memorial Library (J), Rita and Truett Smith Public Library (K), Tate-Senftenberg-Brandon House Museum (L), Stafford Opera House (M), Mary Elizabeth Hopkins Santa Claus Museum (N), Keith-Traylor Museum (O), Dilue Rose Harris House (P), Alley Log Cabin and Antique Tool Museum (Q), Columbus Volunteer Fire Department (R), Colorado County Emergency Medical Services (S), Guardian Emergency Medical Services (T). Display/hide their locations on the map
Cemeteries: Brune Cemetery (1), Pinchback Obenchain Cemetery (2), Gay Hill Cemetery (3), Ijams Cemetery (4), Kansteiner Cemetery (5). Display/hide their locations on the map
Lakes and reservoirs: Prairie Lake (A), Griffin Lake (B), Miller Lake (C), Black Lake (D), Cullen Lake (E), Schindler Lake (F). Display/hide their locations on the map
Streams, rivers, and creeks: Zimmer Creek (A), Yupon Creek (B), Wolfpen Creek (C), West Fork Sandy Creek (D), Snyder Branch (E), Rocky Creek (F), Plum Branch (G), Piney Creek (H), Miller Creek (I). Display/hide their locations on the map
674 married couples with children.
139 single-parent households (84 men, 55 women).
83.9% of residents of 78934 zip code speak English at home.
13.9% of residents speak Spanish at home (71% very well, 3% well, 25% not well, 1% not at all).
0.7% of residents speak other Indo-European language at home (98% very well, 2% well).
0.4% of residents speak Asian or Pacific Island language at home (100% very well).
0.7% of residents speak other language at home (100% very well).
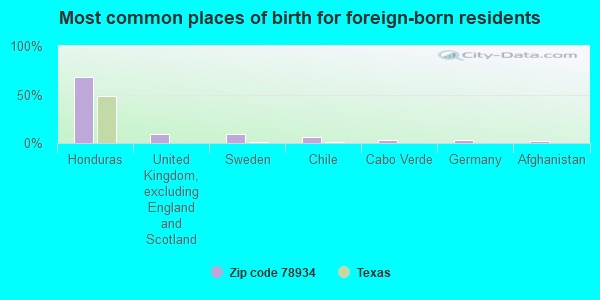
Foreign born population: 746 (10.6%) (71.5% of them are naturalized citizens)
This zip code:
10.6%
Whole state:
17.9%
51%Honduras
12%United Kingdom, excluding England and Scotland
10%Sweden
9%Germany
9%Cabo Verde
6%Chile
4%Thailand
30%German
11%English
5%Czech
4%Irish
4%American
4%French
1%Norwegian
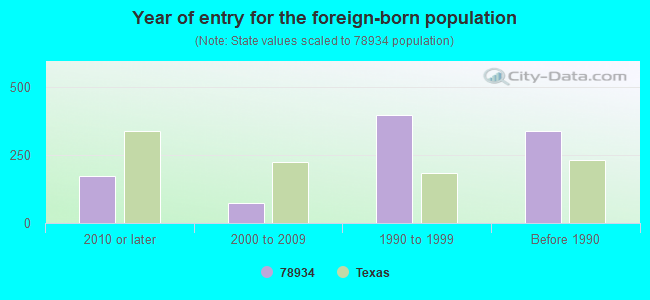
Year of entry for the foreign-born population
2042010 or later
672000 to 2009
1991990 to 1999
298Before 1990
Facilities with environmental interests located in this zip code:
A & A OIL CO BULK PLANT (4734 HIGHWAY 71 S in COLUMBUS, TX)
(Resource Conservation and Recovery Act (tracking hazardous waste)) Organizations: A AND A OIL CO BULK PLANT (CONTACT/OPERATOR)
Alternative names: A & A OIL CO COLUMBUS BULK PLT
BAROID DRILLING FLUIDS INC (101 AUSTIN in COLUMBUS, TX)
(Resource Conservation and Recovery Act (tracking hazardous waste)) Alternative names: NL PETROLEUM SVC INC
Housing units lacking complete plumbing facilities: 4.4% Housing units lacking complete kitchen facilities: 2.1%
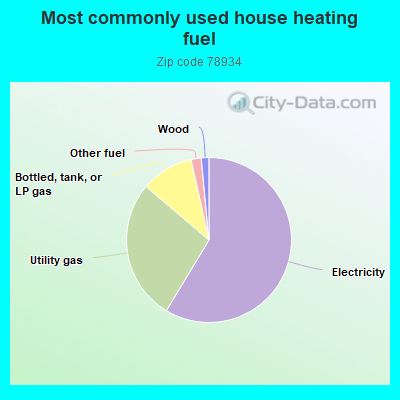
66.8%Electricity
16.8%Utility gas
12.8%Bottled, tank, or LP gas
1.8%Other fuel
1.8%Wood
Population in 1990: 5,234. Population change in the 1990s: +1,877 (+35.9%).
Place of birth for U.S.-born residents:
This state: 5,304
Northeast: 43
Midwest: 97
South: 465
West: 271
65% of the 78934 zip code residents lived in the same house 5 years ago. Out of people who lived in different houses, 44% lived in this county. Out of people who lived in different counties, 50% lived in Texas.
94% of the 78934 zip code residents lived in the same house 1 year ago. Out of people who lived in different houses, 54% moved from this county. Out of people who lived in different houses, 35% moved from different county within same state. Out of people who lived in different houses, 7% moved from different state. Out of people who lived in different houses, 5% moved from abroad.
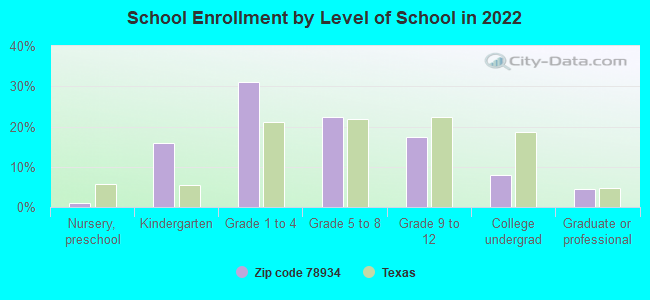
Private vs. public school enrollment:
Students in private schools in grades 1 to 8 (elementary and middle school): 75
Here:
7.7%
Texas:
9.7%
Students in private schools in grades 9 to 12 (high school): 9
Here:
3.1%
Texas:
8.3%
Students in private undergraduate colleges:
Here:
0.0%
Texas:
15.6%
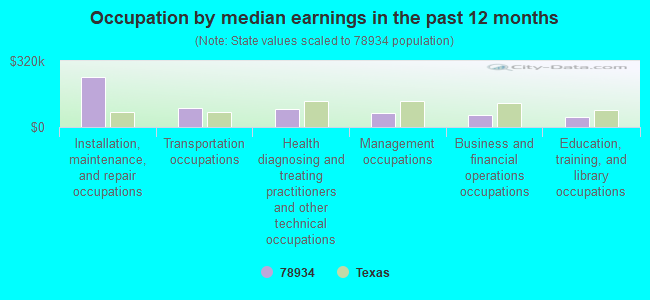
Occupation by median earnings in the past 12 months ($)
249,534Installation, maintenance, and repair occupations
123,862Management occupations
111,953Transportation occupations
91,063Health diagnosing and treating practitioners and other technical occupations
80,546Material moving occupations
58,488Business and financial operations occupations
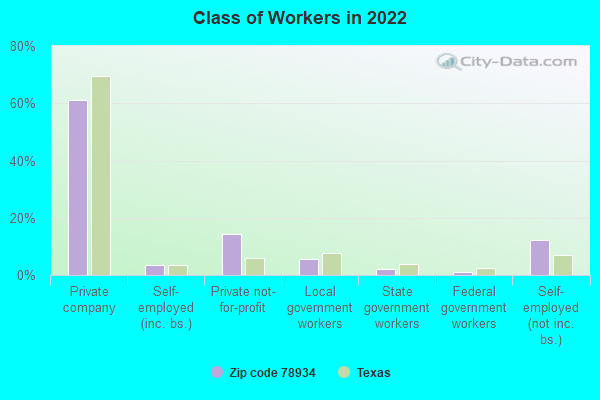
Top industries in this zip code by the number of employees in 2005:
Construction: Commercial and Institutional Building Construction (100-249: 1)
Health Care and Social Assistance: General Medical and Surgical Hospitals (100-249: 1)
Other Services (except Public Administration): Civic and Social Organizations (50-99: 1, 1-4: 1)
Administrative and Support and Waste Management and Remediation Services: All Other Support Services (50-99: 1)
People in group quarters in 2010:
183 people in nursing facilities/skilled-nursing facilities
61 people in local jails and other municipal confinement facilities
4 people in group homes intended for adults
People in group quarters in 2000:
395 people in college dormitories (includes college quarters off campus)
189 people in nursing homes
89 people in local jails and other confinement facilities (including police lockups)
52 people in other noninstitutional group quarters
Fatal accident statistics in 2014:
Fatal accident count: 2
Vehicles involved in fatal accidents: 3
Fatal accidents caused by drunken drivers: 0
Fatalities: 2
Persons involved in fatal accidents: 3
Pedestrians involved in fatal accidents: 0
Fatal accident statistics in 2013:
Fatal accident count: 6
Vehicles involved in fatal accidents: 11
Fatal accidents caused by drunken drivers: 0
Fatalities: 7
Persons involved in fatal accidents: 20
Pedestrians involved in fatal accidents: 0
2002 - 2018 National Fire Incident Reporting System (NFIRS) incidents
According to the data from the years 2002 - 2018 the average number of fires per year is 61. The highest number of fires - 142 took place in 2011, and the least - 6 in 2002. The data has a growing trend.
When looking into fire subcategories, the most reports belonged to: Outside Fires (62.2%), and Mobile Property/Vehicle Fires (19.2%).
Fire incident types reported to NFIRS in Zip Code 78934


 Nearest zip codes: 78943, 78935, 77470, 78938, 78962, 77412.


 According to the data from the years 2002 - 2018 the average number of fires per year is 61. The highest number of fires - 142 took place in 2011, and the least - 6 in 2002. The data has a growing trend.
 When looking into fire subcategories, the most reports belonged to: Outside Fires (62.2%), and Mobile Property/Vehicle Fires (19.2%).