Volatility is troublesome for many investors. Value changes in your stocks, your portfolio, or an index can keep you up at night or, worse, push you to make emotional decisions you later regret. Understanding an asset's potential for volatility, by way of a few calculations, can help you keep a level head when stock prices falter.

Standard deviation
Standard deviation as a volatility measure
To analyze volatility, you will start by creating a dataset that includes the daily closing values of a stock or an index. The longer the timeframe you use, the more reliable the results will be.
Using the closing values, you will first calculate the asset's daily returns. With those values, you can use a spreadsheet program like Microsoft Excel to calculate the asset's standard deviation.
Investors use standard deviation as a proxy for volatility. To interpret standard deviation as it pertains to volatility, you must understand the assumptions of a normal bell curve. When data is normally distributed, 68% of the values fall within one standard deviation, and 95% of the values fall within two standard deviations.
When a stock has a standard deviation of 10%, the assumption is that its price fluctuations will remain within 10%, higher or lower, 68% of the time. Two standard deviations, or 20% higher or lower, should encompass 95% of price change scenarios. This interpretation is not ironclad, however. The drawbacks are discussed in the final section below.
Microsoft Excel
How to calculate volatility with Microsoft Excel
To demonstrate the process, we will use 10 days of closing values for the S&P 500 (SNPINDEX:^GSPC). In practice, you would need a much larger dataset to achieve statistical significance.
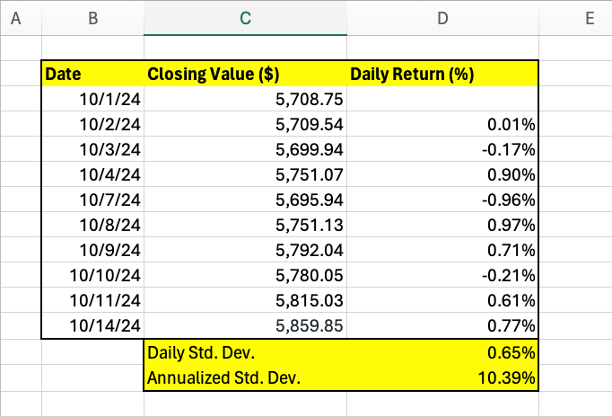
1. Calculate percentage changes. Using data in Column C, calculate the daily percentage change in the index. Starting with cell D4, the formula is the current day's closing value divided by the previous day's closing value minus 1, or (C4/C3)-1.
Pro tip: If you place your cursor in D4 where you have the formula, you can quickly populate cells D5 through D12. Do this by hovering your cursor over the lower right corner of D4 until you see a plus sign, then click, hold, and drag your cursor to D12.
2. Find the daily standard deviation. Now, you will use the STDEV.S function in Excel. Place your cursor in D13 and type '=STDEV.S(D4:D12)' without the quotation marks. This formula calculates the standard deviation of the dataset.
3. Annualize the standard deviation. Next, you will convert the daily value to an annualized one. To do this, multiply the daily volatility by the square root of 252, which is the number of trading days in a year. In cell D14, type '=SQRT(252)*D13' without the quotes. This tells you the annualized volatility of the index is 10.39% based on the sample data.
If you want to know the asset's weekly volatility, multiply the daily volatility by the square root of 5, or the number of trading days in a week. Using the formula '=SQRT(5)*D13' indicates that the weekly volatility is 1.46%.
Calculating portfolio volatility
Calculating portfolio volatility
You can also calculate the volatility of an entire portfolio, but this formula is far more complex. To keep things simple, we will explain the formula assuming a two-stock portfolio. The data points you need are:
- The portfolio weight of Stock 1 and Stock 2. Calculate this by dividing the value of each position by the total portfolio value. Let's label these values W1 and W2.
- The standard deviation of Stock 1 and Stock 2. You can calculate these values using the formula explained above. We will label these SD1 and SD2.
- The covariance, or relational movement, between Stock 1 and Stock 2. This will be one value for your two-stock portfolio, and we can call it C12. Use the CORREL function in Excel to calculate this value, applied to the two series of daily values for the two stocks.
The portfolio variance formula is: (W1^2)(SD1^2)+(W2^2)(SD2^2)+(2xW1xW2xC12). Note that '^2' means to the power of 2.
The logic underlying the formula is complicated. As you can see, the equation will be increasingly cumbersome as you add more stocks to your portfolio.
Related investing topics
Drawbacks of using standard deviation
Drawbacks of using standard deviation as a volatility measure
Standard deviation measurements assume returns are normally distributed. Normal distribution, known as the bell curve, assumes more results clustered near the center and fewer results that are significantly above or below average.
In reality, stock prices and index values can have asymmetrical distributions. They can stay unusually high or low for long periods. In addition, a stock's or index's volatility can change over time, which challenges the assumption of a constant statistical distribution of returns.
While performing historical volatility calculations helps construct a view of an asset's behavior, investors only have data for what's already occurred. Unfortunately, there is no guarantee that historical patterns will repeat. For that reason, standard deviation analysis should be one aspect of a much broader analysis to predict how a stock might behave.


