Excel is a tool widely used by professionals for financial data or trend analysis but can be used for different purposes. It is used for various data visualization purposes. It simplifies data management and data evaluation which uses spreadsheets for managing, storing, and visualizing large volumes of data. A single unit in excel is known as a cell, it is used to store the data point.
Running Total
Running total also known as the cumulative sum is a sequence of partial sums (sum of each data point) of any given data set. It is like a visual representation of a summary of data growing over time. This technique is commonly used by students and professionals to compute and calculate complex data and equations. This also saves time in recording the individual sequence numbers.
Creating Running Total
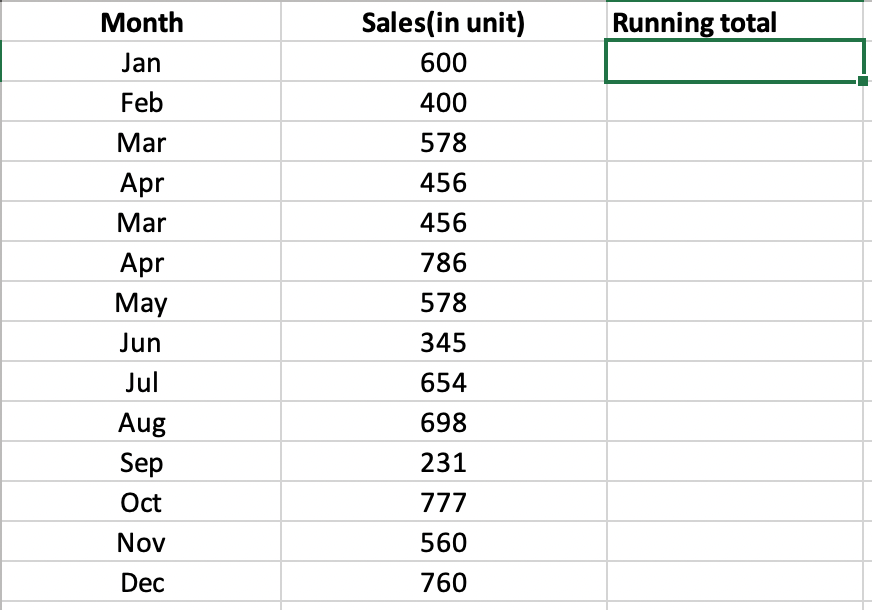
For the purpose of demonstration, we will create a running total of the below-given table:
Step 1: Make a new field with the name Running name. Select the first cell of the column where you want to create the running total (C2 in our case):

:
Step 2: Enter the SUM function shown below for, Running Total Formula:
=SUM($B$2:B2)
Explanation: The first cell ($B$2) in the range reference is an absolute reference that will remain fixed. The second cell (B2) in the range reference is a normal relative reference which will change. In our example, B2 is the cell containing the first value which is 600.
Step 3: Press Enter. This will populate the result of the formula in the first cell.
Step 4: Select cell first cell C2, click on the lower right corner of cell C2 and drag it down to cell C15.
Explanation: Dragging the formula down, the absolute reference ($B$2) stays the same, while the relative reference (B2) changes to B3, B4, B5, etc. corresponding to the related column in C3, C4, C5, etc. You can check the exact formula used in a cell by double-clicking on the cell. For example, let’s view the formula used in cell C6.
In this way, you can create a running total table in excel.