Open In App

How to Calculate the Midrange in Excel?

Last Updated: 30 Jul, 2021

S

Summarize
Comments
Improve
Suggest changes
Like Article
Like
Share
Report
News Follow

MS Excel is a spreadsheet developed by the company Microsoft. Excel provides various kinds of functions and we can insert the data in form of rows and columns and perform operations on the data and yield the results we desired.

The Midrange of the dataset in other terms can be specified as average or mean. the Midrange is also known as the measure of center in statistics.

Midrange of any dataset can be calculated as follows: (largest value + smallest value) / 2

In order to calculate using formulas of excel we follow 3 steps:

  • Calculate Min value
  • Calculate Max value
  • Apply midrange formula

Consider the following data i.e. marks obtained by students of a class

Sample data

To find the midrange of the given data we will follow the 3 steps

Step 1:Calculate the min value of the data by using the min function

Min Value

Step 2:Calculate the max value of the data by using the max function

Max Value

Step 3:Now apply the midrange formula

Midrange of the data

Finally, we get the midrange of the data as 70.

Drawbacks:

  • The midrange deviates hugely when there are outliers in our data
  • We need to find first the maximum and minimum value to the data in order to find the midrange
  • The midrange sometimes differs from mean and median hugely.

For example in our data, consider another field with the value of 1000 then the midrange will be 520.5 which is far away from the original midrange of 70. So this shows how large the midrange deviates from the outliers.

Alternatives:

Instead of finding the midrange, we can directly calculate the mean, median of the data  which points to the average or the midpoint of the data

Mean: It is the average value of the data set. It is calculated by the formula

Mean = Sum of all the observations/Total number of Observations

In excel we can directly compute the mean by using the average function.

Median: It is the middle value of the dataset. We need to first arrange the dataset in either non-increasing or non-decreasing order and select the middlemost element. In case there are two middlemost elements we compute the average of two.

In excel we can compute it by using the median function

This image gives the mean, median and midrange of the dataset.


S

News
Improve
Discuss
Do you want to advertise with us?Click here to know more

Editing Excel Macros in Excel

article_img
Excel Macro is a set of actions that can be recorded, saved, used multiple times. This feature saves us a lot of time when dealing with repetitive tasks and huge data sets. We can always make changes to an existing Macro in Excel. There are two ways to record and run macros: Excel Commands Excel Visual Basic for Applications(VBA).1. Copying a Macro Code We can reuse the existing macro code while creating new Macros. For example, if you have existing macros created using the record function, we can reuse the code to write new macros. To open the code follow the below steps: Select Tools --> Macros --> Visual Basic Editor. Copy code from the existing macros(use Command + C) and paste(use Command + V) in the new macro2. Renaming a Macro Follow the below steps to rename a Macro in Excel: Select Tools --> Macros --> Visual Basic Editor. Select name on the left plane.Edit the name.3. Deleting a Macro Follow the below steps to delete a macro in Excel: Select Tools --> Macros --> Macros... Select the macro to be deleted. Click on the minus(-) symbol at the bottom.Select yes to delete the macro.
Read More

Best Microsoft Excel High-Paying Jobs with Excel Skills in 2024

article_img
Are you ready to unlock a world of opportunities with Microsoft Excel? In today’s data-driven job market, mastering Excel is essential for launching a successful career, whether you're a fresher or an experienced professional. In this article, we will cover the high-paying Excel jobs available in 2024, including crucial roles like data analyst, business analyst, and many more. We'll explore the qualifications needed for these positions, along with salary estimations to help you understand your earning potential. Whether you’re looking for Excel jobs for freshers or seasoned professionals, we’ll also dive into options for Excel freelancing jobs and work-from-home jobs in Excel. Equip yourself with the knowledge to excel in your career and take the first step toward a lucrative future!Best Microsoft Excel High-Paying Jobs with Excel Skills in 2024Table of ContentWhy choose a career in ExcelWhy Excel Skills Are Essential for Your CareerEssential Excel Skills Required to Boost Your Resume Best Microsoft Excel High-Paying JobsFinancial AnalystsData AnalystAdministrative Assistant Accountants Project ManagersManagement ConsultantRetail Store ManagersBusiness Analyst Market Research A
Read More

Excel VLOOKUP Function - Excel Guide for Beginners

article_img
How to do Vlookup in Excel - Quick StepsPrepare Your DataEnter the VLOOKUP Formula >>Press EnterUse a Cell Reference for Flexibility Copy the Formula for Multiple RowsThe VLOOKUP function is one of the most widely used tools in Excel for looking up and retrieving data from a table. Whether you’re working with a single sheet or multiple workbooks, VLOOKUP allows you to search for a value in one column and return a related value from another. If you're new to Excel or still getting the hang of formulas, this guide is for you. We will cover everything from the basics of how VLOOKUP works to practical examples that show how to search data across sheets, troubleshoot common issues, and master the VLOOKUP formula for any task.Excel VLOOKUP FunctionWhat is the VLOOKUP Function in ExcelThe term VLOOKUP stands for Vertical Lookup. It is designed to search for a specific value in the first column of a table (lookup column) and retrieve corresponding data from a different column in the same row.Syntax of VLOOKUP FormulaVLOOKUP(lookup_value, table_array, col_index_num, [range_lookup])Arguments:1. lookup_value: The value you want to search for (e.g., a specific ID, name, or product code).
Read More

AI in Excel: Top 20 Excel AI Tools in 2025 (Free/Paid)

article_img
The integration of AI in Excel is transforming the way professionals manage, analyze, and visualize data. Whether you're handling large datasets, performing financial analysis, or automating repetitive tasks, AI-powered tools can significantly improve efficiency and accuracy. In 2025, advanced Excel AI tools are making complex tasks easier by offering features like data cleaning, predictive analytics, smart automation, and AI-driven insights.In this guide, we’ve gathered a list of the top 20 Excel AI tools for 2025 that are reshaping how users interact with Excel.Table of ContentBest AI Tool in Excel: Top Picks for 2025Top 10 Free Excel AI Tools in 2025Top 10 Excel AI ToolsAI in Excel: OverviewIn Excel, an AI tool (Artificial Intelligence tool) refers to an add-in or extension that leverages artificial intelligence to enhance your spreadsheet experience. These tools can automate tasks, improve data analysis, and generally make you more productive.Excel has always been a powerful tool for data analysis, but with the integration of AI tools, it has transformed into a smarter, more intuitive platform.Best AI Tool in Excel: Top Picks for 2025Explore the below AI tools designed for auto
Read More

K

How to Calculate Mean Absolute Error in Excel?

Mean absolute error is the measure of error between the observed and the expected values in a given data set. Where, O stands for Observed values,E stands for Expected values,n stands for total no. of observations. Now let us understand it with the help of an example. Example: Follow the below steps to calculate MAE in Excel: Step 1: Suppose we have the following data: Step 2: According to formulae, let's calculate the difference between the observed and the expected values. Step 3: Now let's calculate the absolute values. Step 4: Now we know from the data that n= no of observations and in this the value of n=5. And also the let's calculate the total sum of |O-E|. Step 5: Now we have the value of Sum of |O-E| and the value of n. Now according to formulae, the Mean Absolute Error is calculated as: Step 6: So the value of MAE is:
Read More

K

How to Calculate Mean Squared Error in Excel?

Mean Squared Error is defined as the mean of the square of the difference between the actual values and the expected values.Where,O = Observed value,E = Expected Value,n = No. of observationsExample:Follow the below steps to evaluate the MSE in Excel:Step 1: Suppose we are given the data in form of expected and observed value as follows:Step 2: Now let's calculate the difference between the observed and the expected value.Step 4: Now calculate the square of the difference.Step 5:  We will now calculate the sum of the squared values.Step 6: Now we have the value of the sum of squared values also we have the no. of observations i.e. 5. Now put these values in the MSE formulae and get the final result.Step 7: Now by putting the values in the formulae we get the Mean Squared Error for the given data set as 2.93294.
Read More

How to Calculate Root Mean Square Error in Excel?

In simple terms, Root mean square error means how much far apart are the observed values and predicted values on average. The formula for calculating the root-mean-square error is as follows : Where, n: number of samplesf: Forecasto: observed valuesCalculating Root Mean Square Error in Excel : Follow the below steps to calculate the root means square error in Excel: Fill up the predicted values, observed values, and differences between them in the Excel sheet.To calculate the difference, just type the formula in one cell and then just drag that cell to the rest of the cells. The difference between the cells will be calculated automatically. Then either follow STEP 3 or STEP 4 given below :Calculating the difference between the observed values and predicted valuesNow let us select one cell and apply the formula of root-mean-square error.Method 1: Formula to Calculate Root Mean Square Error (RMSE)We could have not used the difference column at all, we can directly calculate RMS error from Predicted and Observed values Columns as follows :Method 2: Formula to calculate Root Mean Square Error ( RMSE)At Last, we get the required Root Mean Square error value in the selected cell.Root mea
Read More

How to Calculate Mean Absolute Percentage Error in Excel?

article_img
In statistics, we often use Forecasting Accuracy which denotes the closeness of a quantity to the actual value of that particular quantity. The actual value is also known as the true value. It basically denotes the degree of closeness or a verification process that is highly used by business professionals to keep track records of their sales and exchanges to maintain the demand and supply mapping every year. There are various methods to calculate Forecasting Accuracy. So, one of the most common methods used to calculate the Forecasting Accuracy is MAPE which is abbreviated as Mean Absolute Percentage Error. It is an effective and more convenient method because it becomes easier to interpret the accuracy just by seeing the MAPE value. In this article, we are going to see how to calculate Mean Absolute Percentage Error, MAPE in Excel. The formula to calculate MAPE is : The above formula can be interpreted as the average value of Absolute Percentage Error (APE) of all the observations in the data set. Note: The actual value can't be zero. We can observe from the above formula that if the Actual value becomes zero, it will be undefined. Example: Consider the dataset shown below : Calcu
Read More

How to Calculate SMAPE in Excel?

article_img
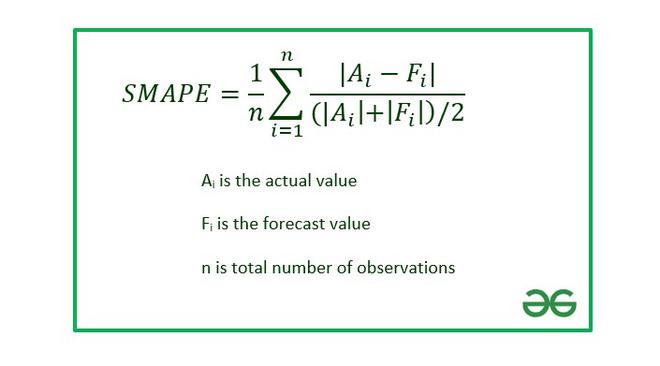
In statistics, we often use Forecasting Accuracy which denotes the closeness of a quantity to the actual value of that particular quantity. The actual value is also known as the true value. It basically denotes the degree of closeness or a verification process that is highly used by business professionals to keep track records of their sales and exchanges to maintain the demand and supply mapping every year. There are various methods to calculate Forecasting Accuracy. So, one of the most common methods used to calculate the Forecasting Accuracy is MAPE which is abbreviated as Mean Absolute Percentage Error. It is an effective and more convenient method because it becomes easier to interpret the accuracy just by seeing the MAPE value. Symmetric Mean Absolute Percentage Error abbreviated as SMAPE is also used to measure accuracy on the basis of relative errors. It is basically a prediction accuracy technique an alternative to MAPE. It is generally represented in terms of percentage (%). In this article we are going to discuss how to calculate SMAPE in Excel using a suitable example. The formula to calculate SMAPE in Excel is : The above formula gives a lower bound value of 0% and upp
Read More

How to Calculate Euclidean Distance in Excel?

article_img
Euclidean distance is the distance between two real-valued vectors. It is calculated by the square root of the sum of the squared differences of the elements in the two vectors.The formula to calculate Euclidean distance is :In this article we are going to discuss how to calculate the Euclidean distance in Excel using a suitable example.Example : Consider the dataset which consists of information about X and Y coordinates of ten points in a 2-D plane.Implementation :The functions used are :1. SUMXMY2: It finds the sum of squared differences of the elements in array X and array Y.2. SQRT: It is used to find the square root of the squared difference.The steps to calculate Euclidean distance are :1. Insert the coordinates in the Excel sheet as shown above. Column X consists of the x-axis data points and column Y contains y-axis data points.2. Write the Excel formula in any one of the cells to calculate the Euclidean distance.=SQRT(SUMXMY2(array_x,array_y))The observations in array X are stored from A2 to A11.The observations in array Y are stored from B2 to B11.3. Click on Enter.The Euclidean distance turns out to be 25.18 units approximately.It is important to note that the number of
Read More
three90RightbarBannerImg