It is a critical process that involves structuring, categorizing, and managing data to make it more accessible, usable, and analyzable. Whether in research, business, or everyday applications, well-organized data can significantly enhance efficiency and decision-making.
The importance of data organization has grown exponentially with the increasing volume of data generated in today’s digital age. By organizing data, we can ensure it is clean, accurate, and ready for analysis, leading to more informed insights and better outcomes.
What is Data Organization?
Data organization refers to the systematic arrangement of data in a structured format, making it easy to retrieve, analyze, and interpret. This process involves classifying data into various categories and organizing it into databases, spreadsheets, or other forms of storage systems. Key components of data organization include classification, categorization, and structuring. For example, in a business setting, customer data might be organized by demographics, purchase history, and engagement levels, allowing for targeted marketing efforts and personalized customer service.
For example, in a business setting, customer data might be organized by demographics, purchase history, and engagement levels, allowing for targeted marketing efforts and personalized customer service.
Now, let’s think about the term “Data” alone.
What is Data?
Data is nothing but systematically recorded values and facts about a quantity. When the data available to us is not systematic or Organized, they are known as Raw Data. Mostly, the data given to us is in form of Raw data, and systematically Organizing them may be in form of either Bar Graph, Pictograph, Double Bar graph, or any other form of visual representation is called as Organization of Raw Data.
15 people were asked about their favorite sports, these are the answers given by them,
Cricket, volleyball, tennis, cricket, cricket, tennis, badminton, volleyball, badminton, badminton, cricket, tennis, volleyball, cricket, tennis.
Need of Organizing Data
The advantages of organizing data,
Take the previous example and find out which sport is chosen by most people, the answer can be given by both raw data and organized data, but in the latter case, the time consumed to answer the question and the difficulty in answering was a lot less.
- Removes any possible errors.
In Unorganized data, the possibility of error is not zero, there can be errors either while gathering the data or while representing it, however, in Organized data, it is made sure that the data provided is completely correct and without any errors.
- Easy to understand and memorize.
Organized data are visually appealing and are very easily memorized than raw data.
Methods of Organizing Data
There are numerous methods of Organizing data, from easy and simple methods like pictograph and Tally marks to methods that can be used for complex and large data like Histograms, bar graphs, and Double bar graphs. Let’s learn about each of these methods in brief.
| Sports |
Number
Of People
|
| Cricket |
5 |
| Volleyball |
3 |
| Tennis |
4 |
| Badminton |
3 |
It is very clear that the data presented in the table form is better to understand and neat, While the raw data is hard to memorize.
The above table is hence, easier to interpret and analyze. The table is known as the Frequency Distribution Table, explaining how many times a particular data is selected.
Grouped Frequency Distribution
The term frequency in the frequency distribution table tells how many times a particular data has occurred or repeated. For example, In the example mentioned above, The number of people is the frequency, the frequency of choosing cricket as a sport is 5 while the frequency of choosing badminton as a sport is 3, and so on.
Grouped frequency distribution is used when the data is extremely large and is complex to arrange the frequency of separate data.
For instance, there are 20 students in a class and all of them took a maths test out of 100. All of them passed the test, Following are the marks obtained by them,
35, 31, 80, 44, 50, 67, 89, 40, 45, 66, 71, 86, 56, 59, 69, 67, 82, 92, 43, 57.
Since forming the table for all the data will provide a very large table, It is better to group them separately and then write the frequency for the respective group.
Let’s make group of 10 marks starting from 30-40, 40-50, 50-60, 60-70, 70-80, 80-90, 90-100.
| Marks in group |
Number of students |
| 30-40 |
3 |
| 40-50 |
4 |
| 50-60 |
3 |
| 60-70 |
3 |
| 70-80 |
2 |
| 80-90 |
4 |
| 90-100 |
1 |
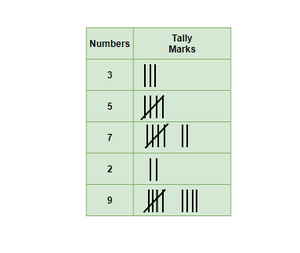
Tally Marks
Tally is the easiest way of understanding numbers and simply marking them in groups. For 1 – 1 mark, for 2- 2marks, for 3- 3marks, for 4 – 4 marks, for 5- cross 4 marks to represent number 5, repeat the same for more numbers.
Below given table explains how tally marks are represented,
Pictograph
Representing given information in form of Pictures so that the data is in visual form and also easy to understand is a Pictograph. Pictographs can be called the earliest form of not only presenting certain data but also a way of communication when languages were not discovered, the only disadvantage of pictographs is that it is not advised to use when the information is too large and complex since explaining everything in pictures will be tedious.
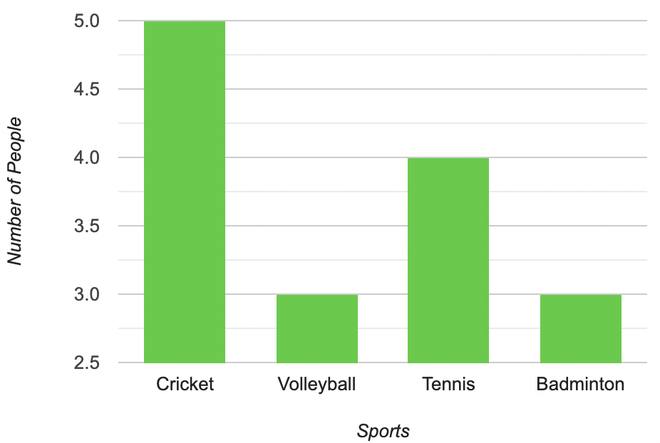
Bar Graph
A graphical way of representing data with long bars, the length of the bars is decided by the frequency of each data. Bar graph are the most commonly used method of organizing data as it helps in identifying the relative size of the data easily and even large amount of data can be fitted in a bar graph with the help of scaling.
Example:
Represent the following table in form of a Bar Graph,
| Sports |
Number
Of People
|
| Cricket |
5 |
| Volleyball |
3 |
| Tennis |
4 |
| Badminton |
3 |
Double Bar Graph
Suppose there are two sets of data that are related to each other and in order to represent two sets of data, two bar graphs are not necessarily required, instead of two separate bar graphs, a double bar graph is suggested in such a case. A Double Bar graph is better since the two separate quantities can be compared very easily. For example, a person is keeping a record of the distance he cycles on his bicycle every day, and he wants to see his improvement in two separate weeks, a double graph for two weeks can be represented for the same.
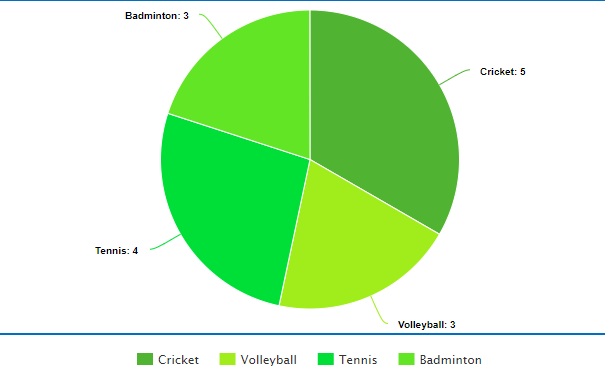
It is a pictorial representation of data on a circle, the circle disc is known as a Pie as it is in the same shape. The slices on the pie tell the amount of data for each category. The proportional or relative data is best represented on a pie chart as the entire data is easily comparable.
Example,
Represent the following data on a pie chart,
| Sports |
Number
Of People
|
| Cricket |
5 |
| Volleyball |
3 |
| Tennis |
4 |
| Badminton |
3 |
The Pie chart for the above table,
Sample Problems on Data Organization
Question 1: In a span of 3 weeks, a man decides to keep a check on his health and run every morning, he ran each morning and then made a grouped frequency distribution table, the kilometers covered by him are mentioned below, Make the table for the same.
3km, 3.5km, 5km, 4.8km, 6km, 5km, 6.1km, 4km, 5.9km, 7km, 7.2km, 6.3km, 6.8km, 7.1km, 8km, 6.5km, 8.1km, 8.8km, 7.4km, 6.9km, 8.1km,
Solution:
The Grouped Frequency distribution when the groups are divided as, 2-4km, 4-6km, 6-8km, 8-10km shall look like,
| Kilometers Covered |
Number of days |
| 2-4km |
2 |
| 4-6km |
5 |
| 6-8km |
10 |
| 8-10km |
4 |
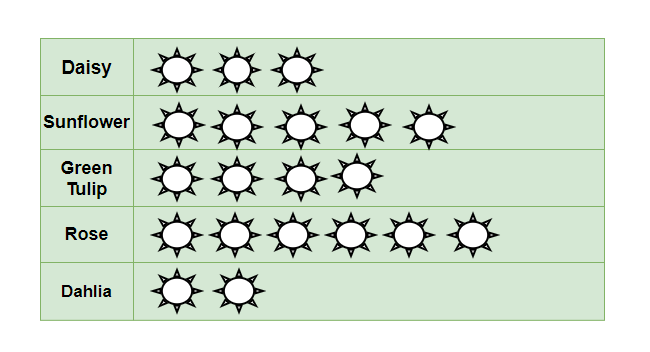
Question 2: In a Garden, there are 5 different types of flower plants, there are 3 plants of daisy, 5 plants of sunflower, 4 plants of green tulip, 6 plants of rose, 2 plants of dahlia. Make a Pictograph for the above data.
Solution:
The Pictures that represents the number of plants in the garden,
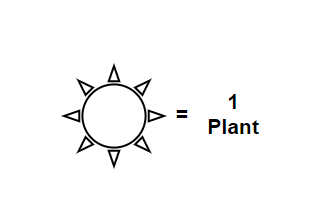
The Pictograph for the data given in question is,
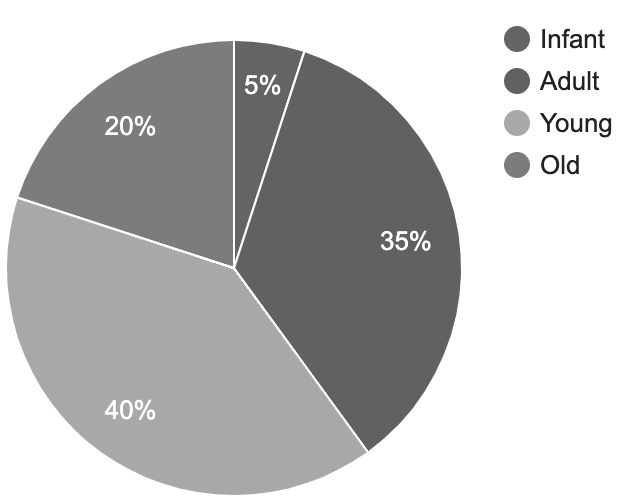
Question 3: Draw a Pie chart for the following data taken from a village, the information is regarding different age groups and in what percentage they are present in the village.
| Villagers age |
Relative population in percentage |
| Infant |
5 % |
| Adult |
35 % |
| Young |
40 % |
| Old |
20 % |
Solution:
The Pie Chart for the above data,
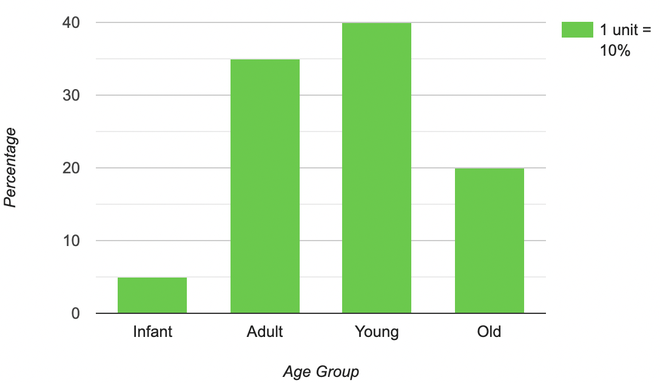
Question 4: Make a Bar Graph for the data obtained from a village in order to obtain information about their age and in what proportional different categories are present.
| Villagers age |
Relative population in percentage |
| Infant |
5 % |
| Adult |
35 % |
| Young |
40 % |
| Old |
20 % |
Solution:
The Bar Graph for the Table given above,
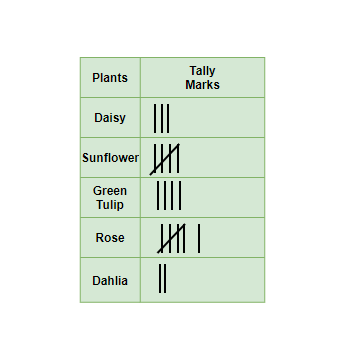
Question 5: Draw Tally Marks for the data obtained about the Number of Plants in a Garden,
Daisy- 3, sunflower- 5, Green Tulip- 4, Rose- 6, Dahlia- 2
Solution:
The Tally Marks For the above data,
Related Articles:
Data organization Practice Questions
1. What are the different types of data structures used for organizing data?
2. Explain the differences between linear and non-linear data structures.
3. How do arrays and linked lists differ in terms of data organization and memory allocation?
4. What are the advantages and disadvantages of using a binary search tree (BST) for data organization?
5. How does a hash table organize data, and what are its common use cases?
6. Describe the process of organizing data using a stack and provide an example of its application.
7. What is a queue, and how is data organized within it? Illustrate with an example.
8. Explain the concept of a graph in data organization and its types (directed and undirected).
9. How do heaps organize data, and what are their primary use cases?
10. What is a trie, and how is it used to organize and search data efficiently?
11. Compare and contrast the organization of data in a singly linked list versus a doubly linked list.
12. How does data organization in a B-tree differ from that in a binary search tree?
13. What are the main principles of organizing data in a database, and how do they ensure efficient data retrieval?
14. Explain the role of normalization in organizing data within a relational database.
15. How does data organization in NoSQL databases differ from traditional relational databases?
16. What are the common strategies for organizing data in a file system?
17. How does data compression impact data organization and retrieval?
18. Describe the importance of indexing in data organization and provide examples of indexing methods.
19. How is data organized in a hierarchical data model, and what are its advantages and disadvantages?
20. What are the key considerations for organizing data in a cloud storage system?
Conclusion
In conclusion, data organization is a fundamental process that enhances the accessibility, usability, and analyzability of data. By adopting best practices and leveraging advanced tools, businesses and researchers can overcome challenges and make the most of their data. As technology evolves, data organization will continue to play a crucial role in driving informed decisions and achieving better outcomes.
What is Data Organization- FAQs
What is data organization?
Data organization involves structuring and categorizing data to make it more accessible and usable.
Why is data organization important?
It enhances data accessibility, improves analysis efficiency, and facilitates better decision-making.
What are the different types of data organization?
Hierarchical, network, relational, and object-oriented are the primary types.
Excel, Google Sheets, ATLAS.ti, and other specialized software.
How can businesses benefit from data organization?
Organized data helps in efficient operations, better customer targeting, and informed decision-making.
Similar Reads
CBSE Class 8th Maths Notes
CBSE Class 8th Maths Notes cover all chapters from the updated NCERT textbooks, including topics such as Rational Numbers, Algebraic Expressions, Practical Geometry, and more. Class 8 is an essential time for students as subjects become harder to cope with. At GeeksforGeeks, we provide easy-to-under
15+ min read
Chapter 1: Rational Numbers
Rational Numbers
A rational number is a type of real number expressed as p/q, where q ≠0. Any fraction with a non-zero denominator qualifies as a rational number. Examples include 1/2, 1/5, 3/4, and so forth. Additionally, the number 0 is considered a rational number as it can be represented in various forms such a
9 min read
Natural Numbers | Definition, Examples & Properties
Natural numbers are the numbers that start from 1 and end at infinity. In other words, natural numbers are counting numbers and they do not include 0 or any negative or fractional numbers. For example, 3, 6, 57, 973, 4000, and so on. Natural numbers are the counting numbers: 1, 2, 3, 4, 5, and so on
11 min read
Whole Numbers - Definition, Properties and Examples
Whole numbers are a foundational concept in mathematics, encompassing all non-negative integers starting from zero. This set includes numbers like 0, 1, 2, 3, and so on, up to infinity. Unlike integers, whole numbers do not include negative numbers or fractions. Examples of Whole Numbers are 0, 2, 3
9 min read
Integers | Definition, Examples & Types
The word integer originated from the Latin word “Integer†which means whole or intact. Integers are a special set of numbers comprising zero, positive numbers, and negative numbers. So, an integer is a whole number (not a fractional number) that can be positive, negative, or zero. Examples of intege
9 min read
Rational Numbers
Rational numbers are a fundamental concept in mathematics, defined as numbers that can be expressed as the ratio of two integers, where the denominator is not zero. Represented in the form p/q​ (with p and q being integers), rational numbers include fractions, whole numbers, and terminating or repea
15+ min read
Representation of Rational Numbers on the Number Line | Class 8 Maths
Rational numbers are the integers p and q expressed in the form of p/q where q>0. Rational numbers can be positive, negative or even zero. Rational numbers can be depicted on the number line. The centre of the number line is called Origin (O). Positive rational numbers are illustrated on the righ
5 min read
Rational Numbers Between Two Rational Numbers | Class 8 Maths
Real numbers are categorized into rational and irrational numbers respectively. Given two integers p and q, a rational number is of the form p/q, where q > 0. A special case arises when q=1 and the rational number simply becomes an integer. Hence, all integers are rational numbers, equal to p. Th
6 min read
Chapter 2: Linear Equations in One Variable
Algebraic Expressions in Math: Definition, Example and Equation
Algebraic Expression is a mathematical expression that is made of numbers, and variables connected with any arithmetical operation between them. Algebraic forms are used to define unknown conditions in real life or situations that include unknown variables. An algebraic expression is made up of term
8 min read
Linear Equations in One Variable
Linear equation in one variable is the equation that is used for representing the conditions that are dependent on one variable. It is a linear equation i.e. the equation in which the degree of the equation is one, and it only has one variable. A linear equation in one variable is a mathematical sta
7 min read
Linear Equations in One Variable - Solving Equations which have Linear Expressions on one Side and Numbers on the other Side | Class 8 Maths
Linear equation is an algebraic equation that is a representation of the straight line. Linear equations are composed of variables and constants. These equations are of first-order, that is, the highest power of any of the involved variables i.e. 1. It can also be considered as a polynomial of degre
4 min read
Solving Linear Equations with Variable on both Sides
Equations consist of two main components: variables and numbers. Understanding the relationship between these components and how to manipulate them is essential for solving equations. Variable: A variable is a symbol (often a letter like x, y, or z) that represents an unknown or changing quantity.Nu
6 min read
Reducing Equations to Simpler Form | Class 8 Maths
Reducing equations is a method used to simplify complex equations into a more manageable form. This technique is particularly useful when dealing with non-linear equations, which cannot always be solved directly. By applying specific mathematical operations, such as cross-multiplication, these equat
7 min read
Equations Reducible to Linear Form
Equations Reducible to Linear Form" refers to equations that can be transformed or rewritten into a linear equation. These equations typically involve variables raised to powers other than 1, such as squared terms, cubed terms, or higher. By applying suitable substitutions or transformations, these
9 min read
Chapter 3: Understanding Quadrilaterals
Types of Polygons
Types of Polygons classify all polygons based on various parameters. As we know, a polygon is a closed figure consisting only of straight lines on its edges. In other words, polygons are closed figures made up of more than 2 line segments on a 2-dimensional plane. The word Polygon is made up of two
9 min read
Triangles in Geometry
A triangle is a polygon with three sides (edges), three vertices (corners), and three angles. It is the simplest polygon in geometry, and the sum of its interior angles is always 180°. A triangle is formed by three line segments (edges) that intersect at three vertices, creating a two-dimensional re
13 min read
Quadrilaterals
Quadrilateral is a two-dimensional figure characterized by having four sides, four vertices, and four angles. It can be broadly classified into two categories: concave and convex. Within the convex category, there are several specific types of quadrilaterals, including trapezoids, parallelograms, re
12 min read
Area of Pentagon
Area of Pentagon or the area of any polygon is the total space taken by that geometric object. In geometry area and perimeter are the most fundamental quantities of measurement after the side. In general, we study two types of shapes in geometry one is flat shapes(2-D Shapes) and other solid shapes
7 min read
Sum of Angles in a Polygon
Polygon is defined as a two-dimensional geometric figure that has a finite number of line segments connected to form a closed shape. The line segments of a polygon are called edges or sides, and the point of intersection of two edges is called a vertex. The angle of a polygon is referred to as the s
11 min read
Exterior Angles of a Polygon
Polygon is a closed, connected shape made of straight lines. It may be a flat or a plane figure spanned across two-dimensions. A polygon is an enclosed figure that can have more than 3 sides. The lines forming the polygon are known as the edges or sides and the points where they meet are known as ve
6 min read
Trapezium in Maths | Formulas, Properties & Examples
A trapezium or Trapezoid is a four-sided quadrilateral with one pair of parallel sides, called the bases, and the other two non-parallel sides called the legs. The term "trapezium" comes from the Greek word "trapeze," meaning "table."It is a two-dimensional shape with four sides and four vertices. T
8 min read
Kite - Quadrilaterals
A Kite is a special type of quadrilateral that is easily recognizable by its unique shape, resembling the traditional toy flown on a string. In geometry, a kite has two pairs of adjacent sides that are of equal length. This distinctive feature sets it apart from other quadrilaterals like squares, re
8 min read
Parallelogram | Properties, Formulas, Types, and Theorem
A parallelogram is a two-dimensional geometrical shape whose opposite sides are equal in length and are parallel. The opposite angles of a parallelogram are equal in measure and the Sum of adjacent angles of a parallelogram is equal to 180 degrees. A parallelogram is a four-sided polygon (quadrilate
10 min read
Properties of Parallelograms
Properties of Parallelograms: Parallelogram is a quadrilateral in which opposite sides are parallel and congruent and the opposite angles are equal. A parallelogram is formed by the intersection of two pairs of parallel lines. In this article, we will learn about the properties of parallelograms, in
9 min read
Rhombus: Definition, Properties, Formula and Examples
A rhombus is a type of quadrilateral with the following additional properties. All four sides are of equal length and opposite sides parallel. The opposite angles are equal, and the diagonals bisect each other at right angles. A rhombus is a special case of a parallelogram, and if all its angles are
7 min read
Square in Maths - Area, Perimeter, Examples & Applications
A square is a type of quadrilateral where all four sides are of equal length and each interior angle measures 90°. It has two pairs of parallel sides, with opposite sides being parallel. The diagonals of a square are equal in length and bisect each other at right angles.Squares are used in various f
6 min read
Chapter 4: Practical Geometry
Chapter 5: Data Handling
Data Handling
Data Handling: Nowadays, managing and representing data systematically has become very important especially when the data provided is large and complex, This is when Data Handling comes into the picture. Data handling involves the proper management of research data throughout and beyond the lifespan
12 min read
What is Data Organization?
It is a critical process that involves structuring, categorizing, and managing data to make it more accessible, usable, and analyzable. Whether in research, business, or everyday applications, well-organized data can significantly enhance efficiency and decision-making. The importance of data organi
10 min read
Frequency Distribution - Table, Graphs, Formula
Frequency Distribution is a tool in statistics that helps us organize the data and also helps us reach meaningful conclusions. It tells us how often any specific values occur in the dataset. A frequency distribution in a tabular form organizes data by showing the frequencies (the number of times val
12 min read
Pie Chart
Pie chart is a popular and visually intuitive tool used in data representation, making complex information easier to understand at a glance. This circular graph divides data into slices, each representing a proportion of the whole, allowing for a clear comparison of different categories making it ea
11 min read
Chance and Probability
Chance is defined as the natural occurrence of any event without any interference, we can also say that the possibility of any event is the chance of the event, and mathematically we define the chance as the probability of an event. Probability refers to the likelihood of the occurrence of an event.
9 min read
Random Experiment - Probability
In a cricket match, before the game begins. Two captains go for a toss. Tossing is an activity of flipping a coin and checking the result as either “Head†or “Tailâ€. Similarly, tossing a die gives us a number from 1 to 6. All these activities are examples of experiments. An activity that gives us a
12 min read
Probability in Maths
Probability is a field of mathematics that deals with events and quantifies their likelihood of occurring with numerical values ranging from 0 to 1. Higher probabilities indicate a greater chance of the event happening. It is mainly a ratio between the given event and the total number of events. Wha
3 min read
Chapter 6: Squares and Square Roots
Chapter 7: Cubes and Cube Roots
Chapter 8: Comparing Quantities
Ratios and Percentages
Ratios and Percentages: Comparing quantities is easy, each of the quantities is defined to a specific standard and then the comparison between them takes place after that. Comparing quantities can be effectively done by bringing them to a certain standard and then comparing them related to that spec
7 min read
Fractions - Definition, Types and Examples
Fractions are numerical expressions used to represent parts of a whole or ratios between quantities. They consist of two numbers separated by a horizontal line called a vinculum, where the number above the line is called the 'Numerator' and the number below the line is called the 'Denominator'. Exam
6 min read
Percentage
In mathematics, a percentage is a figure or ratio that signifies a fraction out of 100 i.e., A fraction whose denominator is 100 is called a Percent i.e. in all the fractions where the denominator is 100 we can remove the denominator and put the % sign. For example, the fraction 23/100 can be writte
5 min read
Discount Formula
Discount in Mathematics is defined as the reduction in price of any service and product. Discount is offered by the business owner to easily and quickly sell their product or services. Giving discounts increases the sales of the business and helps the business retain its customer. Discount is always
9 min read
Sales Tax, Value Added Tax, and Goods and Services Tax - Comparing Quantities | Class 8 Maths
Tax is a mandatory fee levied by the government to collect revenue for public works providing the best facilities and infrastructure. The first known Tax system was in Ancient Egypt around 3000–2800 BC, in First Dynasty of Egypt. The first form of taxation was corvée and tithe. In India, The Tax was
6 min read
Simple Interest
Simple Interest (SI) is a method of calculating the interest charged or earned on a principal amount over a fixed period of time. It is calculated based solely on the principal amount, which remains unchanged throughout the calculation. Simple Interest is widely used across industries such as bankin
8 min read
Compound Interest | Class 8 Maths
Compound Interest: Compounding is a process of re-investing the earnings in your principal to get an exponential return as the next growth is on a bigger principal, following this process of adding earnings to the principal. In this passage of time, the principal will grow exponentially and produce
9 min read
Compound Interest
Compound Interest is the interest that is calculated against a loan or deposit amount in which interest is calculated for the principal as well as the previous interest earned. Compound interest is used in the banking and finance sectors and is also useful in other sectors. A few of its uses are: Gr
9 min read
Chapter 9: Algebraic Expressions and Identities
Algebraic Expressions and Identities
An algebraic expression is a mathematical phrase that can contain numbers, variables, and operations, representing a value without an equality sign. Whereas, algebraic identities are equations that hold true for all values of the variables involved. Learning different algebraic identities is crucial
9 min read
Types of Polynomials (Based on Terms and Degrees)
Types of Polynomials: In mathematics, an algebraic expression is an expression built up from integer constants, variables, and algebraic operations. There are mainly four types of polynomials based on degree-constant polynomial (zero degree), linear polynomial ( 1st degree), quadratic polynomial (2n
9 min read
Like and Unlike Algebraic Terms: Definition and Examples
Like terms are terms in algebraic expressions that have the same variables raised to the same powers. Like and Unlike Terms are the types of terms in algebra, and we can differentiate between like and unlike terms by simply checking the variables and their powers. We define algebraic terms as the in
7 min read
Mathematical Operations on Algebraic Expressions - Algebraic Expressions and Identities | Class 8 Maths
The basic operations that are being used in mathematics (especially in real number systems) are addition, subtraction, multiplication and so on. These operations can also be done on the algebraic expressions. Let us see them in detail. Algebraic expressions (also known as algebraic equations) are de
5 min read
Multiplying Polynomials
Polynomial multiplication is the process of multiplying two or more polynomials to find their product. It involves multiplying coefficients and applying exponent rules for variables. When multiplying polynomials: Multiply the coefficients (numerical values).Multiply variables with the same base by a
8 min read
Standard Algebraic Identities
Algebraic Identities are algebraic equations that are always true for every value of the variable in them. The algebraic equations that are valid for all values of variables in them are called algebraic identities. It is used for the factorization of polynomials. In this way, algebraic identities ar
7 min read