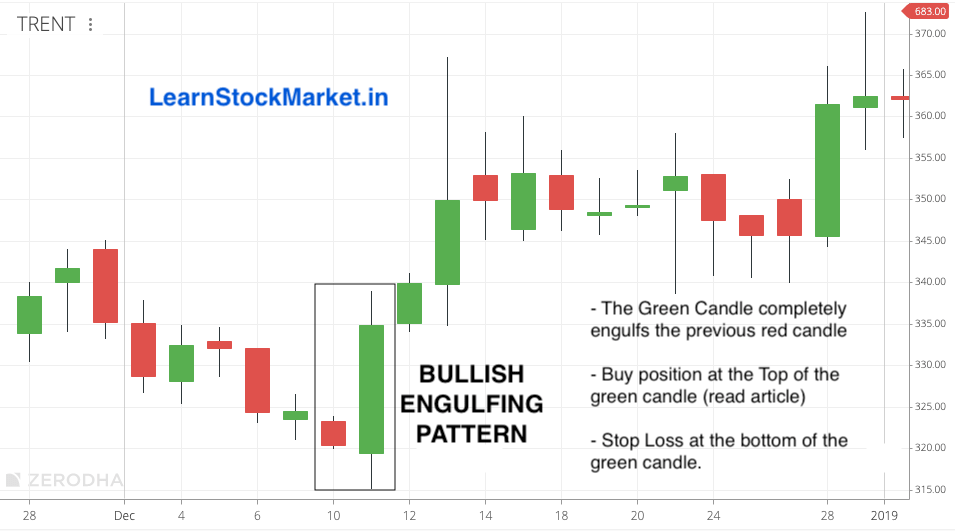
The ‘Bullish Engulfing’ is a two-candle pattern. The first candle will be smaller and red in colour. The second candle will engulf (entirely cover) the previous candle. It’ll be green and much larger in size.

Characteristics of Bullish Engulfing
- The first candle in the pattern is of less importance. It’s usually small and red in colour. A red candle means, the price has fallen.
- The formation of the second candle is of utmost importance and this decides whether it’s a ‘Bullish Engulfing Pattern’.
- The price opens lower than the first candle. It could fall further down. This is when smart buyers find value in the stock. The demand to buy increases and the price goes up significantly.
- On the chart, it would look like the green candle has completely engulfed the previous candle.
For example, let’s say HDFC Bank opens at ₹ 2000 on the first day and closes at ₹ 1950. The price has fallen, hence a red candle has formed on the chart.
On the second day, due to fear of the price falling even lower, there are more sellers in the morning. The price opens at ₹ 1925, which is a gap down opening and falls further to ₹ 1900.
This is when the smart investors begin to see value in the stock. It could be some mutual fund or foreign investors. They buy in big quantity.
The price shoots up. It goes to ₹ 2150 on increased demand and closes at ₹ 2100.
This price action on the second day, forms a huge green candle on the chart.
The combination of a small red candle, together with a big green candle is called ‘Bullish Engulfing’ pattern.
Psychology of Bullish Engulfing Pattern
As the name itself suggests, the ‘Bullish Engulfing’ is an extremely bullish pattern.
Its formation on the chart suggests the price at lower levels has been rejected and the subsequent rise in price is due to heavy buying.
It also suggests that the bulls (buyers) have comprehensively beaten the bears (sellers).
How traders use Bullish Engulfing Pattern
The ‘Bullish Engulfing’ pattern signals a trend reversal in the upward direction. However, when the ‘Bullish Engulfing’ pattern occurs on the charts, some traders wait for confirmation.
If the next candle, after the ‘Bullish Engulfing’ opens in green, then the stock is purchased and the stop loss is the low of the ‘Bullish Engulfing’ Candle.
Some traders take position at the closing price of the ‘Bullish Engulfing’ and keep the opening price as the Stop Loss.
The example below should help you understand how to execute your ‘Bullish Engulfing’ trade.

The chart above is of a TATA company called ‘Trent’. They run retail clothing stores called ‘West Side’ and ‘Zudio’.
In December 2018, the stock formed a massive ‘Bullish Engulfing’ pattern on the daily chart.
How a trader could’ve executed the ‘Trent’ trade based on the above chart:
- The ‘Red’ candle was formed on December 10th 2018.
- The ‘Bullish Engulfing’ candle was formed on December 11th.
- A trader could’ve bought the stock at ₹ 335 i.e closing price of the ‘Bullish Engulfing’ on December 11th itself.
- Or the trader could’ve waited for the confirmation on the next day. The price opened at the same level as previous close i.e ₹ 335.
- The stop loss would be around ₹ 320 i.e opening price of the ‘Bullish Engulfing’.
If a trader had executed the above trade and not booked profit, he would still be holding the stock.
The current market price more than a year later is ₹ 700 per share.
The bottom of the ‘Bullish Engulfing’ – which is also the stop loss – has never been broken on the downside.
Different people have different trading strategies. Most traders who solely use ‘Bullish Engulfing’, without looking at other technical setups, will look to book profits within a few days.

Leave a Comment