Abstract
Automatic aorta segmentation in thoracic computed tomography (CT) scans is important for aortic calcification quantification and to guide the segmentation of other central vessels. We propose an aorta segmentation algorithm consisting of an initial boundary detection step followed by 3D level set segmentation for refinement. Our algorithm exploits aortic cross-sectional circularity: we first detect aorta boundaries with a circular Hough transform on axial slices to detect ascending and descending aorta regions, and we apply the Hough transform on oblique slices to detect the aortic arch. The centers and radii of circles detected by Hough transform are fitted to smooth cubic spline functions using least-squares fitting. From these center and radius spline functions, we reconstruct an initial aorta surface using the Frenet frame. This reconstructed tubular surface is further refined with 3D level set evolutions. The level set framework we employ optimizes a functional that depends on both edge strength and smoothness terms and evolves the surface to the position of nearby edge location corresponding to the aorta wall. After aorta segmentation, we first detect the aortic calcifications with thresholding applied to the segmented aorta region. We then filter out the false positive regions due to nearby high intensity structures. We tested the algorithm on 45 CT scans and obtained a closest point mean error of 0.52 ± 0.10 mm between the manually and automatically segmented surfaces. The true positive detection rate of calcification algorithm was 0.96 over all CT scans.
I. INTRODUCTION
Automatic aorta segmentation in thoracic computed tomography (CT) scans is important for the assessment of cardiovascular risk factors based on aortic calcification quantification. Radiotheraphy planning is another application for which automated segmentation of mediastinum structures including aorta is important. The aorta is a major vessel in the mediastinum and can be used as a landmark to guide segmentation of other mediastinum structures such as esophagus [1], heart, and other major vessels such as pulmonary veins and arteries [6]. Measurements of volume and cross sectional areas of these vessels can be a potentially important biomarkers to understand cardiovascular and pulmonary diseases as well as interdependencies of these diseases.
In non-contrast CT, aorta segmentation is not trivial, since at some locations, there is no clear boundary between aorta and surrounding mediastinum structures that has similar intensity ranges. To address this difficulty, most algorithms developed for non-contrast CT ([3], [4], [7], [6]) use model based approaches and need a priori models built from manually segmented training data. However, these approaches might fail since they have limited flexibility to capture variabilities. Instead of building models from training set, we construct an initial model from the current data. To construct a good initial model of aorta boundary in 3D, we adapt some ideas from [3] and [4]. We use sequential hough transform based circle detection followed by least squares spline fitting to obtain the aorta centerline and radius functions in 3D. From the centerline and radius functions, we reconstruct an initial tubular aorta surface using the Frenet frame [9], [8].
After this initialization step, we use a different approach from previous work for the refinement of the aorta segmentation. In [3], [4], the initial centerline is refined by fitting it to the likelihood image from the distance transform. Aorta surface is then reconstructed with the inverse distance transform. Instead of refining the centerline position, in this work, we refine the initial aorta surface position. We evolve the initial boundary surface to the location of edges. This evolution is performed in 3D with a level set algorithm based on standard gradient and smoothness terms and a distance regularization term [10], [11], [5] to restore the regularity of evolving level set function. For some regions, where edges are partially missing, 3D smoothness constraint stops leakage locally. This approach works very well for fine-tuning given a good initialization of the boundary surface.
The main contributions of this work are two-fold: first, we propose a fully automated and unsupervised 3D aorta segmentation algorithm which is an extension of previous work. Second, using the segmented aorta as the region of interest, we detect aortic calcification. To do so, we first apply thresholding to the region inside the aorta wall and then perform 3D region growing to discard small regions detected due to noise. True calcifications are then separated from nearby high density regions, false positives, with a filtering approach based on anatomical position of detected candidate calcification region with respect to nearby high density structure. False positives are often regions of vertebra close to descending aorta, or regions of aortic arch close to tracheal calcifications. Some examples of these regions were reported in [2], where an atlas based approach is used for aorta segmentation. Since the atlas based approach is not very accurate, some false positive calcifications are detected in different locations. True calcifications are then selected with a classification approach.
We tested our aorta segmentation and calcification detection algorithm on 45 CT scans acquired from a cohort of smokers with a range of expiratory airflow obstruction. The results are reported in comparison to manual expert labellings.
II. METHODS
A. Preprocessing
In order to reduce the search region and reduce computational costs, we first crop a smaller volume of interest (VOI). To determine the VOI boundaries, we segment the lungs and trachea only to use them as anatomical landmarks [3].
For trachea and lung segmentation, the first step is obtaining seed points for the region growing algorithms. To get those seed points, we detect the lungs and trachea in the convex hull of the lungs in a slice (the upper third slice of the volume) with thresholding followed by connected components labelling in 2D. The trachea is selected as the largest component within the lung convex hull. The center of the detected trachea is used as a seed point for a 3D region growing algorithm to segment the trachea in a small VOI around that seed point. This VOI is initially set small (60 × 40mm) in anterior-posterior and mediolateral directions to speed up the 3D region growing. The initial VOI is enlarged iteratively until the detected trachea region includes the trachea carina. Similarly the left and right lungs are segmented with 3D region growing applied on down-sampled and cropped volume given the seed location obtained from the initial slice. The lung bounding box is then calculated as in [3].
B. Initial Boundary Surface Construction
Our approach exploits the almost circular cross sections of descending (DA) and ascending aorta (AA) in axial slices and the half torus shape of aortic arch. Previous work [4] also utilize this information to detect these circles using circular Hough transform. We adapt the method described in Feuerstein et. al [3]. We sequentially detect circles in axial slices starting from the slice of trachea carina (TC) and moving in the inferior direction. For the aortic arch, we first reconstruct oblique slices along the half torus shape of the aortic arch and detect circles in those oblique slices. In contrast to previous approach, we detect circles in finely sampled slices (every other slice). The reason is that when a circle is not detected in one slice, it may be detected in the next, and the missing slice can be filled in later during spline fitting step.
We start the circle detection process from the axial slice of the TC. Circular Hough transform is applied in this slice to locate the AA and DA. To select the circles corresponding to DA and AA, we first filter detected circles according to their relative positions with respect to TC. Next we select from the remaining candidate circles (Ci), the one that maximize an energy function:
| (1) |
where Rint is the intensity term, calculated as the ratio of the number of pixels inside the circle that are within the aorta intensity range (in HU) to the total number of pixels inside the circle and RHT is the Hough Transform value term which is equal to the value of that circle in the Hough map indicating the strength of that circle.
For AA, we use two criteria to eliminate incorrect circles. Circles with a radius smaller than rthresh are eliminated. Also, the circles which are to the posterior or to the right of TC are eliminated. From the remaining candidate AA circles the one that maximizes R(Ci) is selected as AA. The circle that corresponds to DA is found similarly using the same energy function after eliminating the circles that are inferior to the carina.
To detect aortic arch, we follow the approach in [4]. We reconstruct oblique slices with three degree steps along the half torus shape of the aortic arch. In each oblique slice we sequentially detect circles that maximizes the same energy function and that are within Δr radius and Δd distance to the one obtained from the previous slice.
After detecting the circular cross sections of the aortic arch in oblique slices, we detect the DA and AA in axial slices, starting from the slice of TC and moving in inferior direction, using a similar sequential approach. AA circle detection stops when no AA circle is detected in five consecutive slices, which corresponds to the inferior endpoint of AA. DA is detected using the similar sequential detection approach.
Due to partial or complete lack of edges of aorta, circles cannot be detected in some slices. We skip those slices and continue, unless no circle is detected in five consecutive slices. We recover these missing circles in the next step. We applied a least squares spline fitting in 3D to the center and radii function of the detected circles. Given these centerline and radius functions, a 3D tubular aorta surface is constructed using a Frenet frame making the tube minimally twisted [8], [9]. This surface is the initial boundary surface of the aortic wall, which will be fine-tuned by 3D evolution in the following step.
C. Segmentation Refinement using 3D Level Sets
After the initial model is constructed, a 3D level set segmentation is performed to evolve the initial boundary surface to the nearby edge locations while keeping the shape smooth in 3D. In level set approaches, contours are represented implicitly as the (zero) level line of some embedding level set function (Φ). An energy function including image based information such as image intensity and gradient (edges) as well as internal regularization constraints are designed and minimized for 3D segmentation within a variational optimization framework. The initial surface is evolved so as to minimize the energy function.
We use the level set energy function (E in Eqn. 2) including standard energy terms: edge matching Eedge, level set regularization Ereg [5] and smoothness (length) Esm terms [11].
| (2) |
Here δ(.) is the Dirac function of Φ and g(.) is the edge indicator function in [5] and I is the CT volume. The initial level set function representing the aorta boundary is updated at each step t to minimize E according to following update equation:
| (3) |
Zero level set of the final Φ gives us the aorta wall.
D. Detection of Aortic Calcifications
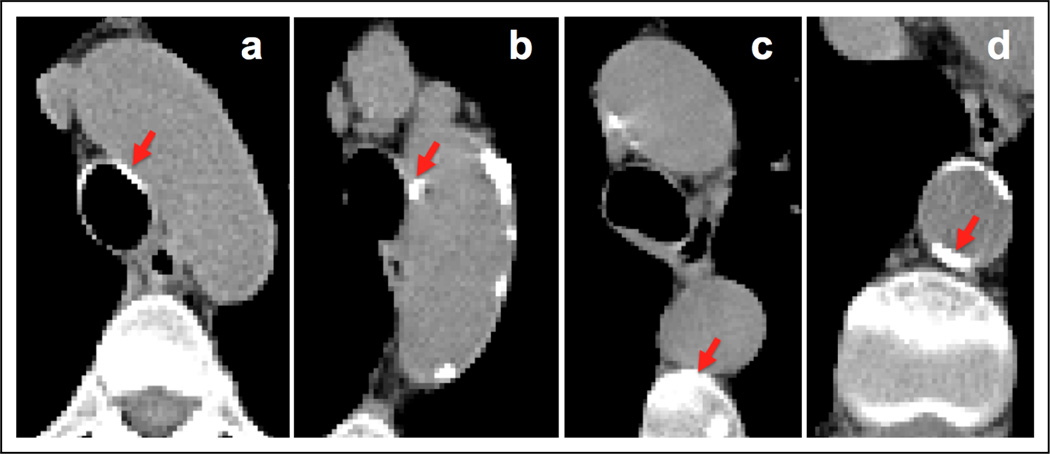
After aorta segmentation, we detect the aortic calcifications by first applying a threshold (130 HU [2]) to segmented aorta volume. Although the mean error of the automated aorta segmentation is quite small, we dilate the boundary of segmented aorta by 2 voxels to make sure that the true boundary of aorta is included in the segmented region. In order to remove the false positive calcification regions that are due to nearby high density regions we use an additional selection process. The most frequent false positive regions are those where DA is close to the vertebra and where the aortic arch is close to the tracheal calcifications (See Fig. 1). For the vertebra, we use a region growing algorithm in 2D to determine if the candidate calcified regions are growing towards vertebra and eliminate the ones whose areas grow too large towards vertebra direction. For the trachea, we eliminate candidate 3D connected component whose pixels are located around the trachea boundary.
Fig. 1.
Examples of regions that are true calcifications (b and d) and false positives (a and c) after thresholding step. The algorithm further processes these regions and rejects the false positives.
III. RESULTS
We report experiments using thoracic CT scans (with in plane resolution between 0.53 to 0.94 mm and slice thickness between 0.50 and 0.70 mm ) from 45 subjects obtained from 16 different institutions with different scanners and similar acquisition protocol. We report the results in comparison to the manually segmented aorta in all data sets. The algorithm parameters are set to be 3 for Δr, and 5mm for Δd, 8.5 mm for rthresh, 0.04 for λ and 0.2 for ν.
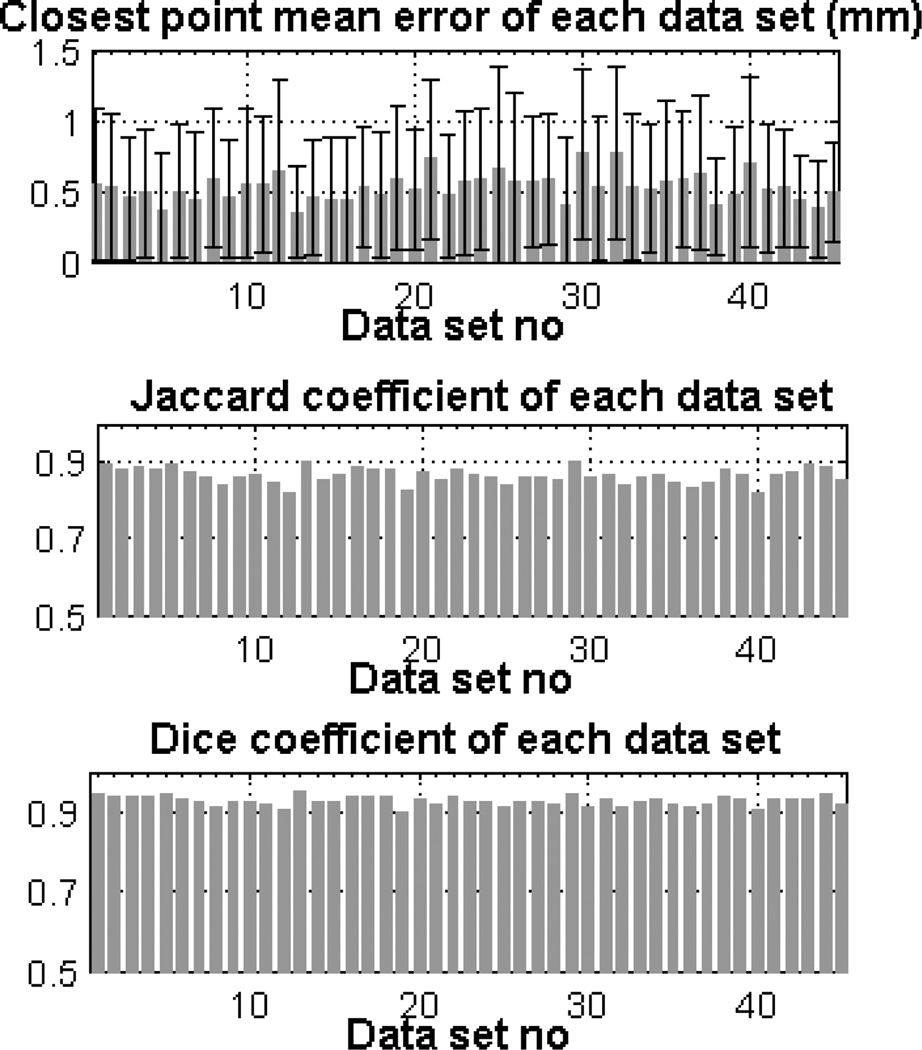
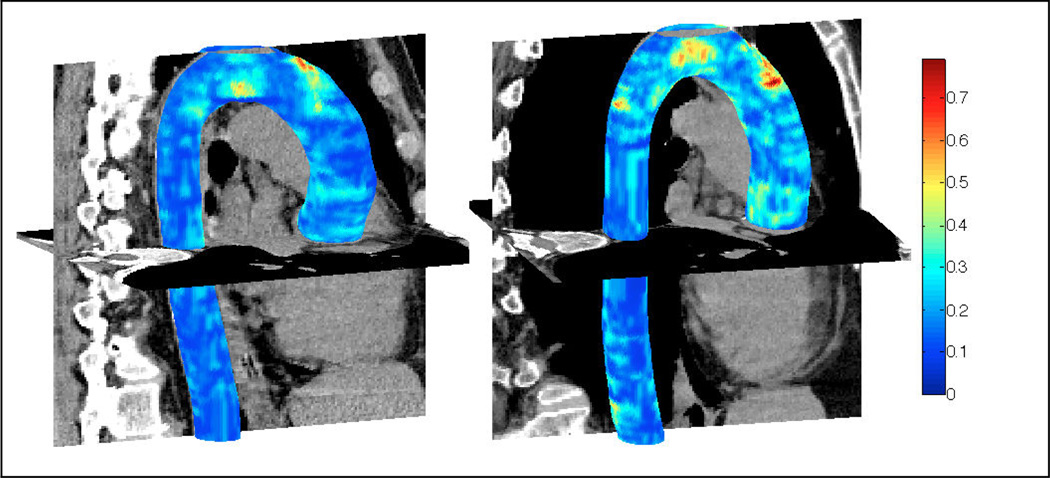
We use the following point-wise distance metric to evaluate the results of the aorta segmentation algorithm. The minimum euclidean distance between the points on the surface segmented by the algorithm and the points on the surface labelled manually are computed. We obtained a point-wise mean error of 0.52 ± 0.10 mm over all data sets for the entire aorta including aortic arch, AA and DA. We obtained a mean error of 0.51±0.33 mm over DA and 0.64±0.16 mm over AA. We also calculated other measures of performance including mean dice coefficient (0.93±0.01) and mean jaccard coefficient (0.86±0.02) over all CT scans. Fig. 2 shows the mean value of these measures over each data set. The 3D isosurface plot of the segmented aorta is shown in Fig. 3 for two sample CT scans. The colormap indicates the point-wise error between aorta surfaces segmented manually and automatically.
Fig. 2.
Mean ± std of error (top figure), Jaccard coefficient (middle figure) and Dice coefficient (bottom figure) for each data set
Fig. 3.
Segmented aorta in 3D for two sample CT scans. Colormap indicates the closest point euclidean distance (in mm) between automatically segmented and manually labelled aorta surfaces (Better viewed in color)
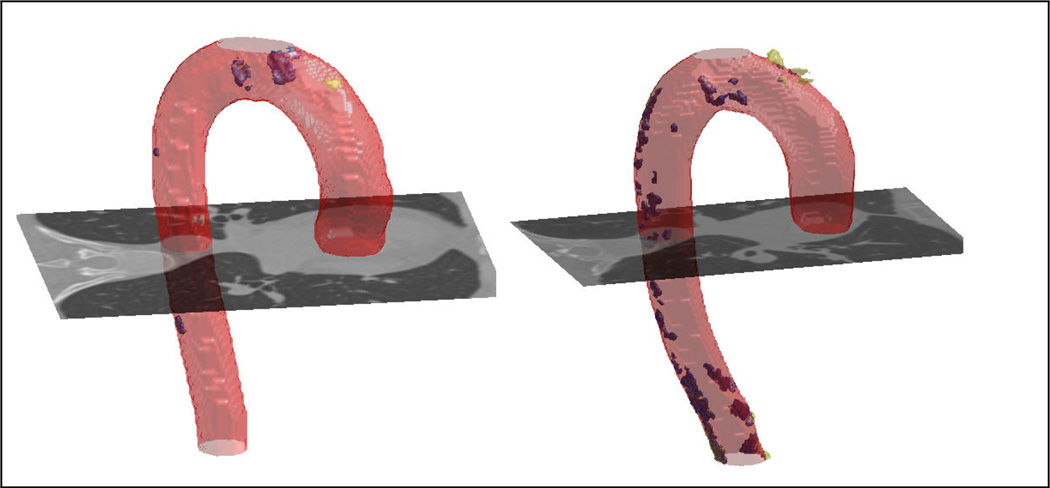
We evaluate the calcification detection performance of the algorithm in comparison to the manually detected calcifications (Fig. 4). We first apply 3D connected component analysis to automatically detected aortic calcifications. We compute false positive (FP), and true positive (TP) rates for number and volumes of calcifications detected in 45 CT scans. Out of the 424 calcified regions marked by the expert, the algorithm successfully detected 96% correctly (TP) which is better than 84% rate reported in [2]. The ratio of the successfully detected calcification volume to the volume marked by the expert is 0.94. The ratio of the number of FP calcifications to the number of algorithm detected calcifications is 0.17 and this ratio is 0.09 for the volume of FP calcifications.
Fig. 4.
Calcifications detected manually and by the algorithm are shown with yellow and blue respectively. (Better viewed in color)
IV. CONCLUSIONS
We use circularity of aorta cross section to find an initial aorta surface which is further evolved to the nearby edge location with a 3D level set approach. After aorta segmentation, calcifications are detected by thresholding. Some frequent locations of false positive calcifications are further processed and either automatically selected or rejected according to their anatomical locations. Some of our segmentation errors are due to limitations of the accuracy of manual expert labellings over axial slices especially around aortic arch. Future work will involve further testing and validation of the algorithm on a large cohort of CT scans to understand the effects of calcification on cardiovascular and pulmonary diseases. Also aorta segmentation will be used to guide the segmentation of other major vessels.
ACKNOWLEDGMENT
We thank to all the COPDGene Investigators for the data used in the paper. We also thank Nina Muralidhar for manual segmentations of aorta and aortic calcifications.
Footnotes
This work has been supported by grants from NIH (All authors were supported by U01 HL089897 and U01 HL089856; GW was supported by K23 HL089353 and RSE was supported by K25 HL104085.)
Contributor Information
Sila Kurugol, Email: [email protected], Dept. of Pulmonary and Critical Care..
Raul San Jose Estepar, Dept. of Radiology, Brigham and Women’ Hospital and Harvard Medical School, Boston, MA, USA..
James Ross, Dept. of Pulmonary and Critical Care..
George R. Washko, Dept. of Pulmonary and Critical Care.
References
- 1.Kurugol S, et al. ICPR. 2010. 3D Segmentation of Esophagus in Thoracic CT Images for Radiation Theraphy Planning. [Google Scholar]
- 2.Isgum I, Rutten A, Prokop M, et al. Automated aortic calcium scoring on low-dose chest computed tomography. Medical Physics. 2010;vol. 37(2):714–723. doi: 10.1118/1.3284211. [DOI] [PubMed] [Google Scholar]
- 3.Feuerstein M, Kitasaka T, Mori K. Automated anatomical likelihood driven extraction and branching detection of aortic arch in 3-D chest CT; Workshop on Pul. Image Analy; 2009. [Google Scholar]
- 4.Kovacs T, Cattin P, Alkadhi H, Wildermuth S. Automatic segmentation of the vessel lumen from 3D CTA images of aortic dissection. Bildverarbeitung fur die Medizin. 2006 [Google Scholar]
- 5.Li C, et al. CVPR. 2005. Level Set Evolution Without Re-initialization: A New Variational Formulation. [Google Scholar]
- 6.Kitasaka T, Mori K, Hasegawa J, Toriwaki J, Katada K. Automated extraction of aorta and pulmonary artery in mediastinum from 3D chest X-ray CT images without contrast medium; Proc. of SPIE Medical Imaging; 2002. [Google Scholar]
- 7.Taeprasartsit P, Higgins WE. Method for extracting the aorta from 3D CT images; Proc.of SPIE Medical Imaging; 2007. [Google Scholar]
- 8.Hanson AJ. Tech. Rep. 407. Indiana Univ.; 1994. Quaternion frenet frames: Making optimal tubes and ribbons from curves. [Google Scholar]
- 9.Kuhnel W. Differential geometry, Student Mathematical Library. American Math. Society. 2002 [Google Scholar]
- 10.Caselles V, et al. A geometric model for active contours in image processing. Numer. Math. 1993;vol. 66:1–31. [Google Scholar]
- 11.Chan TF, Vese LA. Active contours without edges. IEEE Trans. on Image Processing. 2001;vol. 10(2):266–277. doi: 10.1109/83.902291. [DOI] [PubMed] [Google Scholar]


