MATH TERMS THAT START WITH B
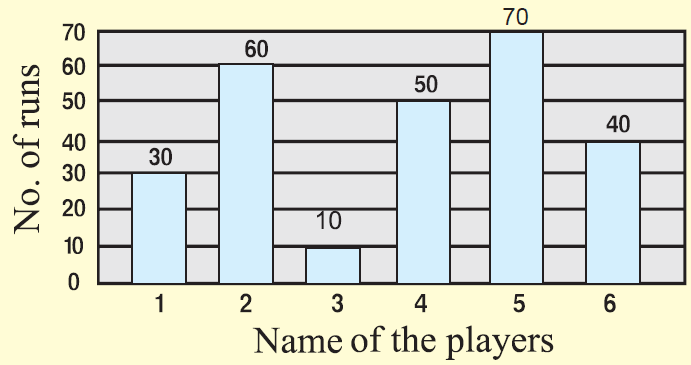
Bar Graph :
Also called bar chart. Bar graphs are one of many ways of visual representation of qualitative (categorical) data. In order to distinguish them from histograms, a little space is left between bars in the graph.

Base of Exponential Function :
In exponential function y = ax, where 0 < a < 1, a ≠ 1, and -∞ < x < ∞, the constant a is called the base and the variable x is called the exponent.
Base of Logarithm :
In logarithmic function y = logbx, where 0 < b < ∞, b ≠ 1, and 0 < x < ∞, the constant b is called the base of the logarithm.
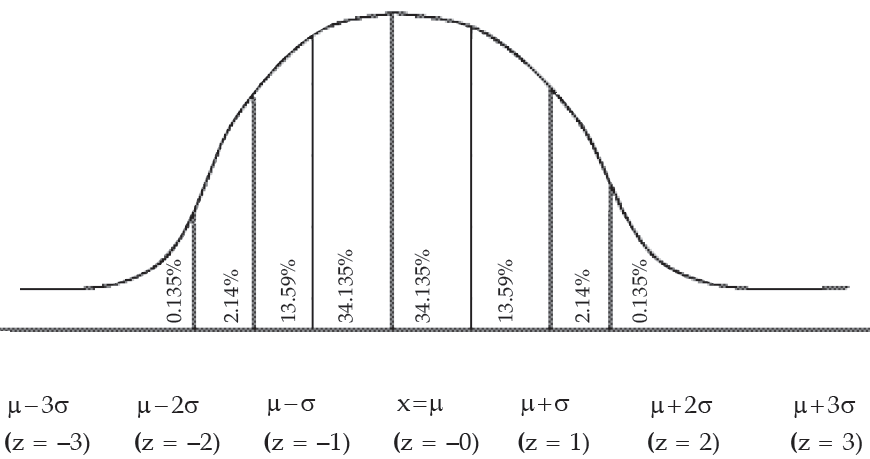
Bell-Shaped (Gaussian) Curve :
The curve describing the normal distribution. Mathematically the function having that graph is given by the formula

where μ and σ are the mean and standard deviation of the distribution respectively. The graph of this distribution looks like the one above.
Best Fitting Line :
A line that best describes the paired data collected from sample and presented by a scatterplot. See least squares regression line.
Biconditional Statement :
A logical statement of the form "If A then B and if B, then A", or, equivalently, "A if and only if B". This statement also can be written symbolically as A, B. Examples can be : "A triangle is equilateral if and only if it has three equal angles", or "A number is divisible by two if and only if it is even". See also conditional statement.
Binary Numbers :
The binary numeral system represents numeric values using only two symbols, usually 0 and 1. In this system the sequence of whole numbers 0, 1, 2, 3, ... is represented by the following sequence: 0, 1, 10, 11, 100, 101, 110, 111, 1000, ... The use of this system is crucial in computers and other electronic devices because it allows to represent all real numbers (or their approximations) with the help of signal-no signal sequences. See also decimal numbers.
Binary Operation :
An operation involving two mathematical objects. Examples of binary operations are addition and multiplication of numbers, functions, matrices, etc.
Binomial :
A polynomial of one or more variables that has exactly two terms, called monomials.
Examples :
2x + 1, 3x3 + 4x2, 2x4y3 + 5xy2z
Binomial Coefficients :
In binomial expansion (see below), the numeric coecients
where n ≥ 1 is an integer and 0 ≤ k ≤ n is another integer.
Binomial Distribution :
Suppose we are conducting some experiment and the following conditions are satisfies :
1) There are n repeated trials every time ;
2) Each trial has exactly two possible outcomes, called success (S) and failure (F) ;
3) Probability of S is p and probability of F is q = 1 - p ;
4) The random variable x is the number of successes
in n trials and takes values from 0 to n.
In this case it is said that we have binomial setting. Binomial distribution is the distribution of probabilities in this setting and is given by the formula
Binomial distributions serve as a good approximation for normal distributions.
Binomial Expansion :
Also called Binomial Theorem. For any given real quantities x and y (fixed or variable) and any natural number n, the following expansion holds :
Boolean Algebra :
The system of rules of operations with logical statements. This algebra involves Boolean variables, that take True and False values (or 1 and 0) and operations of conjunction ("and"), disjunction ("or") and negation ("not"). Named af-
ter George Boole.
Boxplot :
One of the tools of visualizing quantitative data. To construct a boxplot it is necessary first to organize the values in increasing order. Next, finding the median of these values we indicate the center. On the last step we find the two medians of these two halves. These points are the first and third quartiles of the data set. Along with the minimum and maximum values they make-up the five point summary. Now, the boxplot consists of a box where these five values are indicated. The form of the boxplot is not standard and could be made both horizontal or vertical. Picture shows one of the possible forms.

Bi-Variate Data :
When data are collected on two variables simultaneously, they are known as bivariate data and the corresponding frequency distribution, derived from it, is known as Bivariate Frequency Distribution.
Kindly mail your feedback to [email protected]
We always appreciate your feedback.
©All rights reserved. onlinemath4all.com
Recent Articles
-
Digital SAT Math Problems and Solutions (part - 92)
Dec 27, 24 10:53 PM
Digital SAT Math Problems and Solutions (part - 92) -
SAT Math Resources (Videos, Concepts, Worksheets and More)
Dec 27, 24 10:48 PM
SAT Math Resources (Videos, Concepts, Worksheets and More) -
AP Calculus AB Problems with Solutions
Dec 26, 24 07:41 AM
AP Calculus AB Problems with Solutions

