Posts Tagged ‘root’

Enable Debian Linux automatic updates to keep latest OS Patches / Security Up to Date

Monday, January 13th, 2025

Enable Debian Linux automatic updates to keep latest OS Patches / Security Up to Date

Debian: Entenda a Importância Para o Mundo GNU/LINUX

I'm not a big fan of automatism on GNU / Linux as often using automatic updates could totally mess things especially with a complex and a bit chatic OS-es like is Linux nowadays. 
Nevertheless as Security is becoming more and more of a problem especially the browser security, having a scheduled way to apply updates like every normal modern Windows and MAC OS as an option is becoming essential to have a fully manageble Operating system.

As I use Debian GNU / Linux for desktop for my own personal computer and I have already a lot of Debian servers, whose OS minor level and package version maintenance takes up too big chunk of my time (a time I could dedicated to more useful activities). Thus I found it worthy at some cases to trigger Debian's way to keep the OS and security at a present level, the so called Debian "unattended upgrades".

In this article, I'll explain how to install and Enable Automatic (" Unattended " ) Updates on Debian, with the hope that other Debian users might start benefiting from it.
 

Pros of  enabling automatic updates, are:

  • Debian OS Stay secure without constant monitoring.
  • You Save much time by letting your system handle updates.
  • Presumably Enjoying more peace of mind, knowing your system is more protected.

Cons of enabling automatic updates:

  • Some exotic and bad maintained packages (might break after the update)
  • Customizations made on the OS /etc/sysctl.conf or any other very custom server configs might disappear or not work after the update
  • At worst scenario (a very rare but possible case) OS might fail to boot after update 🙂

Regular security updates patch vulnerabilities that could otherwise be exploited by attackers, which is especially important for servers and systems exposed to the internet, where threats evolve constantly.

1. Update Debian System to latest

Before applying automatic updates making any changes, run apt to update package lists and upgrade any outdated packages,to have automatic updates for a smooth configuration process.

# apt update && apt upgrade -y

2. Install the Unattended-Upgrades deb Package 

# apt install unattended-upgrades -y

Reading package lists… Done
Building dependency tree… Done
Reading state information… Done
The following additional packages will be installed:
  distro-info-data gir1.2-glib-2.0 iso-codes libgirepository-1.0-1 lsb-release python-apt-common python3-apt python3-dbus python3-distro-info python3-gi
Suggested packages:
  isoquery python-apt-doc python-dbus-doc needrestart powermgmt-base
The following NEW packages will be installed:
  distro-info-data gir1.2-glib-2.0 iso-codes libgirepository-1.0-1 lsb-release python-apt-common python3-apt python3-dbus python3-distro-info python3-gi unattended-upgrades
0 upgraded, 11 newly installed, 0 to remove and 0 not upgraded.
Need to get 3,786 kB of archives.
After this operation, 24.4 MB of additional disk space will be used.
Do you want to continue? [Y/n]


# apt install apt-listchanges
Reading package lists… Done
Building dependency tree… Done
Reading state information… Done
The following package was automatically installed and is no longer required:
  linux-image-5.10.0-30-amd64
Use 'apt autoremove' to remove it.
The following additional packages will be installed:
  python3-debconf
The following NEW packages will be installed:
  apt-listchanges python3-debconf
0 upgraded, 2 newly installed, 0 to remove and 0 not upgraded.
Need to get 137 kB of archives.
After this operation, 452 kB of additional disk space will be used.
Do you want to continue? [Y/n]
Get:1 http://deb.debian.org/debian bookworm/main amd64 python3-debconf all 1.5.82 [3,980 B]
Get:2 http://deb.debian.org/debian bookworm/main amd64 apt-listchanges all 3.24 [133 kB]
Fetched 137 kB in 0s (292 kB/s)
Preconfiguring packages …
Deferring configuration of apt-listchanges until /usr/bin/python3
and python's debconf module are available
Selecting previously unselected package python3-debconf.
(Reading database … 84582 files and directories currently installed.)
Preparing to unpack …/python3-debconf_1.5.82_all.deb …
Unpacking python3-debconf (1.5.82) …
Selecting previously unselected package apt-listchanges.
Preparing to unpack …/apt-listchanges_3.24_all.deb …
Unpacking apt-listchanges (3.24) …
Setting up python3-debconf (1.5.82) …
Setting up apt-listchanges (3.24) …

Creating config file /etc/apt/listchanges.conf with new version


Example config for apt-listchanges would be like:

# vim /etc/apt/listchanges.conf
[apt]
frontend=pager
email_address=root
confirm=0
save_seen=/var/lib/apt/listchanges.db
which=both

3. Enable Automatic unattended upgrades

Once installed, enable automatic updates with the following command, which will prompt asking if you want to enable automatic updates. Select Yes and press Enter, which will confirm that the unattended-upgrades service is active and ready to manage updates for you.

# dpkg-reconfigure unattended-upgrades

Configure-Unattended-Upgrades-on-Debian_Linux-dpkg-reconfigure-screenshot

Or non-interactively by running command:

# echo unattended-upgrades unattended-upgrades/enable_auto_updates boolean true | debconf-set-selections
dpkg-reconfigure -f noninteractive unattended-upgrades


4. Set the Schedule for Automatic Updates on Debian

By default, unattended-upgrades runs daily, to verify or modify the schedule, check the systemd timer:

# sudo systemctl status apt-daily.timer
# sudo systemctl status apt-daily-upgrade.timer
# systemctl edit apt-daily-upgrade.timer

Current apt-daily.timer config as of Debian 12 (bookworm) is as follows

root@haproxy2:/etc/apt/apt.conf.d# cat  /lib/systemd/system/apt-daily.timer
[Unit]
Description=Daily apt download activities

[Timer]
OnCalendar=*-*-* 6,18:00
RandomizedDelaySec=12h
Persistent=true

[Install]
WantedBy=timers.target
root@haproxy2:/etc/apt/apt.conf.d#


# systemctl edit apt-daily-upgrade.timer

[Timer]
OnCalendar=
OnCalendar=03:00
RandomizedDelaySec=0


At Line  num 2 above is needed to reset (empty) the default value shown below in line  num 5.
Line 4 is needed to prevent any random delays coming from the defaults.


Now both timers should be active, if not, activate them with:

# systemctl enable –now apt-daily.timer
# systemctl enable –now apt-daily-upgrade.timer


These timers ensure that updates are checked and applied regularly, without manual intervention.

5.Test one time Automatic Updates on Debian works

To ensure everything is working, simulate an unattended upgrade with a dry run:

# unattended-upgrade –dry-run


You can monitor automatic updates by checking the logs.

# less /var/log/unattended-upgrades/unattended-upgrades.log

Log shows details of installed updates and any issues that occurred. Reviewing logs periodically can help you ensure that updates are being applied correctly and troubleshoot any problems.

6. Advanced Configuration Options

If you’re a power user or managing multiple systems, you might want to explore these additional settings in the configuration file:

# vim /etc/apt/apt.conf.d/50unattended-upgrades


Configure unattended-upgrades to send you an email whenever updates are installed.

Unattended-Upgrade::Mail "[email protected]";


Enable automatic reboots after kernel updates
by adding the line:

Unattended-Upgrade::Automatic-Reboot "true";

To schedule reboots after package upgrade is applied  at a specific time:

Unattended-Upgrade::Automatic-Reboot-Time "02:00";

Specify packages you don’t want to be updated by editing the Unattended-Upgrade::Package-Blacklist section in the configuration file.


Here is alternative way to configure the unattended upgrade, by using apt configuration options:

# vim /etc/apt/apt.conf.d/02periodic

// Control parameters for cron jobs by /etc/cron.daily/apt-compat //


// Enable the update/upgrade script (0=disable)
APT::Periodic::Enable "1";


// Do "apt-get update" automatically every n-days (0=disable)
APT::Periodic::Update-Package-Lists "1";


// Do "apt-get upgrade –download-only" every n-days (0=disable)
APT::Periodic::Download-Upgradeable-Packages "1";


// Run the "unattended-upgrade" security upgrade script
// every n-days (0=disabled)
// Requires the package "unattended-upgrades" and will write
// a log in /var/log/unattended-upgrades
APT::Periodic::Unattended-Upgrade "1";


// Do "apt-get autoclean" every n-days (0=disable)
APT::Periodic::AutocleanInterval "21";


// Send report mail to root
//     0:  no report             (or null string)
//     1:  progress report       (actually any string)
//     2:  + command outputs     (remove -qq, remove 2>/dev/null, add -d)
//     3:  + trace on
APT::Periodic::Verbose "2";

If you have to simultaneously update multiple machines and you're on a limited connection line, configure download limits if you’re on a metered connection by setting options in /etc/apt/apt.conf.d/20auto-upgrades.

7. Stop Automatic Unattended Upgrade

Under some circumstances if it happens the unattended upgrades are no longer required and you want to revert back to manual package updates, to disable the updates you have to disable the unattended-upgrades service

# systemctl stop unattended-upgrades


8.  Stop an ongoing apt deb package set of updates applied on Debian server

Perhaps not often, but it might be you have run an automated upgrade and this has broke a server system or a service and for that reason you would like to stop the upcoming upgrade (some of whose might have started on other servers) immediately, to do so, the easiest way (not always safe thogh) is to kill the unattended-upgrades daemon.
 

# pkill –signal SIGKILL unattended-upgrades


Note that this a very brutal way to kill it and that might lead to some broken package update, that you might have to later fix manually.

If you have the unattended-upgrade process running on the OS in the process list backgrounded and you want to stop the being on the fly upgrade on the system more safely for the system, you can stop and cancel the ongoing apt upgrade  it by running the ncurses prompt interface, through dpkg-reconfigure

# dpkg-reconfigure unattended-upgrades


Then just select No, press Enter. In my case, this has promptly stopped the ongoing unattended upgrade that seemed blocked (at least as promptly as the hardware seemed to allow 🙂 ).

If you want to disable it for future, so it doesn't automatically gets enabled on next manual update, by some update script disable service as well.
 

# systemctl disable unattended-upgrades


Close up

That’s all ! Now, your Debian system will automatically handle security updates, keeping your system secure without you having to do a thing.
The same guide should be good for most Deb based distributions such as Ubuntu / Mint and there rest of other Debian derivative OS-es.
You’ve now set up a reliable way to ensure your system stays protected from vulnerabilities, but anyways it is a good practice to always login and check what the update has done to the system, otherwise expect the unexpected. 

Monitoring network traffic tools to debug network issues in console interactively on Linux

Thursday, December 14th, 2023

transport-layer-fourth-layer-data-transport-diagram


In my last article Debugging and routing network issues on Linux (common approaches), I've given some step by step methology on how to debug a network routing or unreachability issues between network hosts. As the article was mostly targetting a command line tools that can help debugging the network without much interactivity. I've decided to blog of a few other tools that might help the system administrator to debug network issues by using few a bit more interactive tools. Throughout the years of managing multitude of Linux based laptops and servers, as well as being involved in security testing and penetration in the past, these tools has always played an important role and are worthy to be well known and used by any self respecting sys admin or network security expert that has to deal with Linux and *Unix operating systems.
 

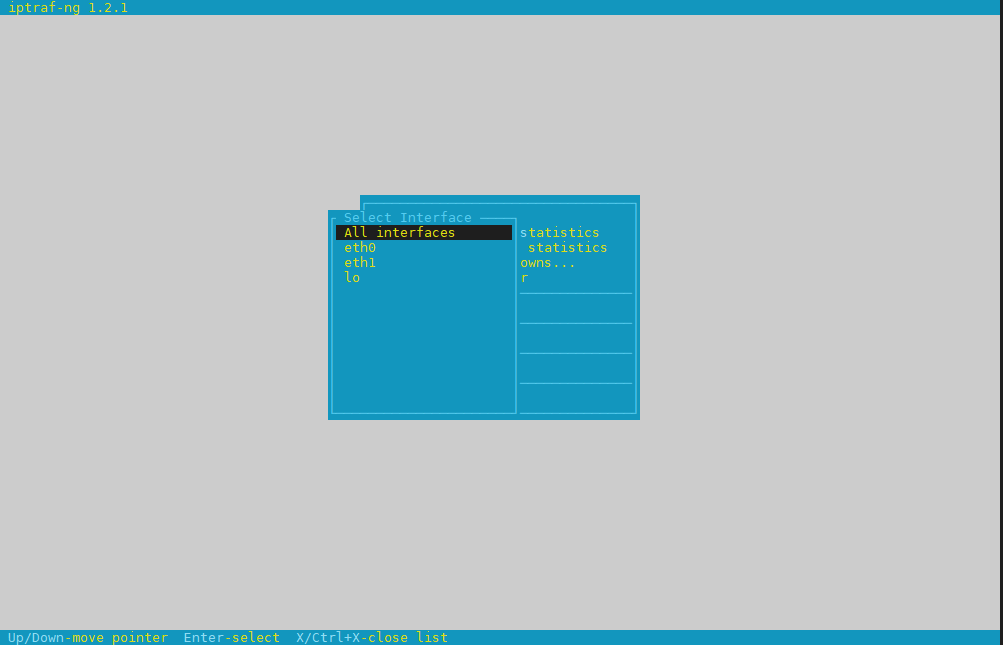
1. Debugging what is going on on a network level interactively with iptraf-ng

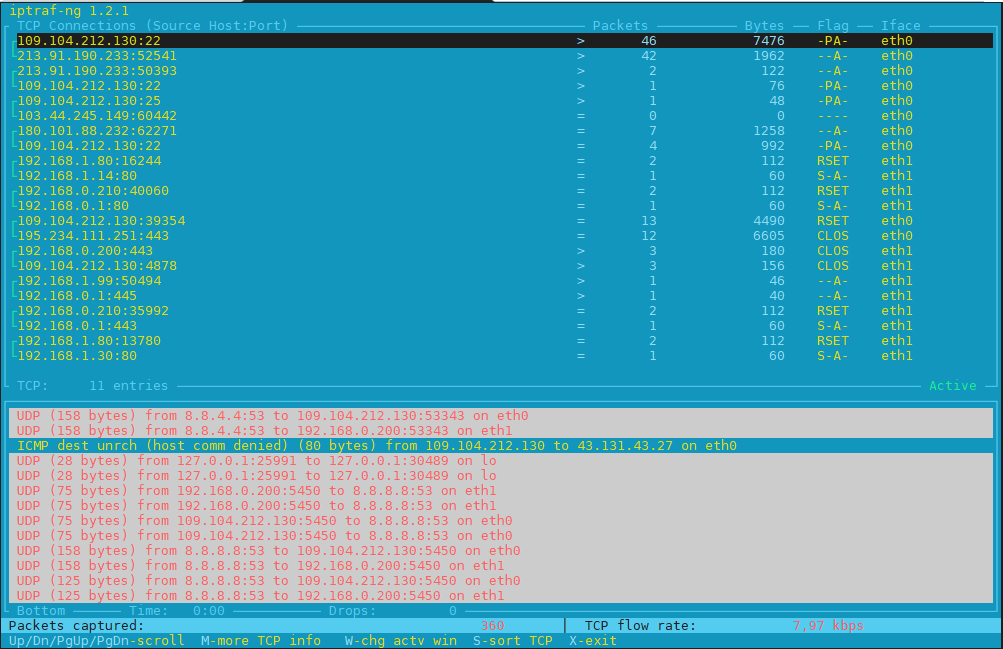
Historically iptraf and today's iptraf is also a great tool one can use to further aid the arsenal debug a network issue or Protocol problem, failure of packets or network interaction issues SYN -> ACK etc. proto interactions and check for Flag states and packets flow.

To use iptraf-ng which is a ncurses based tool just install it and launch it and select the interface you would like to debug trafic on.

To install On Debians distros

# apt install iptraf-ng –yes

# iptraf-ng


iptraf-ng-linux-select-interface-screen
 

iptraf-ng-listen-all-interfaces-check-tcp-flags-and-packets


Session-Layer-in-OSI-Model-diagram
 

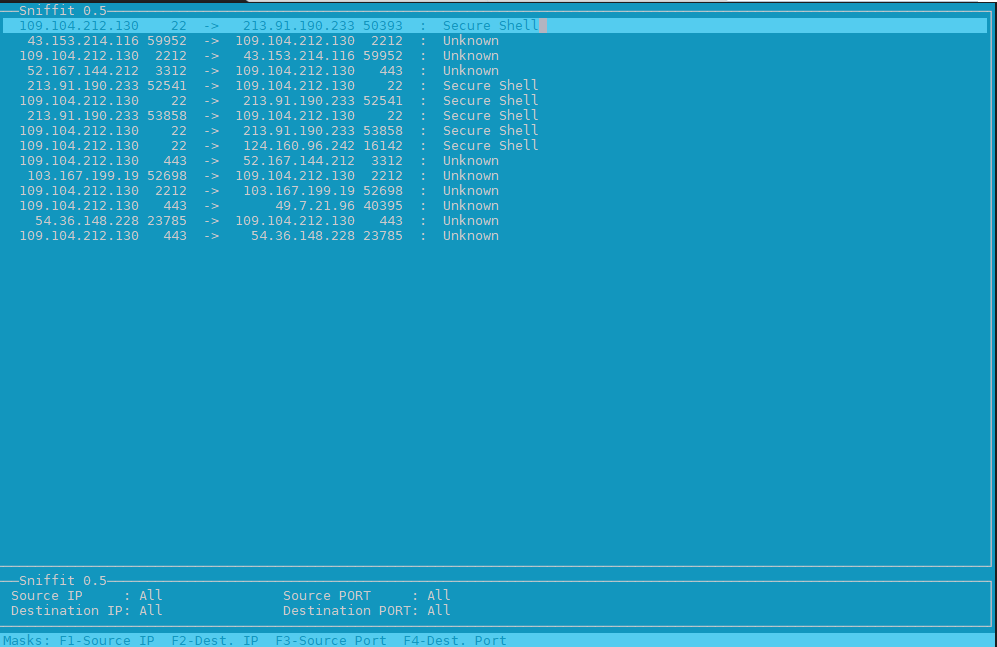
2. Use hackers old tool sniffit to monitor current ongoing traffic and read plain text messages

Those older who remember the rise of Linux to the masses, should remember sniffit was a great tool to snoop for traffic on the network.

root@pcfreak:~# apt-cache show sniffit|grep -i description -A 10 -B10
Package: sniffit
Version: 0.5-1
Installed-Size: 139
Maintainer: Joao Eriberto Mota Filho <[email protected]>
Architecture: amd64
Depends: libc6 (>= 2.14), libncurses6 (>= 6), libpcap0.8 (>= 0.9.8), libtinfo6 (>= 6)
Description-en: packet sniffer and monitoring tool
 Sniffit is a packet sniffer for TCP/UDP/ICMP packets over IPv4. It is able
 to give you a very detailed technical info on these packets, as SEQ, ACK,
 TTL, Window, etc. The packet contents also can be viewed, in different
 formats (hex or plain text, etc.).
 .
 Sniffit is based in libpcap and is useful when learning about computer
 networks and their security.
Description-md5: 973beeeaadf4c31bef683350f1346ee9
Homepage: https://github.com/resurrecting-open-source-projects/sniffit
Tag: interface::text-mode, mail::notification, role::program, scope::utility,
 uitoolkit::ncurses, use::monitor, use::scanning, works-with::mail,
 works-with::network-traffic
Section: net
Priority: optional
Filename: pool/main/s/sniffit/sniffit_0.5-1_amd64.deb
Size: 61796
MD5sum: ea4cc0bc73f9e94d5a3c1ceeaa485ee1
SHA256: 7ec76b62ab508ec55c2ef0ecea952b7d1c55120b37b28fb8bc7c86645a43c485


Sniffit is not installed by default on deb distros, so to give it a try install it

# apt install sniffit –yes
# sniffit


sniffit-linux-check-tcp-traffic-screenshot
 

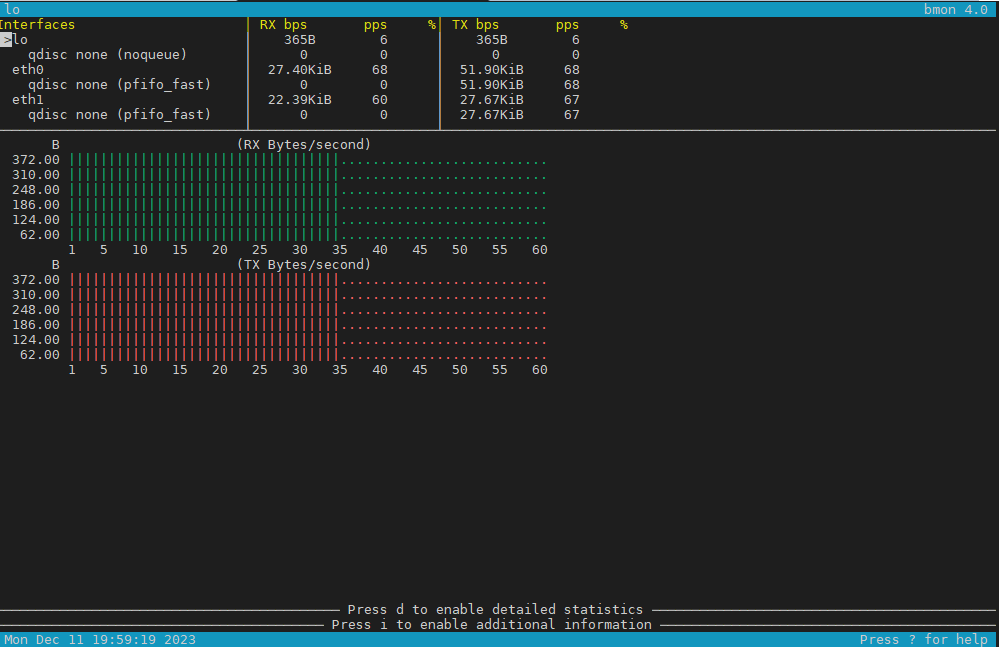
3. Use bmon to monitor bandwidth and any potential traffic losses and check qdisc pfifo
Linux network stack queues


root@pcfreak:~# apt-cache show bmon |grep -i description
Description-en: portable bandwidth monitor and rate estimator
Description-md5: 3288eb0a673978e478042369c7927d3f
root@pcfreak:~# apt-cache show bmon |grep -i description -A 10 -B10
Package: bmon
Version: 1:4.0-7
Installed-Size: 146
Maintainer: Patrick Matthäi <[email protected]>
Architecture: amd64
Depends: libc6 (>= 2.17), libconfuse2 (>= 3.2.1~), libncursesw6 (>= 6), libnl-3-200 (>= 3.2.7), libnl-route-3-200 (>= 3.2.7), libtinfo6 (>= 6)
Description-en: portable bandwidth monitor and rate estimator
 bmon is a commandline bandwidth monitor which supports various output
 methods including an interactive curses interface, lightweight HTML output but
 also simple ASCII output.
 .
 Statistics may be distributed over a network using multicast or unicast and
 collected at some point to generate a summary of statistics for a set of
 nodes.
Description-md5: 3288eb0a673978e478042369c7927d3f
Homepage: http://www.infradead.org/~tgr/bmon/
Tag: implemented-in::c, interface::text-mode, network::scanner,
 role::program, scope::utility, uitoolkit::ncurses, use::monitor,
 works-with::network-traffic
Section: net
Priority: optional
Filename: pool/main/b/bmon/bmon_4.0-7_amd64.deb
Size: 47348
MD5sum: c210f8317eafa22d9e3a8fb8316e0901
SHA256: 21730fc62241aee827f523dd33c458f4a5a7d4a8cf0a6e9266a3e00122d80645


root@pcfreak:~# apt install bmon –yes

root@pcfreak:~# bmon

bmon_monitor_qdisc-network-stack-bandwidth-on-linux

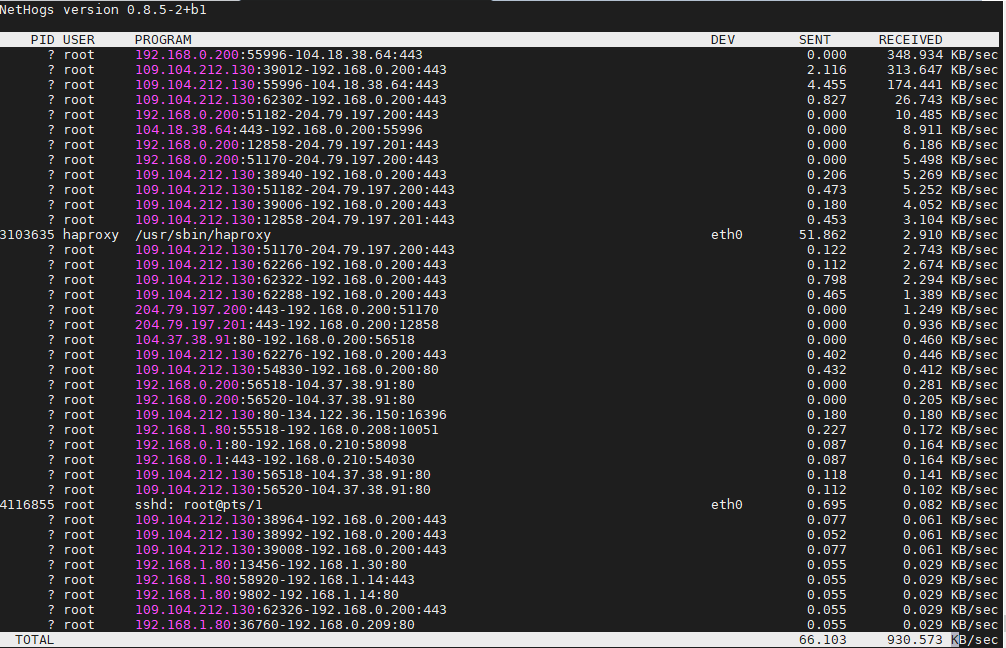
4. Use nethogs net diagnosis text interactive tool

NetHogs is a small 'net top' tool. 
Instead of breaking the traffic down per protocol or per subnet, like most tools do, it groups bandwidth by process.
 

root@pcfreak:~# apt-cache show nethogs|grep -i description -A10 -B10
Package: nethogs
Source: nethogs (0.8.5-2)
Version: 0.8.5-2+b1
Installed-Size: 79
Maintainer: Paulo Roberto Alves de Oliveira (aka kretcheu) <[email protected]>
Architecture: amd64
Depends: libc6 (>= 2.15), libgcc1 (>= 1:3.0), libncurses6 (>= 6), libpcap0.8 (>= 0.9.8), libstdc++6 (>= 5.2), libtinfo6 (>= 6)
Description-en: Net top tool grouping bandwidth per process
 NetHogs is a small 'net top' tool. Instead of breaking the traffic down per
 protocol or per subnet, like most tools do, it groups bandwidth by process.
 NetHogs does not rely on a special kernel module to be loaded.
Description-md5: 04c153c901ad7ca75e53e2ae32565ccd
Homepage: https://github.com/raboof/nethogs
Tag: admin::monitoring, implemented-in::c++, role::program,
 uitoolkit::ncurses, use::monitor, works-with::network-traffic
Section: net
Priority: optional
Filename: pool/main/n/nethogs/nethogs_0.8.5-2+b1_amd64.deb
Size: 30936
MD5sum: 500047d154a1fcde5f6eacaee45148e7
SHA256: 8bc69509f6a8c689bf53925ff35a5df78cf8ad76fff176add4f1530e66eba9dc

root@pcfreak:~# apt install nethogs –yes

# nethogs


nethogs-tool-screenshot-show-user-network--traffic-by-process-name-ID

5;.Use iftop –  to display network interface usage


root@pcfreak:~# apt-cache show iftop |grep -i description -A10 -B10
Package: iftop
Version: 1.0~pre4-7
Installed-Size: 97
Maintainer: Markus Koschany <[email protected]>
Architecture: amd64
Depends: libc6 (>= 2.29), libncurses6 (>= 6), libpcap0.8 (>= 0.9.8), libtinfo6 (>= 6)
Description-en: displays bandwidth usage information on an network interface
 iftop does for network usage what top(1) does for CPU usage. It listens to
 network traffic on a named interface and displays a table of current bandwidth
 usage by pairs of hosts. Handy for answering the question "Why is my Internet
 link so slow?".
Description-md5: f7e93593aba6acc7b5a331b49f97466f
Homepage: http://www.ex-parrot.com/~pdw/iftop/
Tag: admin::monitoring, implemented-in::c, interface::text-mode,
 role::program, scope::utility, uitoolkit::ncurses, use::monitor,
 works-with::network-traffic
Section: net
Priority: optional
Filename: pool/main/i/iftop/iftop_1.0~pre4-7_amd64.deb
Size: 42044
MD5sum: c9bb9c591b70753880e455f8dc416e0a
SHA256: 0366a4e54f3c65b2bbed6739ae70216b0017e2b7421b416d7c1888e1f1cb98b7


root@pcfreak:~# apt install –yes iftop

iftop-interactive-network-traffic-output-linux-screenshot


6. Ettercap (tool) to active and passive dissect network protocols for in depth network and host analysis

root@pcfreak:/var/www/images# apt-cache show ettercap-common|grep -i description -A10 -B10
Package: ettercap-common
Source: ettercap
Version: 1:0.8.3.1-3
Installed-Size: 2518
Maintainer: Debian Security Tools <[email protected]>
Architecture: amd64
Depends: ethtool, geoip-database, libbsd0 (>= 0.0), libc6 (>= 2.14), libcurl4 (>= 7.16.2), libgeoip1 (>= 1.6.12), libluajit-5.1-2 (>= 2.0.4+dfsg), libnet1 (>= 1.1.6), libpcap0.8 (>= 0.9.8), libpcre3, libssl1.1 (>= 1.1.1), zlib1g (>= 1:1.1.4)
Recommends: ettercap-graphical | ettercap-text-only
Description-en: Multipurpose sniffer/interceptor/logger for switched LAN
 Ettercap supports active and passive dissection of many protocols
 (even encrypted ones) and includes many feature for network and host
 analysis.
 .
 Data injection in an established connection and filtering (substitute
 or drop a packet) on the fly is also possible, keeping the connection
 synchronized.
 .
 Many sniffing modes are implemented, for a powerful and complete
 sniffing suite. It is possible to sniff in four modes: IP Based, MAC Based,
 ARP Based (full-duplex) and PublicARP Based (half-duplex).
 .
 Ettercap also has the ability to detect a switched LAN, and to use OS
 fingerprints (active or passive) to find the geometry of the LAN.
 .
 This package contains the Common support files, configuration files,
 plugins, and documentation.  You must also install either
 ettercap-graphical or ettercap-text-only for the actual GUI-enabled
 or text-only ettercap executable, respectively.
Description-md5: f1d894b138f387661d0f40a8940fb185
Homepage: https://ettercap.github.io/ettercap/
Tag: interface::text-mode, network::scanner, role::app-data, role::program,
 uitoolkit::ncurses, use::scanning
Section: net
Priority: optional
Filename: pool/main/e/ettercap/ettercap-common_0.8.3.1-3_amd64.deb
Size: 734972
MD5sum: 403d87841f8cdd278abf20bce83cb95e
SHA256: 500aee2f07e0fae82489321097aee8a97f9f1970f6e4f8978140550db87e4ba9


root@pcfreak:/ # apt install ettercap-text-only –yes

root@pcfreak:/ # ettercap -C


ettercap-text-interface-unified-sniffing-screenshot-linux

7. iperf and netperf to measure connecitivity speed on Network LAN and between Linux server hosts

iperf and netperf are two very handy tools to measure the speed of a network and various aspects of the bandwidth. It is mostly useful when designing network infrastructure or building networks from scratch.
 

If you never used netperf in the past here is a description from man netperf

NAME
       netperf – a network performance benchmark

SYNOPSIS
       netperf [global options] — [test specific options]

DESCRIPTION
       Netperf  is  a benchmark that can be used to measure various aspects of
       networking performance.  Currently, its focus is on bulk data  transfer
       and  request/response  performance  using  either  TCP  or UDP, and the
       Berkeley Sockets interface. In addition, tests for DLPI, and  Unix  Do‐
       main Sockets, tests for IPv6 may be conditionally compiled-in.


root@freak:~# netperf
MIGRATED TCP STREAM TEST from 0.0.0.0 (0.0.0.0) port 0 AF_INET to localhost () port 0 AF_INET : demo
Recv   Send    Send
Socket Socket  Message  Elapsed
Size   Size    Size     Time     Throughput
bytes  bytes   bytes    secs.    10^6bits/sec

 87380  65536  65536    10.00    17669.96


Testing UDP network throughput using NetPerf

Change the test name from TCP_STREAM to UDP_STREAM. Let’s use 1024 (1MB) as the message size to be sent by the client.
If you receive the following error send_data: data send error: Network is unreachable (errno 101) netperf: send_omni:

send_data failed: Network is unreachable, add option -R 1 to remove the iptable rule that prohibits NetPerf UDP flow.

$ netperf -H 172.31.56.48 -t UDP_STREAM -l 300 — -R 1 -m 1024
MIGRATED UDP STREAM TEST from 0.0.0.0 (0.0.0.0) port 0 AF_INET to 172.31.56.48 () port 0 AF_INET
Socket Message Elapsed Messages
Size Size Time Okay Errors Throughput
bytes bytes secs # # 10^6bits/sec

212992 1024 300.00 9193386 0 251.04
212992 300.00 9131380 249.35

UDP Throughput in a WAN

$ netperf -H HOST -t UDP_STREAM -l 300 — -R 1 -m 1024
MIGRATED UDP STREAM TEST from (null) (0.0.0.0) port 0 AF_INET to (null) () port 0 AF_INET : histogram : spin interval
Socket Message Elapsed Messages
Size Size Time Okay Errors Throughput
bytes bytes secs # # 10^6bits/sec

9216 1024 300.01 35627791 0 972.83
212992 300.01 253099 6.91


Testing TCP throughput using iPerf


Here is a short description of iperf

NAME
       iperf – perform network throughput tests

SYNOPSIS
       iperf -s [options]

       iperf -c server [options]

       iperf -u -s [options]

       iperf -u -c server [options]

DESCRIPTION
       iperf  2  is  a tool for performing network throughput and latency mea‐
       surements. It can test using either TCP or UDP protocols.  It  supports
       both  unidirectional  and  bidirectional traffic. Multiple simultaneous
       traffic streams are also supported. Metrics are displayed to help  iso‐
       late the causes which impact performance. Setting the enhanced (-e) op‐
       tion provides all available metrics.

       The user must establish both a both a server (to discard traffic) and a
       client (to generate traffic) for a test to occur. The client and server
       typically are on different hosts or computers but need not be.


Run iPerf3 as server on the server:

$ iperf3 –server –interval 30
———————————————————–
Server listening on 5201
———————————————————–


Test TCP Throughput in Local LAN


$ iperf3 –client 172.31.56.48 –time 300 –interval 30
Connecting to host 172.31.56.48, port 5201
[ 4] local 172.31.100.5 port 44728 connected to 172.31.56.48 port 5201
[ ID] Interval Transfer Bandwidth Retr Cwnd
[ 4] 0.00-30.00 sec 1.70 GBytes 488 Mbits/sec 138 533 KBytes
[ 4] 30.00-60.00 sec 260 MBytes 72.6 Mbits/sec 19 489 KBytes
[ 4] 60.00-90.00 sec 227 MBytes 63.5 Mbits/sec 15 542 KBytes
[ 4] 90.00-120.00 sec 227 MBytes 63.3 Mbits/sec 13 559 KBytes
[ 4] 120.00-150.00 sec 228 MBytes 63.7 Mbits/sec 16 463 KBytes
[ 4] 150.00-180.00 sec 227 MBytes 63.4 Mbits/sec 13 524 KBytes
[ 4] 180.00-210.00 sec 227 MBytes 63.5 Mbits/sec 14 559 KBytes
[ 4] 210.00-240.00 sec 227 MBytes 63.5 Mbits/sec 14 437 KBytes
[ 4] 240.00-270.00 sec 228 MBytes 63.7 Mbits/sec 14 516 KBytes
[ 4] 270.00-300.00 sec 227 MBytes 63.5 Mbits/sec 14 524 KBytes
– – – – – – – – – – – – – – – – – – – – – – – – –
[ ID] Interval Transfer Bandwidth Retr
[ 4] 0.00-300.00 sec 3.73 GBytes 107 Mbits/sec 270 sender
[ 4] 0.00-300.00 sec 3.73 GBytes 107 Mbits/sec receiver

Test TCP Throughput in a WAN Network

$ iperf3 –client HOST –time 300 –interval 30
Connecting to host HOST, port 5201
[ 5] local 192.168.1.73 port 56756 connected to HOST port 5201
[ ID] Interval Transfer Bitrate
[ 5] 0.00-30.00 sec 21.2 MBytes 5.93 Mbits/sec
[ 5] 30.00-60.00 sec 27.0 MBytes 7.55 Mbits/sec
[ 5] 60.00-90.00 sec 28.6 MBytes 7.99 Mbits/sec
[ 5] 90.00-120.00 sec 28.7 MBytes 8.02 Mbits/sec
[ 5] 120.00-150.00 sec 28.5 MBytes 7.97 Mbits/sec
[ 5] 150.00-180.00 sec 28.6 MBytes 7.99 Mbits/sec
[ 5] 180.00-210.00 sec 28.4 MBytes 7.94 Mbits/sec
[ 5] 210.00-240.00 sec 28.5 MBytes 7.97 Mbits/sec
[ 5] 240.00-270.00 sec 28.6 MBytes 8.00 Mbits/sec
[ 5] 270.00-300.00 sec 27.9 MBytes 7.81 Mbits/sec
– – – – – – – – – – – – – – – – – – – – – – – – –
[ ID] Interval Transfer Bitrate
[ 5] 0.00-300.00 sec 276 MBytes 7.72 Mbits/sec sender
[ 5] 0.00-300.00 sec 276 MBytes 7.71 Mbits/sec receiver


$ iperf3 –client 172.31.56.48 –interval 30 -u -b 100MB
Accepted connection from 172.31.100.5, port 39444
[ 5] local 172.31.56.48 port 5201 connected to 172.31.100.5 port 36436
[ ID] Interval Transfer Bandwidth Jitter Lost/Total Datagrams
[ 5] 0.00-30.00 sec 354 MBytes 98.9 Mbits/sec 0.052 ms 330/41774 (0.79%)
[ 5] 30.00-60.00 sec 355 MBytes 99.2 Mbits/sec 0.047 ms 355/41903 (0.85%)
[ 5] 60.00-90.00 sec 354 MBytes 98.9 Mbits/sec 0.048 ms 446/41905 (1.1%)
[ 5] 90.00-120.00 sec 355 MBytes 99.4 Mbits/sec 0.045 ms 261/41902 (0.62%)
[ 5] 120.00-150.00 sec 354 MBytes 99.1 Mbits/sec 0.048 ms 401/41908 (0.96%)
[ 5] 150.00-180.00 sec 353 MBytes 98.7 Mbits/sec 0.047 ms 530/41902 (1.3%)
[ 5] 180.00-210.00 sec 353 MBytes 98.8 Mbits/sec 0.059 ms 496/41904 (1.2%)
[ 5] 210.00-240.00 sec 354 MBytes 99.0 Mbits/sec 0.052 ms 407/41904 (0.97%)
[ 5] 240.00-270.00 sec 351 MBytes 98.3 Mbits/sec 0.059 ms 725/41903 (1.7%)
[ 5] 270.00-300.00 sec 354 MBytes 99.1 Mbits/sec 0.043 ms 393/41908 (0.94%)
– – – – – – – – – – – – – – – – – – – – – – – – –
[ ID] Interval Transfer Bandwidth Jitter Lost/Total Datagrams
[ 5] 0.00-300.04 sec 3.45 GBytes 98.94 Mbits/sec 0.043 ms 4344/418913 (1%)

UDP Throughput in a WAN

$ iperf3 –client HOST –time 300 -u -b 7.7MB
Accepted connection from 45.29.190.145, port 60634
[ 5] local 172.31.56.48 port 5201 connected to 45.29.190.145 port 52586
[ ID] Interval Transfer Bandwidth Jitter Lost/Total Datagrams
[ 5] 0.00-30.00 sec 27.4 MBytes 7.67 Mbits/sec 0.438 ms 64/19902 (0.32%)
[ 5] 30.00-60.00 sec 27.5 MBytes 7.69 Mbits/sec 0.446 ms 35/19940 (0.18%)
[ 5] 60.00-90.00 sec 27.5 MBytes 7.68 Mbits/sec 0.384 ms 39/19925 (0.2%)
[ 5] 90.00-120.00 sec 27.5 MBytes 7.68 Mbits/sec 0.528 ms 70/19950 (0.35%)
[ 5] 120.00-150.00 sec 27.4 MBytes 7.67 Mbits/sec 0.460 ms 51/19924 (0.26%)
[ 5] 150.00-180.00 sec 27.5 MBytes 7.69 Mbits/sec 0.485 ms 37/19948 (0.19%)
[ 5] 180.00-210.00 sec 27.5 MBytes 7.68 Mbits/sec 0.572 ms 49/19941 (0.25%)
[ 5] 210.00-240.00 sec 26.8 MBytes 7.50 Mbits/sec 0.800 ms 443/19856 (2.2%)
[ 5] 240.00-270.00 sec 27.4 MBytes 7.66 Mbits/sec 0.570 ms 172/20009 (0.86%)
[ 5] 270.00-300.00 sec 25.3 MBytes 7.07 Mbits/sec 0.423 ms 1562/19867 (7.9%)
– – – – – – – – – – – – – – – – – – – – – – – – –
[ ID] Interval Transfer Bandwidth Jitter Lost/Total Datagrams
[ 5] 0.00-300.00 sec 272 MBytes 7.60 Mbits/sec 0.423 ms 2522/199284 (1.3%)
[SUM] 0.0-300.2 sec 31 datagrams received out-of-order


Sum it up what learned


Debugging network issues and snooping on a Local LAN (DMZ) network on a server or home LAN is useful  to debug for various network issues and more importantly track and know abou tsecurity threads such as plain text passowd communication via insecure protocols a failure of proper communication between Linux network nodes at times, or simply to get a better idea on what kind of network is your new purchased dedicated server living in .It can help you also strenghten your security and close up any possible security holes, or even help you start thinking like a security intruder (cracker / hacker) would do. In this article we went through few of my favourite tools I use for many years quite often. These tools are just part of the tons of useful *Unix free tools available to do a network debug. Tools mentioned up are worthy to install on every server you have to administratrate or even your home desktop PCs, these are iptraf, sniffit, iftop, bmon, nethogs, nmon, ettercap, iperf and netperf.
 If you have some other useful tools used on Linux sys admin tasks please share, I'll be glad to know it and put them in my arsenal of used tools.

Enjoy ! 🙂

Simple bash shell Script to easy and quickly automate deploy RHEL Linux Virtual Machines on KVM Virtualization

Friday, November 3rd, 2023

how-to-install-a-kvm-guest-os-from-the-commandline-easily-with-script-virt-install-logo

Earlier I've blogged in about howto build KVM Virtual Machine RHEL 8.3 Linux install on Redhat 8.3 Linux Hypervisor with custom tailored kickstart.cfg as one of the Projects i was involved in my work duty as system administrator, we had the task to build
a KVM virtual machines and build a High Availability Linux  PCS Corosync / Pacemaker / haproxy cluster on it to save some money for the company from purchasing VMWare licenses.

The setup of the KVM Virtual machine on a first glimpse is relatively simple and I thought, this can be done just for 2 / 3 days but it turned out to take up 2 weeks or so to properly prepare the kickstarter file and learn a bit about basic virt-install KVM options and experiment with them until
we can produce a noral working Virtual machines. 

The original developed simple script that I used to bring up a new KVM virtual machines in a bit easier way virt-install-kvm.sh looked like so:
 

#!/bin/sh
# Script to build a new VM based on a kickstart.cfg file template
# with virt-install
# Author Georgi Georgiev hip0
# [email protected]

KS_FILE='kickstart.cfg';
VM_NAME='RHEL8_3-VirtualMachine';
VM_DESCR='CentOS 8.3 Virtual Machine';
RAM='8192';
CPUS='8';
# size is in Gigabytes
VM_IMG_SIZE='70';
ISO_LOCATION='/vmprivate/rhel-server-8.3-x86_64-dvd.iso';
VM_IMG_FILE_LOC='/vmprivate/RHEL8_3-VirtualMachine.img';

virt-install -n "$VMNAME" –description "$VM_DESCR" –os-type=Linux –os-variant=rhel8.3 –ram=8192 –vcpus=8 –location="$ISO_LOCATION" –disk path=$VM_IMG_FILE,bus=virtio,size=$IMG_VM_SIZE –graphics none –initrd-inject=/root/$KS_FILE –extra-args "console=ttyS0 ks=file:/$KS_FILE"


The script basicly did what it was aimed for but modifying the kickstarter ks.cfg every time with multiple additional parameters, like network configurations as well some additional modifications to ks.cfg for VM parameters was annoying.

Recently as we had to repeat the same task again in order to migrate old customer containing a Linux OpenVZ Virtual machines to a newer  OS installed RHEL versionb with KVM virtual machines, i've took some hours and scripted a small script that would easiy our task to build new KVM Virtual Machines
from scratch relatively easy, if we have to repeat the Linux OS build operation again and again.

Before proceeding to use the script of course one has to use LVM and setup the partitions on the Host which will be the Hypervisor where the KVM VMs will be installed as well you need to download an ISO image of Redhat Enterprise Linux / CentOS / Fedora or whatever kind of RPM based Linux
you would like to setup as well as do the basic configurations regarding the emulated Hardware node "Power" of the new Virtual Machine (CPU / Memory / Disk Partition) as well as choose a proper meaningful VM name (preferrably following some good meaningful crafted naming convention, that will talk a bit about what is inside the KVM VM container).

The script that automates a bit the KVM VM installation which you find below you can also download from here virt-install.sh


#!/bin/bash
virt_install_path=$(which virt-install);
vm_host='vmname01';
boot_iso='/vmprivate/rhel-8.7-x86_64-dvd.iso';
os_version='rhel8.7';
vm_cpus_count='4';
vm_ram='6144';
vm_img_location='/vmprivate/NAME-of-VM.img';
vm_machine_description='Name Production system';
ks_file_location_template='/root/ks.cfg.templ';
ks_file_location='/root/ks.cfg';
ks_vm_read_loc=$(echo $ks_file_location |sed -e 's#root/##g');
vm_main_ip='192.168.23.52';
vm_netmask='255.255.255.192';
vm_gateway='192.168.23.33';
vm_nameserver='172.30.50.2';
#–ip=192.168.233.52 –netmask=255.255.255.192 –gateway=192.168.233.33 –nameserver=172.20.88.2

echo "Checking if defined $vm_host image $vm_img_location is not already present";
if [ ! -f $vm_img_location ]; then
echo
else
echo 'Exiting $vm_img_location is present';
echo "To destroy exiting VM image $vm_img_location run manually cmds:";
echo 'virsh list; virsh destroy $vm_host; virsh undefine $vm_host –remove-all-storage';
exit 1;
fi

alias cp='cp -f';
/usr/bin/cp -rpf $ks_file_location_template $ks_file_location;

echo "Setting  VM Main IP: $vm_main_ip";
echo "Setting  VM netmask: $vm_netmask";
echo "Setting  VM Gateway: $vm_gateway";
echo "Setting  VM Nameserver $vm_nameserver";
/usr/bin/perl -pi -e "s/ip=a1.a2.a3.a4/ip=$vm_main_ip/" $ks_file_location
/usr/bin/perl -pi -e "s/netmask=b1.b2.b3.b4/netmask=$vm_netmask/" $ks_file_location
/usr/bin/perl -pi -e "s/gateway=c1.c2.c3.c4/nameserver=$vm_nameserver/" $ks_file_location
/usr/bin/perl -pi -e "s/nameserver=d1.d2.d3.d4/gateway=$vm_gateway/" $ks_file_location
/usr/bin/perl -pi -e "s/vm-hostname/$vm_host/" $ks_file_location

echo "Running VM install:";
echo $virt_install_path -n $vm_host –description "$vm_machine_description" –os-type=Linux –os-variant=$os_version –ram=$vm_ram –vcpus=$vm_cpus_count –location=$boot_iso –disk path=$vm_img_location,bus=virtio,size=90 –graphics none –initrd-inject=$ks_file_location –extra-args "console=ttyS0 ks=file:$ks_vm_read_loc"

$virt_install_path -n $vm_host –description "$vm_machine_description" –os-type=Linux –os-variant=$os_version –ram=$vm_ram –vcpus=$vm_cpus_count –location=$boot_iso –disk path=$vm_img_location,bus=virtio,size=90 –graphics none –initrd-inject=$ks_file_location –extra-args "console=ttyS0 ks=file:$ks_vm_read_loc"


Modify the script to insert the required parameters of the new VM in the script header session, you will have to provide below options.


vm_host='vmname01';
boot_iso='/vmprivate/rhel-8.7-x86_64-dvd.iso';
os_version='rhel8.7';
vm_cpus_count='4';
vm_ram='6144';
vm_img_location='/vmprivate/NAME-of-VM.img';
vm_machine_description='Name Production system';
ks_file_location_template='/root/ks.cfg.templ';
ks_file_location='/root/ks.cfg';
ks_vm_read_loc=$(echo $ks_file_location |sed -e 's#root/##g');
vm_main_ip='192.168.23.52';
vm_netmask='255.255.255.192';
vm_gateway='192.168.23.33';
vm_nameserver='172.30.50.2';

The automatic Build virtual machine script is tested and works with Redhat Enterprise Linux and of course is pretty primitive as there is so much available online that would do similar, but still I like it because it works for me 🙂

You will need also the ks.cfg.templ file which has the basic kickstarter configuration that will bring up the Virtual machines according to predefined configurations.
Here is the ks.cfg.templ and ks.cfg files as well, you will have to place them under /root/ or some other directory.
Of course this script is just a basic one, it can be easily updated to accept its variable options as arguments if you need to bring up a multitude of virtual machines relatively quickly with few minor modifications. 

Hope the script is helpful to some sysadmin out there. If so don't forget to donate me for a beer in my Patreon account found in the widgets section 🙂

How to create PCS / Corosync High Availability Cluster config backup and migrate to new Virtual Machines

Thursday, October 26th, 2023

pcs-pcmk-internals-explained-picture

The aim of this article is to illustrate how to literally migrate a an Haproxy PCS Pacemaker / Corosync Cluster configurations from old Virtual Machines that due to time passed become unsupported (The Operating System end of life (EOF)) has reached to a new ones. 
This is quite a complex task especially as you usually need to setup the Hypervisor hosts with VMWare / Xen / KVM / OpenVZ or whatever kind of virtualization is to be used. Then setup the correct network interfaces IPs failover the heartbeat lines over which the cluster will work to prevent Split Brain scenartions, the Network Bonding interfaces to guarantee a higher amount of higher availability as well as physically install and update all the cluster software on the new built Linux hosts that will be members of the new cluster in setup. 

All this configuration from scratch of a PCS Corosync cluster is a very lenght topic which I'll try to cover in some of my next articles. In short to migrate the cluster from old machines to new once all this predescribed steps are in line. 
You will need to.


1. Create backup of old cluster configuration
2. Migrate the backup to a new built VM Machine hosts
3. Import the cluster configuration into the PCS Cluster.


Bear in mind that this article discusses a migration of CentOS Linux release 7.9.2009 with its shipped versions of corosync / pacemaker and pcs 

How to create cluster config backup and migrate to new VM

1. Dump cluster assuming that is a Quality Assuare or Pre – Production host  to create full cluster config backup

[root@old-cluster-machine ~]# pcs config backup old-cluster-machine.pcs.config.bak

2. Dump cluster Production full configuration

[root@old-cluster-machine1 ~]# pcs config backup old-cluster-machine1.pcs.config.bak

This command will output a backup of 

old-cluster-machine1.pcs.config.bak.tar.bz2

3. Migrate a cluster identical config to the new Virtual machines

Usually this moval of produced backup files with pcs config backup  commands can be copied with something like FTP / SFTP  or SSL-ed / TLS-ed protocol. However if you have to move the configuration files from a paranoid Citrix environment that doesn't allow you to have any SFTP / SSH or FTP kind of transfer protocol from the location where the old config lays to the new ones. 
A simple encoding of the binary format dumped configuration to plain text files can be done and files, can be moved via a simple copy / paste operation (a bit of a hack) 🙂

Encode the cluster config to be able to migrate configuration in plain text via a simple Copy / Paste operation.


[root@old-cluster-machine ~]# base64 config backup old-cluster-machine.pcs.config.bak > old-cluster-machine.pcs.config.bak.tgz.b64

[root@old-cluster-machine1 ~]# base64 old-cluster-machine1.pcs.config.bak.tar.bz2 > old-cluster-machine1.pcs.config.bak.tgz.b64
[root@old-cluster-machine ~]# cat  old-cluster-machine.pcs.config.bak.tgz.b64

(Copy output and Paste to new host VM) /root/haproxy-cluster-backup)

[root@old-cluster-machine1 ~]# cat old-cluster-machine1.pcs.config.bak.tgz.b64 


(Copy output and Paste to new host VM) /root/haproxy-cluster-backup)

Login to the new hosts, where configs has to be migrated and restore the files with base64

For QA / Preprod to restore backup config

[root@dkv-newqa-vm ~]# mkdir /root/haproxy-cluster-backup
[root@dkv-newqa-vm ~]# cd /root/haproxy-cluster-backup
[root@dkv-newqa-vm ~]# base64 -d old-cluster-machine.config.bak.tgz.b64 > old-cluster-machine.pcs.config.bak.tar.bz2
[root@dkv-newqa-vm ~]#  tar -jxvf old-cluster-machine.pcs.config.bak.tar.bz2
ak.tar.bz2
version.txt
pcs_settings.conf
corosync.conf
cib.xml
pacemaker_authkey
uidgid.d/


For Prod to restore backup config

[root@dkv-newprod-vm  ~]# mkdir /root/haproxy-cluster-backup
[root@dkv-newprod-vm ~]# cd /root/haproxy-cluster-backup
[root@dkv-newprod-vm ~]# base64 -d old-cluster-machine.config.bak.tgz.b64 > old-cluster-machine1.pcs.config.bak.tar.bz2
ak.tar.bz2
version.txt
pcs_settings.conf
corosync.conf
cib.xml
pacemaker_authkey
uidgid.d/


N!B! An Useful hin is on RHEL 8 Linux's shipped pcs command version has also a very useful command with which you can simply dump completly the config of the cluster in straight commands which you can run directly on the new VM machines where you have migrated.

The command to print out commands that would add existing cluster resources on Redhat 8:

# pcs resource config –output-format=cmd

Another useful command for cluster migration is cibadmin

i.e. to dump cluster xml config

#cibadmin –q > cluster.xml

Later you can import the prior xml dump with it.

# cibadmin –replace –xml-file cib.xml


Monitor cluster heartbeat lines IP reahability via ping ICMP protocol with Zabbix

Wednesday, April 12th, 2023

https://pc-freak.net/images/zabbix-monitoring-icmp-ping-on-application-crm-clusters-with-userparameter-script-howto

Say you're having an haproxy load balancer cluster with two or more nodes and you are running the servers inside some complex organizational hybrid complex network that is a combination of a local DMZ lans, many switches, dedicated connectivity lines and every now and then it happens for the network to mysteriously go down. Usually simply setting monitoring on the network devices CISCO itself or the smart switches used is enough to give you an overview on what's going on but if haproxy is in the middle of the end application servers and in front of other Load balancers and network equipment sometimes it might happen that due to failure of a network equipment / routing issues or other strange unexpected reasons one of the 2 nodes connectivity might fail down via the configured dedicated additional Heartbeat lines that are usually configured in order to keep away the haproxy CRM Resource Manager cluster thus ending it up in a split brain scenarios.

Assuming that this is the case like it is with us you would definitely want to keep an eye on the connectivity of Connect Line1 and Connect Line2 inside some monitoring software like zabbix. As our company main monitoring software used to monitor our infrastructure is Zabbix in this little article, I'll briefly explain how to configre the network connectivity status change from haproxy node1 and haproxy node2 Load balancer cluster to be monitored via a simple ICMP ping echo checks.

Of course the easies way to configure an ICMP monitor via Zabbix is using EnableRemoteCommands=1 inside /etc/zabbix/zabbix-agentd.conf but if your infrastructure should be of High Security and PCI perhaps this options is prohibited to be used on the servers. This is why to achieve still the ICMP ping checks with EnableRemoteCommands=0 a separate simple bash user parameter script could be used. Read further to find out one way ICMP monitoring with a useparameter script can be achieved with Zabbix.


1. Create the userparameter check for heartbeat lines

root@haproxy1 zabbix_agentd.d]# cat userparameter_check_heartbeat_lines.conf
UserParameter=heartbeat.check,\
/etc/zabbix/scripts/check_heartbeat_lines.sh

root@haproxy2 zabbix_agentd.d]# cat userparameter_check_heartbeat_lines.conf
UserParameter=heartbeat.check,\
/etc/zabbix/scripts/check_heartbeat_lines.sh

2. Create check_heartbeat_lines.sh script which will be actually checking connectivity with simple ping

root@haproxy1 zabbix_agentd.d]# cat /etc/zabbix/scripts/check_heartbeat_lines.sh
#!/bin/bash
hb1=haproxy2-lb1
hb2=haproxy2-lb2
if ping -c 1 $hb1  &> /dev/null
then
  echo "$hb1 1"
else
  echo "$hb1 0"
fi
if ping -c 1 $hb2  &> /dev/null
then
  echo "$hb2 1"
else
  echo "$hb2 0"
fi

[root@haproxy1 zabbix_agentd.d]#

root@haproxy2 zabbix_agentd.d]# cat /etc/zabbix/scripts/check_heartbeat_lines.sh
#!/bin/bash
hb1=haproxy1-hb1
hb2=haproxy1-hb2
if ping -c 1 $hb1  &> /dev/null
then
  echo "$hb1 1"
else
  echo "$hb1 0"
fi
if ping -c 1 $hb2  &> /dev/null
then
  echo "$hb2 1"
else
  echo "$hb2 0"
fi

[root@haproxy2 zabbix_agentd.d]#


3. Test script heartbeat lines first time

Each of the nodes from the cluster are properly pingable via ICMP protocol

The script has to be run on both haproxy1 and haproxy2 Cluster (load) balancer nodes

[root@haproxy-hb1 zabbix_agentd.d]# /etc/zabbix/scripts/check_heartbeat_lines.sh
haproxy2-hb1 1
haproxy2-hb2 1

[root@haproxy-hb2 zabbix_agentd.d]# /etc/zabbix/scripts/check_heartbeat_lines.sh
haproxy1-hb1 1
haproxy1-hb2 1


The status of 1 returned by the script should be considered remote defined haproxy node is reachable / 0 means ping command does not return any ICMP status pings back.

4. Restart the zabbix-agent on both cluster node machines that will be conducting the ICMP ping check

[root@haproxy zabbix_agentd.d]# systemctl restart zabbix-agentd
[root@haproxy zabbix_agentd.d]# systemctl status zabbix-agentd

[root@haproxy zabbix_agentd.d]# tail -n 100 /var/log/zabbix_agentd.log


5. Create Item to process the userparam script

Create Item as follows:

6. Create the Dependent Item required
 

zabbix-heartbeat-check-screenshots/heartbeat-line1-preprocessing

For processing you need to put the following simple regular expression

Name: Regular Expression
Parameters: hb1(\s+)(\d+)
Custom on fail: \2

zabbix-heartbeat-check-screenshots/heartbeat-line2-preprocessing1

zabbix-heartbeat-check-screenshots/heartbeat-lines-triggers


7. Create triggers that will be generating the Alert

Create the required triggers as well

zabbix-heartbeat-check-screenshots/heartbeat2-line
Main thing to configure here in Zabbix is below expression

Expression: {FQDN:heartbeat2.last()}<1

triggers_heartbeat1

You can further configure Zabbix Alerts to mail yourself or send via Slack / MatterMost or Teams alarms in case of problems.

Monitoring chronyd time service is synchronized, get additional time server values with Zabbix userparameter script

Monday, March 21st, 2022

monitoring-chronyc-time-server-synchronization-zabbix-logo

If you''re running a server infrastructure and your main monitoring system is Zabbix. Then a vital check you might want to setup is to monitor the server time synchronization to a central server. In newer Linux OS-es ntpd time server is started to be used lesser and many modern Linux distributions used in the corporate realm are starting to recommend using chrony as a time synchronization client / server.

In this article, I'll show you how you can quickly setup monitoring of chronyd process and monitoring whether the time is successfully synchronizing with remote Chronyd time server. This will be done with a tiny one liner shell script setup as userparameter It is relatively easy then to setup an Action Alert


1. Create userparameter script to send parsed chronyd time synchronization to Zabbix Server

chronyc tracking provides plenty of useful data which can give many details about info such as offset, skew, root delay, stratum, update interval.

[root@server: ~]# chronyc tracking
Reference ID    : 0A32EF0B (fkf-intp01.intcs.meshcore.net)
Stratum         : 3
Ref time (UTC)  : Fri Mar 18 12:42:31 2022
System time     : 0.000032544 seconds fast of NTP time
Last offset     : +0.000031102 seconds
RMS offset      : 0.000039914 seconds
Frequency       : 3.037 ppm slow
Residual freq   : +0.000 ppm
Skew            : 0.023 ppm
Root delay      : 0.017352410 seconds
Root dispersion : 0.004285847 seconds
Update interval : 1041.6 seconds
Leap status     : Normal

[root@server zabbix_agentd.d]# cat userparameter_chrony.conf 
UserParameter=chrony.json,chronyc -c tracking | sed -e s/'^'/'{"chrony":[“‘/g -e s/’$’/'”]}'/g -e s/','/'","'/g
[root@server zabbix_agentd.d]#

The -c option passed to chronyc is printing the chronyc tracking command ouput data in comma-separated values ( CSV ) format.

2. Create Necessery Item key to get chronyd processes and catch the userparameter data


  • First lets create a an Item key to calculate the chronyd daemon proc.num
    proc.num – simply returns the number of processes in the process list just like a simple
    pgrep servicename command does.


monitroing-chronyc_zabbix_item_report_to-zabbix

Second lets create the Item for the userparameter script, the chrony.json key should be the same as the key given in the userparameter script.

obtain-chronyc-statistic-variables-from-remote-chronyd-to-zabbix-windows

Create Chrony Zabbix Triggers 
 

Expression 

{server-host:proc.num[chronyd].last()}<1


will be triggered if the process of chronyd on the server is less than 1


chronyc_monitoring_process-is-not-running-screenshot

Next configure

{server-host:chrony[Leap status].iregexp[Not synchronised) ]=1


to trigger Alert Chronyd is Not synchronized if the Expression check occurs.

chronyd-is-not-synchronized-trigger-iregexp

Reload the zabbix-agent on the server
 

To make zabbix-agent locally installed on the machine read the userparameter into memory  (in my case this is zabbix-agent-4.0.28-1.el8.x86_64) installed on Redhat 8.3 (Ootpa), you have to restart it.

[root@server: ~]# systemctl restart zabbix-agent
[root@server: ~]# systemctl status zabbix-agent

● zabbix-agent.service – Zabbix Agent
   Loaded: loaded (/usr/lib/systemd/system/zabbix-agent.service; enabled; vendor preset: disabled)
   Active: active (running) since Thu 2021-12-16 16:41:02 CET; 3 months 0 days ago
 Main PID: 862165 (zabbix_agentd)
    Tasks: 6 (limit: 23662)
   Memory: 20.6M
   CGroup: /system.slice/zabbix-agent.service
           ├─862165 /usr/sbin/zabbix_agentd -c /etc/zabbix/zabbix_agentd.conf
           ├─862166 /usr/sbin/zabbix_agentd: collector [idle 1 sec]
           ├─862167 /usr/sbin/zabbix_agentd: listener #1 [waiting for connection]
           ├─862168 /usr/sbin/zabbix_agentd: listener #2 [waiting for connection]
           ├─862169 /usr/sbin/zabbix_agentd: listener #3 [waiting for connection]
           └─862170 /usr/sbin/zabbix_agentd: active checks #1 [idle 1 sec]

Warning: Journal has been rotated since unit was started. Log output is incomplete or unavailable.


In a short while you should be seeing in the chrony.json key History data fed by the userparameter Script.

In Zabbix Latest data, you will see plenty of interesting time synchronization data get reported such as Skew, Stratum, Root Delay, Update Interval, Frequency etc.

chronyd-zabbix-reported-time-synchronization-offset-leap-residual-freq-root-delay-screenshot

To have an email Alerting further, go and setup a new Zabbix Action based on the Trigger with your likings and you're done. 
The tracked machine will be in zabbix to make sure your OS clock is not afar from the time server. Repeat the same steps if you need to track chronyd is up running and synchronized on few machines, or if you have to make it for dozens setup a Zabbix template.

Disable VNC on KVM Virtual Machine without VM restart / How to Change VNC listen address

Monday, February 28th, 2022

disable-vnc-port-listener-on-a-KVM-ran-virtual-machine-virsh-libvirt-libvirt-architecture-design

Say you have recently run a new KVM Virtual machine, have connected via VNC on lets say the default tcp port 5900 
installed a brand new Linux OS using a VNC client to connect, such as:
TightVNC / RealVNC if connecting from Windows Client machine or Vncviewer / Remmina if connecting from Linux / BSD  and now 
you want to turn off the VNC VM listener server either for security reasons to make sure some script kiddie random scanner did not manage to connect and take control over your VM or just because, you will be only further using the new configured VM only via SSH console sessions as they call it in modern times to make a buziness buzz out of it a headless UNIX server (server machines connected a network without a Physical monitor attached to it).


The question comes then how can be the KVM VNC listener on TCP port 5900 be completely disabled?

One way of course is to filter out with a firewall 5900 completely either on a Switch Level (lets say on a Cisco equipment catalist in front of the machine) or the worst solution to  locally filter directly on the server with firewalld or iptables chain rules.
 

1. Disable KVM VNC Port listener via VIRSH VM XML edit

The better way of course  is to completely disable the VNC using KVM, that is possible through the virsh command interface.
By editing the XML Virtual Machine configuration and finding the line about vnc confiuguration with:

root@server:/kvm/disk# virsh edit pcfreakweb
Domain pcfreakweb XML configuration not changed.

like:

<graphics type='vnc' port='5900' autoport='yes' listen='0.0.0.0'>
      <listen type='address' address='0.0.0.0'/>


and set value to undefined:

port='-1'


virsh-KVM-disable-VNC-port-listener-virsh-xml-edit-screenshot

Modifying the XML however will require you to reboot the Virtual Machine for which XML was editted. This might be not possible
if you have a running production server already configured with Apache / Proxy / PostgreSQL / Mail or any other Internet public service.

2. Disable VNC KVM TCP port 5900 to a dynamic running VM without a machine reboot


Thus if you want to remove the KVM VNC Port Listener on 5900 without a VM shutdown / reboot you can do it via KVM's virsh client interface.

root@server:/kvm/disk# virsh
Welcome to virsh, the virtualization interactive terminal.

Type:  'help' for help with commands
       'quit' to quit

virsh # qemu-monitor-command pcfreakweb –hmp change  vnc none


The virsh management user interface client, can do pretty much more of real time VM changes, it is really useful to use it if you have KVM Hypervisor hosts with 10+ Virtual machines and it if you have to deal with KVM machines on daily, do specific changes to the VMs on how VM networks are configured, information on HV hardware, configure / reconfigure storage volumes to VMs etc, take some time to play with it 🙂

List and fix failed systemd failed services after Linux OS upgrade and how to get full info about systemd service from jorunal log

Friday, February 25th, 2022

systemd-logo-unix-linux-list-failed-systemd-services

I have recently upgraded a number of machines from Debian 10 Buster to Debian 11 Bullseye. The update as always has some issues on some machines, such as problem with package dependencies, changing a number of external package repositories etc. to match che Bullseye deb packages. On some machines the update was less painful on others but the overall line was that most of the machines after the update ended up with one or more failed systemd services. It could be that some of the machines has already had this failed services present and I never checked them from the previous time update from Debian 9 -> Debian 10 or just some mess I've left behind in the hurry when doing software installation in the past. This doesn't matter anyways the fact was that I had to deal to a number of systemctl services which I managed to track by the Failed service mesage on system boot on one of the physical machines and on the OpenXen VTY Console the rest of Virtual Machines after update had some Failed messages. Thus I've spend some good amount of time like an overall of a day or two fixing strange failed services. This is how this small article was born in attempt to help sysadmins or any home Linux desktop users, who has updated his Debian Linux / Ubuntu or any other deb based distribution but due to the chaotic nature of Linux has ended with same strange Failed services and look for a way to find the source of the failures and get rid of the problems. 
Systemd is a very complicated system and in my many sysadmin opinion it makes more problems than it solves, but okay for today's people's megalomania mindset it matches well.

Systemd_components-systemd-journalctl-cgroups-loginctl-nspawn-analyze.svg


1. Check the journal for errors, running service irregularities and so on
 

First thing to do to track for errors, right after the update is to take some minutes and closely check,, the journalctl for any strange errors, even on well maintained Unix machines, this journal log would bring you to a problem that is not fatal but still some process or stuff is malfunctioning in the background that you would like to solve:
 

root@pcfreak:~# journalctl -x
Jan 10 10:10:01 pcfreak CRON[17887]: pam_unix(cron:session): session closed for user root
Jan 10 10:10:01 pcfreak audit[17887]: USER_END pid=17887 uid=0 auid=0 ses=340858 subj==unconfined msg='op=PAM:session_close grantors=pam_loginuid,pam_env,pam_env,pam_permit>
Jan 10 10:10:01 pcfreak audit[17888]: CRED_DISP pid=17888 uid=0 auid=0 ses=340860 subj==unconfined msg='op=PAM:setcred grantors=pam_permit acct="root" exe="/usr/sbin/cron" >
Jan 10 10:10:01 pcfreak CRON[17888]: pam_unix(cron:session): session closed for user root
Jan 10 10:10:01 pcfreak audit[17888]: USER_END pid=17888 uid=0 auid=0 ses=340860 subj==unconfined msg='op=PAM:session_close grantors=pam_loginuid,pam_env,pam_env,pam_permit>
Jan 10 10:10:01 pcfreak audit[17884]: CRED_DISP pid=17884 uid=0 auid=0 ses=340855 subj==unconfined msg='op=PAM:setcred grantors=pam_permit acct="root" exe="/usr/sbin/cron" >
Jan 10 10:10:01 pcfreak CRON[17884]: pam_unix(cron:session): session closed for user root
Jan 10 10:10:01 pcfreak audit[17884]: USER_END pid=17884 uid=0 auid=0 ses=340855 subj==unconfined msg='op=PAM:session_close grantors=pam_loginuid,pam_env,pam_env,pam_permit>
Jan 10 10:10:01 pcfreak audit[17886]: CRED_DISP pid=17886 uid=0 auid=33 ses=340859 subj==unconfined msg='op=PAM:setcred grantors=pam_permit acct="www-data" exe="/usr/sbin/c>
Jan 10 10:10:01 pcfreak CRON[17886]: pam_unix(cron:session): session closed for user www-data
Jan 10 10:10:01 pcfreak audit[17886]: USER_END pid=17886 uid=0 auid=33 ses=340859 subj==unconfined msg='op=PAM:session_close grantors=pam_loginuid,pam_env,pam_env,pam_permi>
Jan 10 10:10:08 pcfreak NetworkManager[696]:  [1641802208.0899] device (eth1): carrier: link connected
Jan 10 10:10:08 pcfreak kernel: r8169 0000:03:00.0 eth1: Link is Up – 100Mbps/Full – flow control rx/tx
Jan 10 10:10:08 pcfreak kernel: r8169 0000:03:00.0 eth1: Link is Down
Jan 10 10:10:19 pcfreak NetworkManager[696]:
 [1641802219.7920] device (eth1): carrier: link connected
Jan 10 10:10:19 pcfreak kernel: r8169 0000:03:00.0 eth1: Link is Up – 100Mbps/Full – flow control rx/tx
Jan 10 10:10:20 pcfreak kernel: r8169 0000:03:00.0 eth1: Link is Down
Jan 10 10:10:22 pcfreak NetworkManager[696]:
 [1641802222.2772] device (eth1): carrier: link connected
Jan 10 10:10:22 pcfreak kernel: r8169 0000:03:00.0 eth1: Link is Up – 100Mbps/Full – flow control rx/tx
Jan 10 10:10:23 pcfreak kernel: r8169 0000:03:00.0 eth1: Link is Down
Jan 10 10:10:33 pcfreak sshd[18142]: Unable to negotiate with 66.212.17.162 port 19255: no matching key exchange method found. Their offer: diffie-hellman-group14-sha1,diff>
Jan 10 10:10:41 pcfreak NetworkManager[696]:
 [1641802241.0186] device (eth1): carrier: link connected
Jan 10 10:10:41 pcfreak kernel: r8169 0000:03:00.0 eth1: Link is Up – 100Mbps/Full – flow control rx/tx

If you want to only check latest journal log messages use the -x -e (pager catalog) opts

root@pcfreak;~# journalctl -xe

Feb 25 13:08:29 pcfreak audit[2284920]: USER_LOGIN pid=2284920 uid=0 auid=4294967295 ses=4294967295 subj==unconfined msg='op=login acct=28696E76616C>
Feb 25 13:08:29 pcfreak sshd[2284920]: Received disconnect from 177.87.57.145 port 40927:11: Bye Bye [preauth]
Feb 25 13:08:29 pcfreak sshd[2284920]: Disconnected from invalid user ubuntuuser 177.87.57.145 port 40927 [preauth]

Next thing to after the update was to get a list of failed service only.


2. List all systemd failed check services which was supposed to be running

root@pcfreak:/root # systemctl list-units | grep -i failed
● certbot.service                                                                                                       loaded failed failed    Certbot
● logrotate.service                                                                                                     loaded failed failed    Rotate log files
● maldet.service                                                                                                        loaded failed failed    LSB: Start/stop maldet in monitor mode
● named.service                                                                                                         loaded failed failed    BIND Domain Name Server


Alternative way is with the –failed option

hipo@jeremiah:~$ systemctl list-units –failed
  UNIT                        LOAD   ACTIVE SUB    DESCRIPTION
● haproxy.service             loaded failed failed HAProxy Load Balancer
● libvirt-guests.service      loaded failed failed Suspend/Resume Running libvirt Guests
● libvirtd.service            loaded failed failed Virtualization daemon
● nvidia-persistenced.service loaded failed failed NVIDIA Persistence Daemon
● sqwebmail.service           masked failed failed sqwebmail.service
● tpm2-abrmd.service          loaded failed failed TPM2 Access Broker and Resource Management Daemon
● wd_keepalive.service        loaded failed failed LSB: Start watchdog keepalive daemon

LOAD   = Reflects whether the unit definition was properly loaded.
ACTIVE = The high-level unit activation state, i.e. generalization of SUB.
SUB    = The low-level unit activation state, values depend on unit type.
7 loaded units listed.


root@jeremiah:/etc/apt/sources.list.d#  systemctl list-units –failed
  UNIT                        LOAD   ACTIVE SUB    DESCRIPTION
● haproxy.service             loaded failed failed HAProxy Load Balancer
● libvirt-guests.service      loaded failed failed Suspend/Resume Running libvirt Guests
● libvirtd.service            loaded failed failed Virtualization daemon
● nvidia-persistenced.service loaded failed failed NVIDIA Persistence Daemon
● sqwebmail.service           masked failed failed sqwebmail.service
● tpm2-abrmd.service          loaded failed failed TPM2 Access Broker and Resource Management Daemon
● wd_keepalive.service        loaded failed failed LSB: Start watchdog keepalive daemon


To get a full list of objects of systemctl you can pass as state:
 

# systemctl –state=help
Full list of possible load states to pass is here
Show service properties


Check whether a service is failed or has other status and check default set systemd variables for it.

root@jeremiah~:# systemctl is-failed vboxweb.service
inactive

# systemctl show haproxy
Type=notify
Restart=always
NotifyAccess=main
RestartUSec=100ms
TimeoutStartUSec=1min 30s
TimeoutStopUSec=1min 30s
TimeoutAbortUSec=1min 30s
TimeoutStartFailureMode=terminate
TimeoutStopFailureMode=terminate
RuntimeMaxUSec=infinity
WatchdogUSec=0
WatchdogTimestampMonotonic=0
RootDirectoryStartOnly=no
RemainAfterExit=no
GuessMainPID=yes
SuccessExitStatus=143
MainPID=304858
ControlPID=0
FileDescriptorStoreMax=0
NFileDescriptorStore=0
StatusErrno=0
Result=success
ReloadResult=success
CleanResult=success

Full output of the above command is dumped in show_systemctl_properties.txt


3. List all running systemd services for a better overview on what's going on on machine
 

To get a list of all properly systemd loaded services you can use –state running.

hipo@jeremiah:~$ systemctl list-units –state running|head -n 10
  UNIT                              LOAD   ACTIVE SUB     DESCRIPTION
  proc-sys-fs-binfmt_misc.automount loaded active running Arbitrary Executable File Formats File System Automount Point
  cups.path                         loaded active running CUPS Scheduler
  init.scope                        loaded active running System and Service Manager
  session-2.scope                   loaded active running Session 2 of user hipo
  accounts-daemon.service           loaded active running Accounts Service
  anydesk.service                   loaded active running AnyDesk
  apache-htcacheclean.service       loaded active running Disk Cache Cleaning Daemon for Apache HTTP Server
  apache2.service                   loaded active running The Apache HTTP Server
  avahi-daemon.service              loaded active running Avahi mDNS/DNS-SD Stack


It is useful thing is to list all unit-files configured in systemd and their state, you can do it with:


root@pcfreak:~# systemctl list-unit-files
UNIT FILE                                                                 STATE           VENDOR PRESET
proc-sys-fs-binfmt_misc.automount                                         static          –            
-.mount                                                                   generated       –            
backups.mount                                                             generated       –            
dev-hugepages.mount                                                       static          –            
dev-mqueue.mount                                                          static          –            
media-cdrom0.mount                                                        generated       –            
mnt-sda1.mount                                                            generated       –            
proc-fs-nfsd.mount                                                        static          –            
proc-sys-fs-binfmt_misc.mount                                             disabled        disabled     
run-rpc_pipefs.mount                                                      static          –            
sys-fs-fuse-connections.mount                                             static          –            
sys-kernel-config.mount                                                   static          –            
sys-kernel-debug.mount                                                    static          –            
sys-kernel-tracing.mount                                                  static          –            
var-www.mount                                                             generated       –            
acpid.path                                                                masked          enabled      
cups.path                                                                 enabled         enabled      


root@pcfreak:~# systemctl list-units –type service –all
  UNIT                                   LOAD      ACTIVE   SUB     DESCRIPTION
  accounts-daemon.service                loaded    inactive dead    Accounts Service
  acct.service                           loaded    active   exited  Kernel process accounting
● alsa-restore.service                   not-found inactive dead    alsa-restore.service
● alsa-state.service                     not-found inactive dead    alsa-state.service
  apache2.service                        loaded    active   running The Apache HTTP Server
● apparmor.service                       not-found inactive dead    apparmor.service
  apt-daily-upgrade.service              loaded    inactive dead    Daily apt upgrade and clean activities
 apt-daily.service                      loaded    inactive dead    Daily apt download activities
  atd.service                            loaded    active   running Deferred execution scheduler
  auditd.service                         loaded    active   running Security Auditing Service
  auth-rpcgss-module.service             loaded    inactive dead    Kernel Module supporting RPCSEC_GSS
  avahi-daemon.service                   loaded    active   running Avahi mDNS/DNS-SD Stack
  certbot.service                        loaded    inactive dead    Certbot
  clamav-daemon.service                  loaded    active   running Clam AntiVirus userspace daemon
  clamav-freshclam.service               loaded    active   running ClamAV virus database updater
..


linux-systemd-components-diagram-linux-kernel-system-targets-systemd-libraries-daemons


4. Finding out more on why a systemd configured service has failed


Usually getting info about failed systemd service is done with systemctl status servicename.service
However, in case of troubles with service unable to start to get more info about why a service has failed with (-l) or (–full) options


root@pcfreak:~# systemctl -l status logrotate.service
● logrotate.service – Rotate log files
     Loaded: loaded (/lib/systemd/system/logrotate.service; static)
     Active: failed (Result: exit-code) since Fri 2022-02-25 00:00:06 EET; 13h ago
TriggeredBy: ● logrotate.timer
       Docs: man:logrotate(8)
             man:logrotate.conf(5)
    Process: 2045320 ExecStart=/usr/sbin/logrotate /etc/logrotate.conf (code=exited, status=1/FAILURE)
   Main PID: 2045320 (code=exited, status=1/FAILURE)
        CPU: 2.479s

Feb 25 00:00:06 pcfreak logrotate[2045577]: 2022/02/25 00:00:06| WARNING: For now we will assume you meant to write /32
Feb 25 00:00:06 pcfreak logrotate[2045577]: 2022/02/25 00:00:06| ERROR: '0.0.0.0/0.0.0.0' needs to be replaced by the term 'all'.
Feb 25 00:00:06 pcfreak logrotate[2045577]: 2022/02/25 00:00:06| SECURITY NOTICE: Overriding config setting. Using 'all' instead.
Feb 25 00:00:06 pcfreak logrotate[2045577]: 2022/02/25 00:00:06| WARNING: (B) '::/0' is a subnetwork of (A) '::/0'
Feb 25 00:00:06 pcfreak logrotate[2045577]: 2022/02/25 00:00:06| WARNING: because of this '::/0' is ignored to keep splay tree searching predictable
Feb 25 00:00:06 pcfreak logrotate[2045577]: 2022/02/25 00:00:06| WARNING: You should probably remove '::/0' from the ACL named 'all'
Feb 25 00:00:06 pcfreak systemd[1]: logrotate.service: Main process exited, code=exited, status=1/FAILURE
Feb 25 00:00:06 pcfreak systemd[1]: logrotate.service: Failed with result 'exit-code'.
Feb 25 00:00:06 pcfreak systemd[1]: Failed to start Rotate log files.
Feb 25 00:00:06 pcfreak systemd[1]: logrotate.service: Consumed 2.479s CPU time.


systemctl -l however is providing only the last log from message a started / stopped or whatever status service has generated. Sometimes systemctl -l servicename.service is showing incomplete the splitted error message as there is a limitation of line numbers on the console, see below


root@pcfreak:~# systemctl status -l certbot.service
● certbot.service – Certbot
     Loaded: loaded (/lib/systemd/system/certbot.service; static)
     Active: failed (Result: exit-code) since Fri 2022-02-25 09:28:33 EET; 4h 0min ago
TriggeredBy: ● certbot.timer
       Docs: file:///usr/share/doc/python-certbot-doc/html/index.html
             https://certbot.eff.org/docs
    Process: 290017 ExecStart=/usr/bin/certbot -q renew (code=exited, status=1/FAILURE)
   Main PID: 290017 (code=exited, status=1/FAILURE)
        CPU: 9.771s

Feb 25 09:28:33 pcfrxen certbot[290017]: The error was: PluginError('An authentication script must be provided with –manual-auth-hook when using th>
Feb 25 09:28:33 pcfrxen certbot[290017]: All renewals failed. The following certificates could not be renewed:
Feb 25 09:28:33 pcfrxen certbot[290017]:   /etc/letsencrypt/live/mail.pcfreak.org-0003/fullchain.pem (failure)
Feb 25 09:28:33 pcfrxen certbot[290017]:   /etc/letsencrypt/live/www.eforia.bg-0005/fullchain.pem (failure)
Feb 25 09:28:33 pcfrxen certbot[290017]:   /etc/letsencrypt/live/zabbix.pc-freak.net/fullchain.pem (failure)
Feb 25 09:28:33 pcfrxen certbot[290017]: 3 renew failure(s), 5 parse failure(s)
Feb 25 09:28:33 pcfrxen systemd[1]: certbot.service: Main process exited, code=exited, status=1/FAILURE
Feb 25 09:28:33 pcfrxen systemd[1]: certbot.service: Failed with result 'exit-code'.
Feb 25 09:28:33 pcfrxen systemd[1]: Failed to start Certbot.
Feb 25 09:28:33 pcfrxen systemd[1]: certbot.service: Consumed 9.771s CPU time.


5. Get a complete log of journal to make sure everything configured on server host runs as it should

Thus to get more complete list of the message and be able to later google and look if has come with a solution on the internet  use:

root@pcfrxen:~#  journalctl –catalog –unit=certbot

— Journal begins at Sat 2022-01-22 21:14:05 EET, ends at Fri 2022-02-25 13:32:01 EET. —
Jan 23 09:58:18 pcfrxen systemd[1]: Starting Certbot…
░░ Subject: A start job for unit certbot.service has begun execution
░░ Defined-By: systemd
░░ Support: https://www.debian.org/support
░░ 
░░ A start job for unit certbot.service has begun execution.
░░ 
░░ The job identifier is 5754.
Jan 23 09:58:20 pcfrxen certbot[124996]: Traceback (most recent call last):
Jan 23 09:58:20 pcfrxen certbot[124996]:   File "/usr/lib/python3/dist-packages/certbot/_internal/renewal.py", line 71, in _reconstitute
Jan 23 09:58:20 pcfrxen certbot[124996]:     renewal_candidate = storage.RenewableCert(full_path, config)
Jan 23 09:58:20 pcfrxen certbot[124996]:   File "/usr/lib/python3/dist-packages/certbot/_internal/storage.py", line 471, in __init__
Jan 23 09:58:20 pcfrxen certbot[124996]:     self._check_symlinks()
Jan 23 09:58:20 pcfrxen certbot[124996]:   File "/usr/lib/python3/dist-packages/certbot/_internal/storage.py", line 537, in _check_symlinks

root@server:~# journalctl –catalog –unit=certbot|grep -i pluginerror|tail -1
Feb 25 09:28:33 pcfrxen certbot[290017]: The error was: PluginError('An authentication script must be provided with –manual-auth-hook when using the manual plugin non-interactively.')


Or if you want to list and read only the last messages in the journal log regarding a service

root@server:~# journalctl –catalog –pager-end –unit=certbot


If you have disabled a failed service because you don't need it to run at all on the machine with:

root@rhel:~# systemctl stop rngd.service
root@rhel:~# systemctl disable rngd.service

And you want to clear up any failed service information that is kept in the systemctl service log you can do it with:
 

root@rhel:~# systemctl reset-failed

Another useful systemctl option is cat, you can use it to easily list a service it is useful to quickly check what is a service, an actual shortcut to save you from giving a full path to the service e.g. cat /lib/systemd/system/certbot.service

root@server:~# systemctl cat certbot
# /lib/systemd/system/certbot.service
[Unit]
Description=Certbot
Documentation=file:///usr/share/doc/python-certbot-doc/html/index.html
Documentation=https://certbot.eff.org/docs
[Service]
Type=oneshot
ExecStart=/usr/bin/certbot -q renew
PrivateTmp=true


After failed SystemD services are fixed, it is best to reboot the machine and check put some more time to inspect rawly the complete journal log to make sure, no error  was left behind.


Closure
 

As you can see updating a machine from a major to a major version even if you follow the official documentation and you have plenty of experience is always more or a less a pain in the ass, which can eat up much of your time banging your head solving problems with failed daemons issues with /etc/rc.local (which I have faced becase of #/bin/sh -e (which would make /etc/rc.local) to immediately quit if any error from command $? returns different from 0 etc.. The  logical questions comes then;
1. Is it really worthy to update at all regularly, especially if you don't know of a famous major Vulnerability 🙂 ?
2. Or is it worthy to update from OS major release to OS major release at all?  
3. Or should you only try to patch the service that is exposed to an external reachable computer network or the internet only and still the the same OS release until End of Life (LTS = Long Term Support) as called in Debian or  End Of Life  (EOL) Cycle as called in RPM based distros the period until the OS major release your software distro has official security patches is reached.

Anyone could take any approach but for my own managed systems small network at home my practice was always to try to keep up2date everything every 3 or 6 months maximum. This has caused me multiple days of irritation and stress and perhaps many white hairs and spend nerves on shit.


4. Based on the company where I'm employed the better strategy is to patch to the EOL is still offered and keep the rule First Things First (FTF), once the EOL is reached, just make a copy of all servers data and configuration to external Data storage, bring up a new Physical or VM and migrate the services.
Test after the migration all works as expected if all is as it should be change the DNS records or Leading Infrastructure Proxies whatever to point to the new service and that's it! Yes it is true that migration based on a full OS reinstall is more time consuming and requires much more planning, but usually the result is much more expected, plus it is much less stressful for the guy doing the job.

How to disable appArmor automatically installed and loaded after Linux Debian 10 to 11 Upgrade. Disable Apparmour on Deb based Linux

Friday, January 28th, 2022

check-apparmor-status-linux-howto-disable-Apparmor_on-debian-ubuntu-mint-and-other-deb-based-linux-distributions

I've upgraded recently all my machines from Debian Buster Linux 10 to Debian 11 Bullseye (if you wonder what Bullseye is) this is one of the heroes of Disneys Toy Stories which are used for a naming of General Debian Distributions.
After the upgrade most of the things worked expected, expect from some stuff like MariaDB (MySQL) and other weirdly behaving services. After some time of investigation being unable to find out what was causing the random issues observed on the machines. I finally got the strange daemon improper functioning and crashing was caused by AppArmor.

AppArmor ("Application Armor") is a Linux kernel security module that allows the system administrator to restrict programs' capabilities with per-program profiles. Profiles can allow capabilities like network access, raw socket access, and the permission to read, write, or execute files on matching paths. AppArmor supplements the traditional Unix discretionary access control (DAC) model by providing mandatory access control (MAC). It has been partially included in the mainline Linux kernel since version 2.6.36 and its development has been supported by Canonical since 2009.

The general idea of apparmor is wonderful as it could really strengthen system security, however it should be setup on install time and not setup on update time. For one more time I got convinced myself that upgrading from version to version to keep up to date with security is a hard task and often the results are too much unexpected and a better way to upgrade from General version to version any modern Linux / Unix distribution (and their forked mobile equivalents Android etc.) is to just make a copy of the most important configuration, setup the services on a freshly new installed machine be it virtual or a physical Server and rebuild the whole system from scratch, test and then run the system in production, substituting the old server general version with the new machine. 

The rest is leading to so much odd issues like this time with AppArmors causing distractions on the servers hosted applications.

But enough rent if you're unlucky and unwise enough to try to Upgrade Debian / Ubuntu 20, 21 / Mint 18, 19 etc. or whatever Deb distro from older general release to a newer One. Perhaps the best first thing to do onwards is stop and remove AppArmor (those who are hardcore enthusiasts could try to enable the failing services due to apparmor), by disabling the respective apparmor hardening profile but i did not have time to waste on stupid stuff and experiment so I preferred to completely stop it. 

To identify the upgrade oddities has to deal with apparmors service enabled security protections you should be able to find respective records inside /var/log/messages as well as in /var/log/audit/audit.log


# dmesg

[   64.210463] audit: type=1400 audit(1548120161.662:21): apparmor="DENIED" operation="sendmsg" info="Failed name lookup – disconnected path" error=-13 profile="/usr/sbin/mysqld" name="run/systemd/notify" pid=2527 comm="mysqld" requested_mask="w" denied_mask="w" fsuid=113 ouid=0
[  144.364055] audit: type=1400 audit(1548120241.595:22): apparmor="DENIED" operation="sendmsg" info="Failed name lookup – disconnected path" error=-13 profile="/usr/sbin/mysqld" name="run/systemd/notify" pid=2527 comm="mysqld" requested_mask="w" denied_mask="w" fsuid=113 ouid=0
[  144.465883] audit: type=1400 audit(1548120241.699:23): apparmor="DENIED" operation="sendmsg" info="Failed name lookup – disconnected path" error=-13 profile="/usr/sbin/mysqld" name="run/systemd/notify" pid=2527 comm="mysqld" requested_mask="w" denied_mask="w" fsuid=113 ouid=0
[  144.566363] audit: type=1400 audit(1548120241.799:24): apparmor="DENIED" operation="sendmsg" info="Failed name lookup – disconnected path" error=-13 profile="/usr/sbin/mysqld" name="run/systemd/notify" pid=2527 comm="mysqld" requested_mask="w" denied_mask="w" fsuid=113 ouid=0
[  144.666722] audit: type=1400 audit(1548120241.899:25): apparmor="DENIED" operation="sendmsg" info="Failed name lookup – disconnected path" error=-13 profile="/usr/sbin/mysqld" name="run/systemd/notify" pid=2527 comm="mysqld" requested_mask="w" denied_mask="w" fsuid=113 ouid=0
[  144.767069] audit: type=1400 audit(1548120241.999:26): apparmor="DENIED" operation="sendmsg" info="Failed name lookup – disconnected path" error=-13 profile="/usr/sbin/mysqld" name="run/systemd/notify" pid=2527 comm="mysqld" requested_mask="w" denied_mask="w" fsuid=113 ouid=0
[  144.867432] audit: type=1400 audit(1548120242.099:27): apparmor="DENIED" operation="sendmsg" info="Failed name lookup – disconnected path" error=-13 profile="/usr/sbin/mysqld" name="run/systemd/notify" pid=2527 comm="mysqld" requested_mask="w" denied_mask="w" fsuid=113 ouid=0


1. How to check if AppArmor is running on the system

If you have a system with enabled apparmor you should get some output like:

root@haproxy2:~# apparmor_status 
apparmor module is loaded.
5 profiles are loaded.
5 profiles are in enforce mode.
   /usr/sbin/ntpd
   lsb_release
   nvidia_modprobe
   nvidia_modprobe//kmod
   tcpdump
0 profiles are in complain mode.
1 processes have profiles defined.
1 processes are in enforce mode.
   /usr/sbin/ntpd (387) 
0 processes are in complain mode.
0 processes are unconfined but have a profile defined.


Also if you check the service you will find out that Debian's Major Release upgrade from 10 Buster to 11 BullsEye with.

apt update -y && apt upgrade -y && apt dist-update -y

automatically installed apparmor and started the service, e.g.:

# systemctl status apparmor
● apparmor.service – Load AppArmor profiles
     Loaded: loaded (/lib/systemd/system/apparmor.service; enabled; vendor pres>
     Active: active (exited) since Sat 2022-01-22 23:04:58 EET; 5 days ago
       Docs: man:apparmor(7)
             https://gitlab.com/apparmor/apparmor/wikis/home/
    Process: 205 ExecStart=/lib/apparmor/apparmor.systemd reload (code=exited, >
   Main PID: 205 (code=exited, status=0/SUCCESS)
        CPU: 43ms

яну 22 23:04:58 haproxy2 apparmor.systemd[205]: Restarting AppArmor
яну 22 23:04:58 haproxy2 apparmor.systemd[205]: Reloading AppArmor profiles
яну 22 23:04:58 haproxy2 systemd[1]: Starting Load AppArmor profiles…
яну 22 23:04:58 haproxy2 systemd[1]: Finished Load AppArmor profiles.


# dpkg -l |grep -i apparmor
ii  apparmor                          2.13.6-10                      amd64        user-space parser utility for AppArmor
ii  libapparmor1:amd64                2.13.6-10                      amd64        changehat AppArmor library
ii  libapparmor-perl:amd64               2.13.6-10


In case AppArmor is disabled, you will get something like:

root@pcfrxenweb:~# aa-status 
apparmor module is loaded.
0 profiles are loaded.
0 profiles are in enforce mode.
0 profiles are in complain mode.
0 processes have profiles defined.
0 processes are in enforce mode.
0 processes are in complain mode.
0 processes are unconfined but have a profile defined.


2. How to disable AppArmor for particular running services processes

In my case after the upgrade of a system running a MySQL Server suddenly out of nothing after reboot the Database couldn't load up properly and if I try to restart it with the usual

root@pcfrxen: /# systemctl restart mariadb

I started getting errors like:

DBI connect failed : Can't connect to local MySQL server through socket '/var/run/mysqld/mysqld.sock' (2)

To get an idea of what kind of profile definitions, could be enabled disabled on apparmor enabled system do:
 

root@pcfrxen:/var/log# ls -1 /etc/apparmor.d/
abstractions/
force-complain/
local/
lxc/
lxc-containers
samba/
system_tor
tunables/
usr.bin.freshclam
usr.bin.lxc-start
usr.bin.man
usr.bin.tcpdump
usr.lib.telepathy
usr.sbin.clamd
usr.sbin.cups-browsed
usr.sbin.cupsd
usr.sbin.ejabberdctl
usr.sbin.mariadbd
usr.sbin.mysqld
usr.sbin.named
usr.sbin.ntpd
usr.sbin.privoxy
usr.sbin.squid

Lets say you want to disable any protection AppArmor profile for MySQL you can do it with:

root@pcfrxen:/ #  ln -s /etc/apparmor.d/usr.sbin.mysqld /etc/apparmor.d/disable/
root@pcfrxen:/ # apparmor_parser -R /etc/apparmor.d/usr.sbin.mysqld 


To make the system know you have disabled a profile you should restart apparmor service:
 

root@pcfrxen:/ # systemctl restart apparmor.service


3. Disable completely AppArmor to save your time weird system behavior and hang bangs

In my opinion the best thing to do anyways, especially if you don't run Containerized applications, that runs only one single application / service at at time is to completely disable apparmor, otherwise you would have to manually check each of the running applications before the upgrade and make sure that apparmor did not bring havoc to some of it.
Hence my way was to simple get rid of apparmor by disable and remove the related package completely out of the system to do so:

root@pcfrxen:/ # systemctl stop apparmor
root@pcfrxen:/ # systemctl disable apparmor
root@pcfrxen:/ # apt-get remove -y apparmor

Once  disabled to make the system completely load out anything loaded related to apparmor loaded into system memory, you should do machine reboot.

root@pcfrxen:/ # shutdown -r now

Hopefully if you run into same issue after removal of apparmor most of the things should be working fine after the upgrade. Anyways I had to go through each and every app everywhere and make sure it is working as expected. The major release upgrade has also automatically enabled me some of the already disable services, thus if you have upgraded like me I would advice you do a close check on every enabled / running service everywhere:

root@pcfrxen:/# systemctl list-unit-files|grep -i enabled

Beware of AppArmor  !!! 🙂

Install and enable Sysstats IO / DIsk / CPU / Network monitoring console suite on Redhat 8.3, Few sar useful command examples

Tuesday, September 28th, 2021

linux-sysstat-monitoring-logo


Why to monitoring CPU, Memory, Hard Disk, Network usage etc. with sysstats tools?
 

Using system monitoring tools such as Zabbix, Nagios Monit is a good approach, however sometimes due to zabbix server interruptions you might not be able to track certain aspects of system performance on time. Thus it is always a good idea to 
Gain more insights on system peroformance from command line. Of course there is cmd tools such as iostat and top, free, vnstat that provides plenty of useful info on system performance issues or bottlenecks. However from my experience to have a better historical data that is systimized and all the time accessible from console it is a great thing to have sysstat package at place. Since many years mostly on every server I administer, I've been using sysstats to monitor what is going on servers over a short time frames and I'm quite happy with it. In current company we're using Redhats and CentOS-es and I had to install sysstats on Redhat 8.3. I've earlier done it multiple times on Debian / Ubuntu Linux and while I've faced on some .deb distributions complications of making sysstat collect statistics I've come with an article on Howto fix sysstat Cannot open /var/log/sysstat/sa no such file or directory” on Debian / Ubuntu Linux
 

Sysstat contains the following tools related to collecting I/O and CPU statistics:
iostat
Displays an overview of CPU utilization, along with I/O statistics for one or more disk drives.
mpstat
Displays more in-depth CPU statistics.
Sysstat also contains tools that collect system resource utilization data and create daily reports based on that data. These tools are:
sadc
Known as the system activity data collector, sadc collects system resource utilization information and writes it to a file.
sar
Producing reports from the files created by sadc, sar reports can be generated interactively or written to a file for more intensive analysis.

My experience with CentOS 7 and Fedora to install sysstat it was pretty straight forward, I just had to install it via yum install sysstat wait for some time and use sar (System Activity Reporter) tool to report collected system activity info stats over time.
Unfortunately it seems on RedHat 8.3 as well as on CentOS 8.XX instaling sysstats does not work out of the box.

To complete a successful installation of it on RHEL 8.3, I had to:

[root@server ~]# yum install -y sysstat


To make sysstat enabled on the system and make it run, I've enabled it in sysstat

[root@server ~]# systemctl enable sysstat


Running immediately sar command, I've faced the shitty error:


Cannot open /var/log/sysstat/sa18:
No such file or directory. Please check if data collecting is enabled”


Once installed I've waited for about 5 minutes hoping, that somehow automatically sysstat would manage it but it didn't.

To solve it, I've had to create additionally file /etc/cron.d/sysstat (weirdly RPM's post install instructions does not tell it to automatically create it)

[root@server ~]# vim /etc/cron.d/sysstat

# run system activity accounting tool every 10 minutes
0 * * * * root /usr/lib64/sa/sa1 60 59 &
# generate a daily summary of process accounting at 23:53
53 23 * * * root /usr/lib64/sa/sa2 -A &


  • /usr/local/lib/sa1 is a shell script that we can use for scheduling cron which will create daily binary log file.
  • /usr/local/lib/sa2 is a shell script will change binary log file to human-readable form.


[root@server ~]# chmod 600 /etc/cron.d/sysstat

[root@server ~]# systemctl restart sysstat


In a while if sysstat is working correctly you should get produced its data history logs inside /var/log/sa

[root@server ~]# ls -al /var/log/sa 


Note that the standard sysstat history files on Debian and other modern .deb based distros such as Debian 10 (in  y.2021) is stored under /var/log/sysstat

Here is few useful uses of sysstat cmds


1. Check with sysstat machine history SWAP and RAM Memory use


To lets say check last 10 minutes SWAP memory use:

[hipo@server yum.repos.d] $ sar -W  |last -n 10
 

Linux 4.18.0-240.el8.x86_64 (server)       09/28/2021      _x86_64_        (8 CPU)

12:00:00 AM  pswpin/s pswpout/s
12:00:01 AM      0.00      0.00
12:01:01 AM      0.00      0.00
12:02:01 AM      0.00      0.00
12:03:01 AM      0.00      0.00
12:04:01 AM      0.00      0.00
12:05:01 AM      0.00      0.00
12:06:01 AM      0.00      0.00

[root@ccnrlb01 ~]# sar -r | tail -n 10
14:00:01        93008   1788832     95.06         0   1357700    725740      9.02    795168    683484        32
14:10:01        78756   1803084     95.81         0   1358780    725740      9.02    827660    652248        16
14:20:01        92844   1788996     95.07         0   1344332    725740      9.02    813912    651620        28
14:30:01        92408   1789432     95.09         0   1344612    725740      9.02    816392    649544        24
14:40:01        91740   1790100     95.12         0   1344876    725740      9.02    816948    649436        36
14:50:01        91688   1790152     95.13         0   1345144    725740      9.02    817136    649448        36
15:00:02        91544   1790296     95.14         0   1345448    725740      9.02    817472    649448        36
15:10:01        91108   1790732     95.16         0   1345724    725740      9.02    817732    649340        36
15:20:01        90844   1790996     95.17         0   1346000    725740      9.02    818016    649332        28
Average:        93473   1788367     95.03         0   1369583    725074      9.02    800965    671266        29


2. Check system load? Are my processes waiting too long to run on the CPU?

[root@server ~ ]# sar -q |head -n 10
Linux 4.18.0-240.el8.x86_64 (server)       09/28/2021      _x86_64_        (8 CPU)

12:00:00 AM   runq-sz  plist-sz   ldavg-1   ldavg-5  ldavg-15   blocked
12:00:01 AM         0       272      0.00      0.02      0.00         0
12:01:01 AM         1       271      0.00      0.02      0.00         0
12:02:01 AM         0       268      0.00      0.01      0.00         0
12:03:01 AM         0       268      0.00      0.00      0.00         0
12:04:01 AM         1       271      0.00      0.00      0.00         0
12:05:01 AM         1       271      0.00      0.00      0.00         0
12:06:01 AM         1       265      0.00      0.00      0.00         0


3. Show various CPU statistics per CPU use
 

On a multiprocessor, multi core server sometimes for scripting it is useful to fetch processor per use historic data, 
this can be attained with:


[hipo@server ~ ] $ mpstat -P ALL
Linux 4.18.0-240.el8.x86_64 (server)       09/28/2021      _x86_64_        (8 CPU)

06:08:38 PM  CPU    %usr   %nice    %sys %iowait    %irq   %soft  %steal  %guest  %gnice   %idle
06:08:38 PM  all    0.17    0.02    0.25    0.00    0.05    0.02    0.00    0.00    0.00   99.49
06:08:38 PM    0    0.22    0.02    0.28    0.00    0.06    0.03    0.00    0.00    0.00   99.39
06:08:38 PM    1    0.28    0.02    0.36    0.00    0.08    0.02    0.00    0.00    0.00   99.23
06:08:38 PM    2    0.27    0.02    0.31    0.00    0.06    0.01    0.00    0.00    0.00   99.33
06:08:38 PM    3    0.15    0.02    0.22    0.00    0.03    0.01    0.00    0.00    0.00   99.57
06:08:38 PM    4    0.13    0.02    0.20    0.01    0.03    0.01    0.00    0.00    0.00   99.60
06:08:38 PM    5    0.14    0.02    0.27    0.00    0.04    0.06    0.01    0.00    0.00   99.47
06:08:38 PM    6    0.10    0.02    0.17    0.00    0.04    0.02    0.00    0.00    0.00   99.65
06:08:38 PM    7    0.09    0.02    0.15    0.00    0.02    0.01    0.00    0.00    0.00   99.70


sar-sysstat-cpu-statistics-screenshot

Monitor processes and threads currently being managed by the Linux kernel.

[hipo@server ~ ] $ pidstat

pidstat-various-random-process-statistics

[hipo@server ~ ] $ pidstat -d 2


pidstat-show-processes-with-most-io-activities-linux-screenshot

This report tells us that there is few processes with heave I/O use Filesystem system journalling daemon jbd2, apache, mysqld and supervise, in 3rd column you see their respective PID IDs.

To show threads used inside a process (like if you press SHIFT + H) inside Linux top command:

[hipo@server ~ ] $ pidstat -t -p 10765 1 3

Linux 4.19.0-14-amd64 (server)     28.09.2021     _x86_64_    (10 CPU)

21:41:22      UID      TGID       TID    %usr %system  %guest   %wait    %CPU   CPU  Command
21:41:23      108     10765         –    1,98    0,99    0,00    0,00    2,97     1  mysqld
21:41:23      108         –     10765    0,00    0,00    0,00    0,00    0,00     1  |__mysqld
21:41:23      108         –     10768    0,00    0,00    0,00    0,00    0,00     0  |__mysqld
21:41:23      108         –     10771    0,00    0,00    0,00    0,00    0,00     5  |__mysqld
21:41:23      108         –     10784    0,00    0,00    0,00    0,00    0,00     7  |__mysqld
21:41:23      108         –     10785    0,00    0,00    0,00    0,00    0,00     6  |__mysqld
21:41:23      108         –     10786    0,00    0,00    0,00    0,00    0,00     2  |__mysqld

10765 – is the Process ID whose threads you would like to list

With pidstat, you can further monitor processes for memory leaks with:

[hipo@server ~ ] $ pidstat -r 2


4. Report paging statistics for some old period


[root@server ~ ]# sar -B -f /var/log/sa/sa27 |head -n 10
Linux 4.18.0-240.el8.x86_64 (server)       09/27/2021      _x86_64_        (8 CPU)

15:42:26     LINUX RESTART      (8 CPU)

15:55:30     LINUX RESTART      (8 CPU)

04:00:01 PM  pgpgin/s pgpgout/s   fault/s  majflt/s  pgfree/s pgscank/s pgscand/s pgsteal/s    %vmeff
04:01:01 PM      0.00     14.47    629.17      0.00    502.53      0.00      0.00      0.00      0.00
04:02:01 PM      0.00     13.07    553.75      0.00    419.98      0.00      0.00      0.00      0.00
04:03:01 PM      0.00     11.67    548.13      0.00    411.80      0.00      0.00      0.00      0.00


5.  Monitor Received RX and Transmitted TX network traffic perl Network interface real time
 

To print out Received and Send traffic per network interface 4 times in a raw

sar-sysstats-network-traffic-statistics-screenshot
 

[hipo@server ~ ] $ sar -n DEV 1 4


To continusly monitor all network interfaces I/O traffic

[hipo@server ~ ] $ sar -n DEV 1


To only monitor a certain network interface lets say loopback interface (127.0.0.1) received / transmitted bytes

[hipo@server yum.repos.d] $  sar -n DEV 1 2|grep -i lo
06:29:53 PM        lo      0.00      0.00      0.00      0.00      0.00      0.00      0.00      0.00
06:29:54 PM        lo      0.00      0.00      0.00      0.00      0.00      0.00      0.00      0.00
Average:           lo      0.00      0.00      0.00      0.00      0.00      0.00      0.00      0.00


6. Monitor block devices use
 

To check block devices use 3 times in a raw
 

[hipo@server yum.repos.d] $ sar -d 1 3


sar-sysstats-blockdevice-statistics-screenshot
 

7. Output server monitoring data in CSV database structured format


For preparing a nice graphs with Excel from CSV strucuted file format, you can dump the collected data as so:

 [root@server yum.repos.d]# sadf -d /var/log/sa/sa27 — -n DEV | grep -v lo|head -n 10
server-name-fqdn;-1;2021-09-27 13:42:26 UTC;LINUX-RESTART    (8 CPU)
# hostname;interval;timestamp;IFACE;rxpck/s;txpck/s;rxkB/s;txkB/s;rxcmp/s;txcmp/s;rxmcst/s;%ifutil
server-name-fqdn;-1;2021-09-27 13:55:30 UTC;LINUX-RESTART    (8 CPU)
# hostname;interval;timestamp;IFACE;rxpck/s;txpck/s;rxkB/s;txkB/s;rxcmp/s;txcmp/s;rxmcst/s;%ifutil
server-name-fqdn;60;2021-09-27 14:01:01 UTC;eth1;19.42;16.12;1.94;1.68;0.00;0.00;0.00;0.00
server-name-fqdn;60;2021-09-27 14:01:01 UTC;eth0;7.18;9.65;0.55;0.78;0.00;0.00;0.00;0.00
server-name-fqdn;60;2021-09-27 14:01:01 UTC;eth2;5.65;5.13;0.42;0.39;0.00;0.00;0.00;0.00
server-name-fqdn;60;2021-09-27 14:02:01 UTC;eth1;18.90;15.55;1.89;1.60;0.00;0.00;0.00;0.00
server-name-fqdn;60;2021-09-27 14:02:01 UTC;eth0;7.15;9.63;0.55;0.74;0.00;0.00;0.00;0.00
server-name-fqdn;60;2021-09-27 14:02:01 UTC;eth2;5.67;5.15;0.42;0.39;0.00;0.00;0.00;0.00

To graph the output data you can use Excel / LibreOffice's Excel equivalent Calc or if you need to dump a CSV sar output and generate it on the fly from a script  use gnuplot 


What we've learned?


How to install and enable on cron sysstats on Redhat and CentOS 8 Linux ? 
How to continuously monitor CPU / Disk and Network, block devices, paging use and processes and threads used by the kernel per process ?  
As well as how to export previously collected data to CSV to import to database or for later use inrder to generate graphic presentation of data.
Cheers ! 🙂