Gcpl
•
3 likes•4,016 views

Godrej Consumer Products Ltd is initiating coverage as a "Buy" recommendation with a target price of Rs. 588.7, representing an upside of approximately 33%. Key reasons include strong growth in household insecticides in India and global acquisitions driving consolidated revenue growth of 28.4% annually over the forecast period. The international business is expected to be a major driver of growth, with revenues growing at 43.6% annually. Product and technology synergies across geographies backed by disruptive innovations will provide an edge over peers.


Gcpl
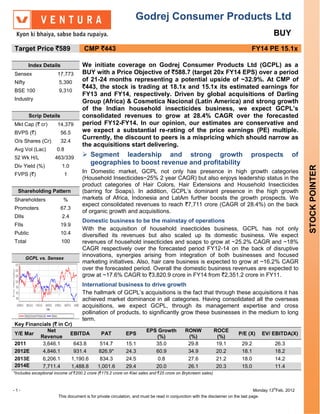
- 1. Godrej Consumer Products Ltd BUY Target Price `589 CMP `443 FY14 PE 15.1x Index Details We initiate coverage on Godrej Consumer Products Ltd (GCPL) as a Sensex 17,773 BUY with a Price Objective of `588.7 (target 20x FY14 EPS) over a period Nifty 5,390 of 21-24 months representing a potential upside of ~32.9%. At CMP of `443, the stock is trading at 18.1x and 15.1x its estimated earnings for BSE 100 9,310 FY13 and FY14, respectively. Driven by global acquisitions of Darling Industry Group (Africa) & Cosmetica Nacional (Latin America) and strong growth of the Indian household insecticides business, we expect GCPL’s Scrip Details consolidated revenues to grow at 28.4% CAGR over the forecasted Mkt Cap (` cr) 14,379 period FY12-FY14. In our opinion, our estimates are conservative and BVPS (`) 56.5 we expect a substantial re-rating of the price earnings (PE) multiple. Currently, the discount to peers is a mispricing which should narrow as O/s Shares (Cr) 32.4 the acquisitions start delivering. Avg Vol (Lac) 0.8 52 Wk H/L 463/339 Segment leadership and strong growth prospects of Div Yield (%) 1.0 geographies to boost revenue and profitability STOCK POINTER FVPS (`) 1 In Domestic market, GCPL not only has presence in high growth categories (Household Insecticides~25% 2 year CAGR) but also enjoys leadership status in the product categories of Hair Colors, Hair Extensions and Household Insecticides Shareholding Pattern (barring for Soaps). In addition, GCPL’s dominant presence in the high growth Shareholders % markets of Africa, Indonesia and LatAm further boosts the growth prospects. We expect consolidated revenues to reach `7,711 crore (CAGR of 28.4%) on the back Promoters 67.3 of organic growth and acquisitions. DIIs 2.4 Domestic business to be the mainstay of operations FIIs 19.9 With the acquisition of household insecticides business, GCPL has not only Public 10.4 diversified its revenues but also scaled up its domestic business. We expect Total 100 revenues of household insecticides and soaps to grow at ~25.2% CAGR and ~18% CAGR respectively over the forecasted period FY12-14 on the back of disruptive GCPL vs. Sensex innovations, synergies arising from integration of both businesses and focused marketing initiatives. Also, hair care business is expected to grow at ~16.2% CAGR over the forecasted period. Overall the domestic business revenues are expected to grow at ~17.6% CAGR to `3,820.9 crore in FY14 from `2,351.2 crore in FY11. International business to drive growth The hallmark of GCPL’s acquisitions is the fact that through these acquisitions it has achieved market dominance in all categories. Having consolidated all the overseas acquisitions, we expect GCPL, through its management expertise and cross pollination of products, to significantly grow these businesses in the medium to long term. Key Financials (` in Cr) Net EPS Growth RONW ROCE Y/E Mar EBITDA PAT EPS P/E (X) EV/ EBITDA(X) Revenue (%) (%) (%) 2011 3,646.1 643.8 514.7 15.1 35.0 29.8 19.1 29.2 26.3 2012E 4,846.1 931.4 826.9* 24.3 60.9 34.9 20.2 18.1 18.2 2013E 6,206.1 1,190.6 834.3 24.5 0.8 27.6 21.2 18.0 14.2 2014E 7,711.4 1,488.8 1,001.6 29.4 20.0 26.1 20.3 15.0 11.4 *Includes exceptional income of `200.2 crore (`175.2 crore on Kiwi sales and `25 crore on Brylcreem sales) -1- Monday 13thFeb, 2012 This document is for private circulation, and must be read in conjunction with the disclaimer on the last page.
- 2. Accordingly, we expect the international business revenues to grow at ~43.6% CAGR to `3,890 crore by FY14. Immense Product/Technology synergies amongst geographies backed by disruptive innovations to provide an edge against peers We expect cross-pollination of a large number of products across the different markets in which the company has a presence (e.g. potential launch of HIT magic paper in India). This is a major leverage that GCPL can draw on from its wide global offering. We expect many potential product synergies to play out over the next 2-3 years and add further scale to GCPL’s operations. Valuation We initiate coverage on Godrej Consumer Products Ltd (GCPL) as a BUY with a Price Objective of `588.7 (target 20x FY14 EPS) over a period of 21-24 months representing a potential upside of ~32.9%. At CMP of `443, the stock is trading at 18.1x and 15.1x its estimated earnings for FY13 and FY14, respectively. We have valued the stock at ~31.5% discount to Hindustan Unilever Ltd’s valuation of 29.2x FY13 EPS (as per Ventura estimates). Driven by global acquisitions of Darling Group in Africa and Cosmetica Nacional in Latin America and strong growth of the Indian household insecticides business, we expect GCPL’s consolidated revenues to grow at ~28.4% CAGR over the forecasted period FY12-FY14. In our opinion, our estimates are conservative and we expect a substantial re-rating of the price earnings (PE) multiple. th -2- Monday 13 Feb, 2012 This document is for private circulation, and must be read in conjunction with the disclaimer on the last page.
- 3. Company Background Godrej Consumer Products Limited (GCPL),the flagship company of Godrej Group earlier operated in two categories - soaps and hair colors till FY09. Post FY09, GCPL overhauled its business as per a new “3 X 3” strategy that involves having a presence in three categories across three continents. The household insecticides business (which was earlier a joint venture between another Godrej group company and Sara Lee) was merged into GCPL. GCPL manufactures and distributes personal wash, home care and hair care rd products in India and internationally (1/3 of revenues come from international operations). The company also has a strong emerging presence in markets outside India. With the acquisition of Keyline Brands in the United Kingdom, Rapidol, Kinky Group, Tura, Darling Group in Africa and Issue Group, Argencos, Cosmetica Nacional in Latin America, GCPL is best placed to benefit from presence across these emerging markets. As part of increasing its global footprint, the company has also acquired Megasari Group, a leading household care company in Indonesia. GCPL’s Brand Portfolio Godrej Consumer Products Ltd (GCPL) Domestic Operations International Operations (Segments) (Regions) Home Care Hair Care Personal Wash Af rica Indonesia LatAm UK BRANDS: BRANDS: BRANDS: - Godrej Acquisitions Acquisitions Acquisitions - Good Knight Expert - Cinthol Acquisitions - Rapidol (July 06) - Issue Group - Keyline - HIT - Renew - Godrej Protekt - Megasari (May 10) - Kinky Group (Apr Makmur Group Brands (Oct 05) - Jet - Colour Sof t - Godrej No.1 - Argencos (June 08) (May 10) - Ezee - Nupur - Godrej - Tura (Mar 10) 10) - Godtej Dish Fairglow - Cosmetica - Kesh Kala - Darling Group Wash - Godrej Vigil (Jun 11) Nacional (Jan 12) BRANDS: - Kali Mehandi - Genteel - Shikakai - Cuticura - Anoop Hair BRANDS: Oil - Swatik - Nulon - HIT - Stella - Aapri BRANDS: BRANDS - Fogo - Erasmic - Inecto - Consell - Others - Denney - Sof lene - Others - Issue - Roby - Illicit - U2 - Pamela Grant Source: GCPL, Ventura Research Estimates th -3- Monday 13 Feb, 2012 This document is for private circulation, and must be read in conjunction with the disclaimer on the last page.
- 4. Key Investment Highlights Segment leadership and strong growth prospects across geographies to boost revenues and profitability Barring for soaps, in the product categories of Hair Colors, Hair Extensions and Household Insecticides, GCPL enjoys leadership status. The reformulated 3x3 growth strategy has enabled the company to consolidate its product portfolio and market dominance and more than double its revenues from `1,396.6 crore in FY09 to `3,646.1 crore in FY11.We expect the company to continue to maintain this pace of growth over FY14. Accordingly, revenues are expected to reach `7,711 crore (CAGR of 28.4%) by FY14on the back of organic growth and acquisitions. Revenue and Profitability trend GCPL’s current market share 9000 25% 42% 8000 20.1% 19.3% 19.2% 19.2% 36% 7000 17.7% 20% 30% In Rs. Crore 6000 14.3% 17.7% 15% 5000 16.6% 24% 14.1% 14.5% 39.7% 4000 7,711 18% 10% 3000 6,206 28.7% 4,846 12% 2000 3,646 5% 1000 2,044 6% 10.1% 0 0% 0% FY10 FY11 FY12E FY13E FY14E Home Care - Home Personal Wash - Hair care - Hair Revenues EBITDA Margin PAT Margin Insecticides Soaps Colors Source: GCPL, Ventura Research Estimates Source: GCPL, Ventura Research Estimates Focused geographies to experience higher growth going forward Increasing affluence and demographic trends of the markets in which GCPL operates are experiencing significantly higher growth than global markets and GCPL with its market dominance in these geographies is best placed to benefit from this. World V/s Countries having GCPL’s presence GCPL’s current market share 15.0 Real GDP Growth (%) 42% Estimated 36% 10.0 5.0 30% 24% 0.0 18% 35% -5.0 28% 12% -10.0 17% 6% -15.0 2000 2002 2004 2006 2008 2010 2012 0% World South Africa UK Africa Indonesia LatAM India Indonesia Argentina Market Share - International Source: IMF, Ventura Research Estimates Source: GCPL, Ventura Research Estimates th -4- Monday 13 Feb, 2012 This document is for private circulation, and must be read in conjunction with the disclaimer on the last page.
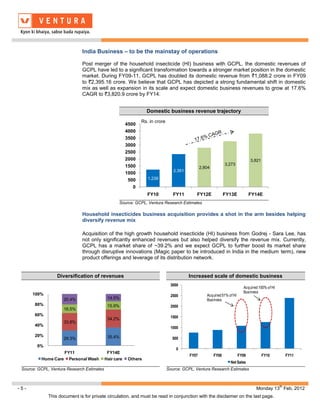
- 5. India Business – to be the mainstay of operations Post merger of the household insecticide (HI) business with GCPL, the domestic revenues of GCPL have led to a significant transformation towards a stronger market position in the domestic market. During FY09-11, GCPL has doubled its domestic revenue from `1,088.2 crore in FY09 to `2,395.16 crore. We believe that GCPL has depicted a strong fundamental shift in domestic mix as well as expansion in its scale and expect domestic business revenues to grow at 17.6% CAGR to `3,820.9 crore by FY14. Domestic business revenue trajectory Rs. in crore 4500 4000 3500 3000 2500 2000 3,821 1500 3,273 2,804 2,351 1000 500 1,239 0 FY10 FY11 FY12E FY13E FY14E Source: GCPL, Ventura Research Estimates Household insecticides business acquisition provides a shot in the arm besides helping diversify revenue mix Acquisition of the high growth household insecticide (HI) business from Godrej - Sara Lee, has not only significantly enhanced revenues but also helped diversify the revenue mix. Currently, GCPL has a market share of ~39.2% and we expect GCPL to further boost its market share through disruptive innovations (Magic paper to be introduced in India in the medium term), new product offerings and leverage of its distribution network. Diversification of revenues Increased scale of domestic business 3000 Acquired 100% of HI Business 100% 2500 Acquired 51% of HI 20.4% 14.5% Business 80% 15.9% 2000 16.5% 60% 1500 34.2% 33.8% 40% 1000 20% 35.4% 29.3% 500 0% 0 FY11 FY14E FY07 FY08 FY09 FY10 FY11 Home Care Personal Wash Hair care Others Net Sales Source: GCPL, Ventura Research Estimates Source: GCPL, Ventura Research Estimates th -5- Monday 13 Feb, 2012 This document is for private circulation, and must be read in conjunction with the disclaimer on the last page.
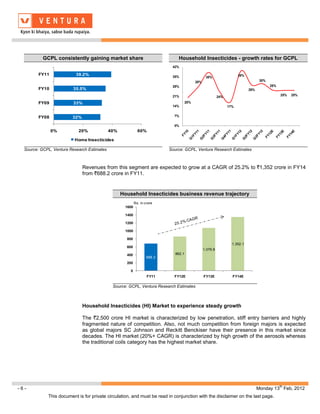
- 6. GCPL consistently gaining market share Household Insecticides - growth rates for GCPL 42% FY11 39.2% 35% 39% 38% 28% 30% 28% 25% FY10 35.5% 29% 21% 24% 25% 25% FY09 33% 20% 14% 17% FY08 32% 7% 0% 0% 20% 40% 60% Home Insecticides Source: GCPL, Ventura Research Estimates Source: GCPL, Ventura Research Estimates Revenues from this segment are expected to grow at a CAGR of 25.2% to `1,352 crore in FY14 from `688.2 crore in FY11. Household Insecticides business revenue trajectory Rs. in crore 1600 1400 1200 1000 800 1,352.1 600 1,079.8 400 862.1 688.2 200 0 FY11 FY12E FY13E FY14E Source: GCPL, Ventura Research Estimates Household Insecticides (HI) Market to experience steady growth The `2,500 crore HI market is characterized by low penetration, stiff entry barriers and highly fragmented nature of competition. Also, not much competition from foreign majors is expected as global majors SC Johnson and Reckitt Benckiser have their presence in this market since decades. The HI market (20%+ CAGR) is characterized by high growth of the aerosols whereas the traditional coils category has the highest market share. th -6- Monday 13 Feb, 2012 This document is for private circulation, and must be read in conjunction with the disclaimer on the last page.
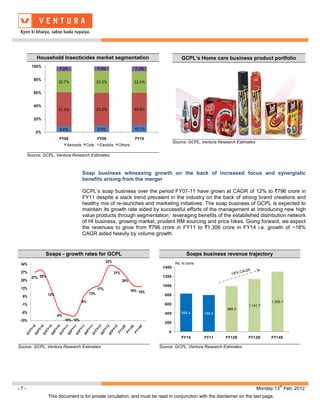
- 7. Household Insecticides market segmentation GCPL’s Home care business product portfolio 100% 7.2% 7.0% 7.3% 80% 32.7% 33.2% 33.0% 60% 40% 51.5% 50.2% 49.6% 20% 8.6% 9.6% 10.1% 0% FY08 FY09 FY10 Source: GCPL, Ventura Research Estimates Aerosols Coils Electrics Others Source: GCPL, Ventura Research Estimates Soap business witnessing growth on the back of increased focus and synergistic benefits arising from the merger GCPL’s soap business over the period FY07-11 have grown at CAGR of 12% to `796 crore in FY11 despite a slack trend prevalent in the industry on the back of strong brand creations and healthy mix of re-launches and marketing initiatives. The soap business of GCPL is expected to maintain its growth rate aided by successful efforts of the management at introducing new high value products through segmentation, leveraging benefits of the established distribution network of HI business, growing market, prudent RM sourcing and price hikes. Going forward, we expect the revenues to grow from `796 crore in FY11 to `1,306 crore in FY14 i.e. growth of ~18% CAGR aided heavily by volume growth. Soaps - growth rates for GCPL Soaps business revenue trajectory 32% Rs. in crore 34% 1400 27% 31% 27% 28% 1200 20% 24% 1000 13% 17% 16% 14% 12% 13% 800 6% 6% 1,306.1 -1% 600 1,141.7 988.5 -8% 400 828.4 795.9 -6% -15% -10% -10% 200 0 FY10 FY11 FY12E FY13E FY14E Source: GCPL, Ventura Research Estimates Source: GCPL, Ventura Research Estimates th -7- Monday 13 Feb, 2012 This document is for private circulation, and must be read in conjunction with the disclaimer on the last page.
- 8. Top leaders in the segment GCPL’s Personal wash business product portfolio 9.1% 10.1% 8.1% 45.0% GCPL HUL Source: GCPL, Ventura Research Estimates Wipro Consumer Care Reckitt Benckiser Source: GCPL, Ventura Research Estimates Hair Colors Business – Growth on the back of re-launches and innovation GCPL is a dominant player in the hair colour segment with ~29% market share. Over the past 3 years, this business has grown at a CAGR of ~14% to `388 crore led by new product launches and successful marketing initiative. Strong growth was led by several product re-launches under the Expert brand. Nupur mehendi continues to gain strong market share and now appears along with Godrej Expert in the Hair color category. Going forward, we believe that GCPL will continue to maintain leadership position and we expect this business to grow at a CAGR of ~16.2% to `608.3 crore by FY14 led by innovations, new product introductions and re-launches of existing products. Hair Colors – growth rates for GCPL Hair Colors business revenue trajectory 60% Rs. in crore 700 48% 50% 600 40% 500 30% 400 20% 20% 18% 19% 17% 15% 16% 16% 16% 20% 14% 300 608.3 9% 523.7 10% 4% 450.9 200 388.2 357.8 9% 0% 100 0 FY10 FY11 FY12E FY13E FY14E Source: GCPL, Ventura Research Estimates Source: GCPL, Ventura Research Estimates th -8- Monday 13 Feb, 2012 This document is for private circulation, and must be read in conjunction with the disclaimer on the last page.
- 9. GCPL’s Personal wash business product portfolio Source: GCPL, Ventura Research Estimates International Business – Skewed towards Emerging Market To fast track its global ambitions, GCPL has undertaken a series of judicious acquisitions overseas in its existing lines of business which have not only provided it with market dominance in the geographies of LatAm, Africa and Indonesia but has also inherited an impressive portfolio which can be leveraged across these markets. Moreover, GCPL’s acquisitions in the overseas markets have been funded by low cost overseas debt costing sub 4%, making these acquisitions EPS accretive. Over the medium term we expect the international business to be the growth driver and we expect revenues to grow at ~43.6% CAGR to `3,890 crore by FY14. International business revenue trajectory Rs. in crore Total 4500 4000 3500 3000 2500 2000 3,890.5 1500 2,933.0 1000 2,041.7 1,312.6 500 0 FY11 FY12E FY13E FY14E Source: GCPL, Ventura Research Estimates th -9- Monday 13 Feb, 2012 This document is for private circulation, and must be read in conjunction with the disclaimer on the last page.
- 10. Series of foreign acquisitions by GCPL in past 2 years Amt Brand Year Country Category (Rs cr) Insecticides, air-care, Megasari 2010 Indonesia 1,200 cleaning, wipes, instant food Sara Lee 2010 US NA 1,055 Stake Tura 2010 Nigeria Medicated soaps, creams Hair colors, shampoo, skin- Issue Group 2010 Argentina 230** care, mosquito repellant Argencos 2010 Argentina Hair color, styling, shampoo - Darling Group 2011 Senegal Hair extension products 900* Cometica 2012 Chile Cosmetics 190 Nacional *estimated **GCPL paid `230 crore for both Issue Group and Argencos Source: Industry Sources Location wise revenue contribution FY11 FY14E UK UK 13% 7% LatAm 16% Indonesia LatAm 31% 16% Indonesia 51% Africa Africa 21% 46% Indonesia Africa LatAm UK Indonesia Africa LatAm UK Source: GCPL, Ventura Research Estimates Indonesia business – growth momentum to continue on the back of strong market growth and new product launches Megasari with a 25% market share continues to dominate the HI segment which has been growing at20%+ over CY07-10. The successful launch of 'Hit magic paper' (an innovative paper format repellent) coupled with the launch of HIT extra power electric mosquito repellant have further boosted revenues. Penetration of the non-coil insecticides is below 30% in Indonesia, which presents a large growth potential. Apart from HI, Megasari is also the market leader in air- care and wipes business. We expect Megasari’s revenues to grow at 22% CAGR to `1,215 crore by FY14 driven by innovations and distribution network leverage. th - 10 - Monday 13 Feb, 2012 This document is for private circulation, and must be read in conjunction with the disclaimer on the last page.
- 11. Megasari operates in a growth segment Indonesia business revenue trajectory US$ mn Rs. in crore 1400 210 180 1200 150 1000 120 800 90 180 600 1,215.6 150 60 125 996.4 98 400 816.7 669.4 30 200 0 CY07 CY08 CY09 CY10 0 FY11 FY12E FY13E FY14E Indonesian home insecticide market Source: GCPL, Ventura Research Estimates Source: GCPL, Ventura Research Estimates Megasari Product Portfolio Source: GCPL, Ventura Research Estimates Darling Group acquisition game changer for GCPL’s African presence Acquisition of the Darling group’s business has changed the landscape of operation in Africa for GCPL. Not only will GCPL have access to a range of products in the hair care space besides a pan African presence, but would be complementary to its existing Kinky range of products and would further help lower costs significantly through benefits of backward integration. GCPL’s Africa business is all set to witness the next level of synergies through expanding distribution and introducing new categories in these markets. We expect revenues from the African business to grow at ~20%+ over the forecasted period to `1,794 crore in FY14 on the back of strong distribution network and cross selling products between African operations. th - 11 - Monday 13 Feb, 2012 This document is for private circulation, and must be read in conjunction with the disclaimer on the last page.
- 12. Companies acquired in Africa Company Name Acquired in Comments Market leader in ethnic hair color market in South Africa Rapidol Jul-06 Continues to grow strongly cementing its market leadership position Product portfolio consists of hair braids, hair pieces, wigs and wefted pieces and hair accessories Kinky Apr-08 Launched Kinky's 'Store within a Store' concept and set up the hub in Nairobi, Kenya Household name in African market and leading personal care company Tura Mar-10 Product portfolio consists of soaps, moisturizing lotions and skin toning creams Market leader in hair extensions with presence in 14 countries across Africa Darling Group Jun-11 25-30% estimated market share in hair extensions across Africa (incl. Kinky) Source: GCPL, Ventura Research Estimates Darling Group’s Pan – African presence Source: Ventura Research Estimates th - 12 - Monday 13 Feb, 2012 This document is for private circulation, and must be read in conjunction with the disclaimer on the last page.
- 13. Darling group acquisition – a game changer for GCPLs African ambitions We believe the strong share positions that the group brands enjoy will further accelerate GCPL’s trajectory of sustainable profitable growth in the region. The acquisition is attractive given the group’s strong distribution network and presence in an estimated market size of US$1 bn +. The lack of MNC presence and large organized players makes for a relatively benign competitive environment. The group has seen 15% revenue CAGR over the past five years. The company has posted revenue of ~ `1,000 crore in CY10 with no debt on books and is highly profitable having an EBITDA margin of over 20%. Darling Group Acquisition – Key Highlights Key Highlights Market leader in hair extensions in 14 countries across Africa 25-30% estimated market share in hair extensions across Africa (incl. Kinky) Key Brands: Darling and Amigos Product portfolio consists of braids, weave ons, wigs, human hair, curls and other hair care products Historical focus on retail chains Reported $200 mn revenues in CY2010 with CAGR ~15% in last five years Source: GCPL, Ventura Research Estimates The Phases of Darling Group acquisition (Transaction Overview) Phase Period Description GCPL will take 51% stake in Darling Holdings which 2-3 I currently owns companies accounting for 45% of the total mths turnover of Darling group. 12 Darling Holdings will acquire 70% of turnover of the Darling II mths group 24 Darling Holdings will acquire 100% of turnover of the Darling III mths group while still continuing to hold 51% stake GCPL has option to buy remaining 49% stake in Darling IV 3-5 yrs Holdings at a pre-determined P/E multiple Source: GCPL, Ventura Research Estimates We believe that recently acquired stake of 51% in Darling group is an important linchpin and GCPL will look to build Darling brand into one of the largest personal care brands across Africa. In addition, significant value add is expected on account of integration of the Kinky brands and Darling group pan African reach. Strong Synergies to follow on the back of backward integration Darling Kinky Focused on retail chains 70% of revenue through own stores Leader in the mass and mass premium More focus on the higher value segments segments Fully backward integrated right to the Not backward integrated backend into the raw material research Operational synergy leading to improved profitability in Kinky Source: GCPL, Ventura Research Estimates th - 13 - Monday 13 Feb, 2012 This document is for private circulation, and must be read in conjunction with the disclaimer on the last page.
- 14. This acquisition will help not only to provide backward integration benefits for its Kinky product portfolio (leading to expansion in margins from Q4FY12 onwards) but also provide a ready market to its earlier acquisitions of Rapidol and Tura. We expect African business revenues to grow by ~20%+ over the forecasted period to `1,794 crore in FY14 on the back of strong distribution network and cross selling of products across the African operations. Africa business revenue trajectory Brand portfolio of African companies Rs. in crore 2000 1800 1600 1400 1200 1000 1,794.2 800 600 1,195.2 400 776.5 200 269.1 0 FY11 FY12E FY13E FY14E Source: GCPL, Ventura Research Estimates Source: GCPL, Ventura Research Estimates Latin America Business – to grow on the back of new launches and leveraged distribution network Having entered the Latin American market in FY11, GCPL holds ~17% market share on the back of the acquisition of two businesses: Issue and Argencos. The hair colorant market in Argentina is estimated to be around USD 200 million growing at CAGR of 22% over the last two- three years. Thus, the merger is expected to realize significant purchase and distribution synergies. Besides this, acquisition of Cosmetica Nacional (a Chilean company) in January 2012 will facilitate GCPL to exploit synergies of scale between its Argentina business and Cosmetica (Chilean market). We expect LatAm business to grow by ~22%+ over the forecasted period to `621 crore by FY14 primarily driven by exploring wide distribution synergies and cross selling of products. Moreover, we expect the margins to improve on account of favorable revenue mix (acquisition of Cosmetica Nacional having ~20% EBITDA margins). LatAm business revenue trajectory Brand portfolio of companies Rs. in crore 700 14.0% 11.4% 600 12.0% 10.0% 500 9.0% 11.3% 10.0% 400 8.0% 300 621.2 6.0% 515.7 200 4.0% 252.3 100 203.5 2.0% 0 0.0% Source: GCPL, Ventura Research Estimates FY11 FY12E FY13E FY14E Source: GCPL, Ventura Research Estimates th - 14 - Monday 13 Feb, 2012 This document is for private circulation, and must be read in conjunction with the disclaimer on the last page.
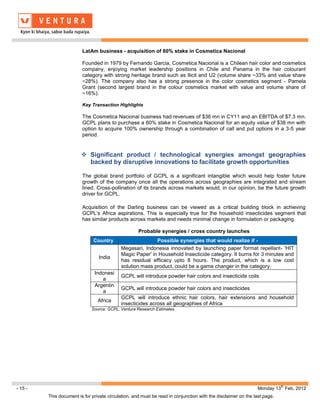
- 15. LatAm business - acquisition of 60% stake in Cosmetica Nacional Founded in 1979 by Fernando Garcia, Cosmetica Nacional is a Chilean hair color and cosmetics company, enjoying market leadership positions in Chile and Panama in the hair colourant category with strong heritage brand such as Ilicit and U2 (volume share ~33% and value share ~28%). The company also has a strong presence in the color cosmetics segment - Pamela Grant (second largest brand in the colour cosmetics market with value and volume share of ~16%). Key Transaction Highlights The Cosmetica Nacional business had revenues of $36 mn in CY11 and an EBITDA of $7.3 mn. GCPL plans to purchase a 60% stake in Cosmetica Nacional for an equity value of $38 mn with option to acquire 100% ownership through a combination of call and put options in a 3-5 year period. Significant product / technological synergies amongst geographies backed by disruptive innovations to facilitate growth opportunities The global brand portfolio of GCPL is a significant intangible which would help foster future growth of the company once all the operations across geographies are integrated and stream lined. Cross-pollination of its brands across markets would, in our opinion, be the future growth driver for GCPL. Acquisition of the Darling business can be viewed as a critical building block in achieving GCPL’s Africa aspirations. This is especially true for the household insecticides segment that has similar products across markets and needs minimal change in formulation or packaging. Probable synergies / cross country launches Country Possible synergies that would realize if - Megasari, Indonesia innovated by launching paper format repellant- 'HIT Magic Paper' in Household Insecticide category. It burns for 3 minutes and India has residual efficacy upto 8 hours. The product, which is a low cost solution mass product, could be a game changer in the category. Indonesi GCPL will introduce powder hair colors and insecticide coils a Argentin GCPL will introduce powder hair colors and insecticides a GCPL will introduce ethnic hair colors, hair extensions and household Africa insecticides across all geographies of Africa Source: GCPL, Ventura Research Estimates th - 15 - Monday 13 Feb, 2012 This document is for private circulation, and must be read in conjunction with the disclaimer on the last page.
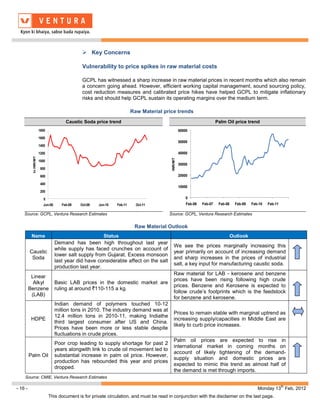
- 16. Key Concerns Vulnerability to price spikes in raw material costs GCPL has witnessed a sharp increase in raw material prices in recent months which also remain a concern going ahead. However, efficient working capital management, sound sourcing policy, cost reduction measures and calibrated price hikes have helped GCPL to mitigate inflationary risks and should help GCPL sustain its operating margins over the medium term. Raw Material price trends Caustic Soda price trend Palm Oil price trend 1800 60000 1600 50000 1400 1200 40000 In INR/MT INR/MT 1000 30000 800 600 20000 400 10000 200 0 0 Jun-08 Feb-09 Oct-09 Jun-10 Feb-11 Oct-11 Feb-06 Feb-07 Feb-08 Feb-09 Feb-10 Feb-11 Source: GCPL, Ventura Research Estimates Source: GCPL, Ventura Research Estimates Raw Material Outlook Name Status Outlook Demand has been high throughout last year We see the prices marginally increasing this while supply has faced crunches on account of Caustic year primarily on account of increasing demand lower salt supply from Gujarat. Excess monsoon Soda and sharp increases in the prices of industrial last year did have considerable affect on the salt salt, a key input for manufacturing caustic soda. production last year. Raw material for LAB - kerosene and benzene Linear prices have been rising following high crude Alkyl Basic LAB prices in the domestic market are prices. Benzene and Kerosene is expected to Benzene ruling at around `110-115 a kg. follow crude’s footprints which is the feedstock (LAB) for benzene and kerosene. Indian demand of polymers touched 10-12 million tons in 2010. The industry demand was at Prices to remain stable with marginal uptrend as 12.4 million tons in 2010-11, making Indiathe HDPE increasing supply/capacities in Middle East are third largest consumer after US and China. likely to curb price increases. Prices have been more or less stable despite fluctuations in crude prices. Palm oil prices are expected to rise in Poor crop leading to supply shortage for past 2 international market in coming months on years alongwith link to crude oil movement led to account of likely tightening of the demand- Palm Oil substantial increase in palm oil price. However, supply situation and domestic prices are production has rebounded this year and prices expected to mimic this trend as almost half of dropped. the demand is met through imports. Source: CMIE, Ventura Research Estimates th - 16 - Monday 13 Feb, 2012 This document is for private circulation, and must be read in conjunction with the disclaimer on the last page.
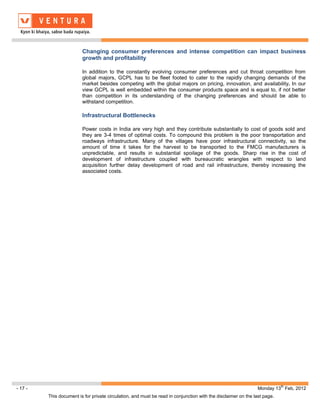
- 17. Changing consumer preferences and intense competition can impact business growth and profitability In addition to the constantly evolving consumer preferences and cut throat competition from global majors, GCPL has to be fleet footed to cater to the rapidly changing demands of the market besides competing with the global majors on pricing, innovation, and availability. In our view GCPL is well embedded within the consumer products space and is equal to, if not better than competition in its understanding of the changing preferences and should be able to withstand competition. Infrastructural Bottlenecks Power costs in India are very high and they contribute substantially to cost of goods sold and they are 3-4 times of optimal costs. To compound this problem is the poor transportation and roadways infrastructure. Many of the villages have poor infrastructural connectivity, so the amount of time it takes for the harvest to be transported to the FMCG manufacturers is unpredictable, and results in substantial spoilage of the goods. Sharp rise in the cost of development of infrastructure coupled with bureaucratic wrangles with respect to land acquisition further delay development of road and rail infrastructure, thereby increasing the associated costs. th - 17 - Monday 13 Feb, 2012 This document is for private circulation, and must be read in conjunction with the disclaimer on the last page.
- 18. Financial Performance(Consolidated) Domestic sales rose 19.9% YoY driven by 31%, 9% and 30% respective sales growth for soaps, hair colors and household insecticide (HI) during Q3FY12. Volume growth stood at ~20%, ~4- 5% and ~25% respectively for soaps, hair colors and HI. Overseas revenues registered organic growth of 30% yoy to `567 crore. Indonesia (Megasari) posting a healthy performance with 35% sales growth (~20% adjusted for currency, +17-18% volume growth) and EBITDA margins of 20.6% (+190 bps YoY, +120bp QoQ) led by favorable product mix and good performance of new launches. Latin American operations posted 29% sales growth (~20% adjusted for currency) and EBITDA margins of 9%. Africa region posted revenues of `186 crore with inclusion of Darling. EBITDA margins came in quite strong at 31% driven by good festive season sales, favorable mix on hair extensions, and low ad expenses. Europe (Keyline) registered 43% YoY sales growth (~25% adjusted for currency) and 6% EBITDA margin. Quarterly Financial Performance (Rs in crore) Particulars Q3FY12 Q3FY11 FY11 FY10 Net Sales 1,344.1 988.8 3,646.1 2,043.7 Growth % 35.9 78.4 Total Expenditure 1,095.8 835.2 3,002.3 1,633.9 EBDITA 255.0 159.2 643.8 409.8 EBDITA Margin % 19.0 16.1 17.7 20.1 Depreciation 17.1 12.1 49.9 23.6 EBIT (EX OI) 237.9 147.1 593.9 386.2 Other Income 6.8 5.6 69.8 44.8 EBIT 267.5 160.6 663.7 431.0 Margin % 19.9 16.2 18.2 21.0 Interest 28.7 13.3 51.9 11.1 Exceptional items 0.0 2.0 0.0 0.0 PBT 238.8 147.3 611.8 419.9 Margin % 17.8 14.9 16.8 20.5 Provision for Tax 55.5 28.5 130.2 80.3 PAT 183.3 118.8 481.6 339.6 PAT Margin (%) 13.6 12.0 13.2 16.6 Source: GCPL, Ventura Research Estimates Recent Developments GCPL acquired 60% stake in Cosmetica Nacional (Chilean company) for $38 mn. With sales of $36mn and EBITDA margin of ~20%, Cosmetica Nacional has grown over ~15% in recent past. Acquisition is to be funded by low cost overseas debt. GCPL shall raise `685 crore from Temasek at `410 per share diluting 5.2% of equity. The management attributes an equity raise to tone down leverage as it looks at a maximum debt equity mix of 1:1. th - 18 - Monday 13 Feb, 2012 This document is for private circulation, and must be read in conjunction with the disclaimer on the last page.
- 19. Financial Outlook On the back of recent acquisitions, successful innovations & product launches and geographical diversification, we expect revenues to grow at a CAGR of 28.4% to `7,711.4 crore over the forecast period of FY12-14. Moreover, we expect significant cost and revenue synergies in the domestic and international business over the next 2 to 4 years. Consequently, we expect EBITDA margin (excl OI) to be maintained ~19% over the forecasted period amidst volatile raw material prices. GCPL’s Outlook Rs in Crore 9000 20.1% 20.5% 8000 20.0% 19.2% 19.2% 19.3% 7000 19.5% 6000 19.0% 5000 18.5% 4000 17.7% 7,711.4 18.0% 3000 6,206.1 17.5% 4,846.1 2000 3,646.1 17.0% 1000 2,043.7 16.5% 0 16.0% FY10 FY11 FY12E FY13E FY14E Net Revenue (LHS) EBIDTA Margin (RHS) Source: GCPL, Ventura Research Estimates Valuation We initiate coverage on Godrej Consumer Products Ltd (GCPL) as a BUY with a Price Objective of `588.7 (target 20x FY14 EPS) over a period of 21-24 months representing a potential upside of ~32.9%. At CMP of`443, the stock is trading at 18.1x and 15.1x its estimated earnings for FY13and FY14, respectively. We have valued the stock at ~31.5% discount to Hindustan Unilever Ltd’s valuation of 29.2x FY13 EPS (as per Ventura estimates). Driven by global acquisitions of Darling Group in Africa and Cosmetica Nacional in Latin America and strong growth of the Indian household insecticides business, we expect GCPL’s consolidated revenues to grow at ~28.4% CAGR over the forecasted period FY12-FY14. In our opinion, our estimates are conservative and we expect a substantial re-rating of the price earnings (PE) multiple. Currently, the discount to peers is a mispricing which should narrow as the acquisitions start delivering. th - 19 - Monday 13 Feb, 2012 This document is for private circulation, and must be read in conjunction with the disclaimer on the last page.
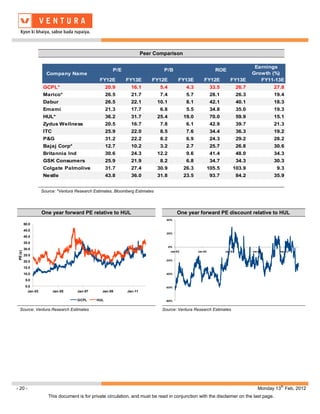
- 20. Peer Comparison Earnings P/E P/B ROE Company Name Growth (%) FY12E FY13E FY12E FY13E FY12E FY13E FY11-13E GCPL* 20.9 16.1 5.4 4.3 33.5 26.7 27.8 Marico* 26.5 21.7 7.4 5.7 28.1 26.3 19.4 Dabur 26.5 22.1 10.1 8.1 42.1 40.1 18.3 Emami 21.3 17.7 6.8 5.5 34.8 35.0 19.3 HUL* 36.2 31.7 25.4 19.0 70.0 59.9 15.1 Zydus Wellness 20.5 16.7 7.8 6.1 42.9 39.7 21.3 ITC 25.9 22.0 8.5 7.6 34.4 36.3 19.2 P&G 31.2 22.2 8.2 6.9 24.3 29.2 28.2 Bajaj Corp* 12.7 10.2 3.2 2.7 25.7 26.8 30.6 Britannia Ind 30.6 24.3 12.2 9.6 41.4 48.0 34.3 GSK Consumers 25.9 21.9 8.2 6.8 34.7 34.3 30.3 Colgate Palmolive 31.7 27.4 30.9 26.3 105.5 103.9 9.3 Nestle 43.8 36.0 31.8 23.5 93.7 84.2 35.9 Source: *Ventura Research Estimates, Bloomberg Estimates One year forward PE relative to HUL One year forward PE discount relative to HUL 40% 50.0 45.0 20% 40.0 35.0 0% 30.0 PE (x) Jan-03 Jan-05 Jan-07 Jan-09 Jan-11 25.0 20.0 -20% 15.0 10.0 -40% 5.0 0.0 -60% Jan-03 Jan-05 Jan-07 Jan-09 Jan-11 GCPL HUL -80% Source: Ventura Research Estimates Source: Ventura Research Estimates th - 20 - Monday 13 Feb, 2012 This document is for private circulation, and must be read in conjunction with the disclaimer on the last page.
- 21. One year forward PE 40.0 35.0 30.0 25.0 PE (x) 20.0 15.0 10.0 5.0 0.0 Jan-03 Jan-05 Jan-07 Jan-09 Jan-11 GCPL Avg P/E Source: Ventura Research Estimates th - 21 - Monday 13 Feb, 2012 This document is for private circulation, and must be read in conjunction with the disclaimer on the last page.
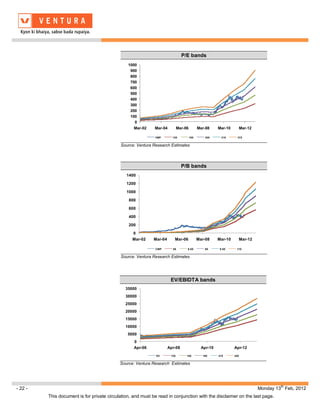
- 22. P/E bands 1000 900 800 700 600 500 400 300 200 100 0 Mar-02 Mar-04 Mar-06 Mar-08 Mar-10 Mar-12 CMP 13X 19X 25X 31X 37X Source: Ventura Research Estimates P/B bands 1400 1200 1000 800 600 400 200 0 Mar-02 Mar-04 Mar-06 Mar-08 Mar-10 Mar-12 CMP 5X 6.5X 8X 9.5X 11X Source: Ventura Research Estimates EV/EBIDTA bands 35000 30000 25000 20000 15000 10000 5000 0 Apr-06 Apr-08 Apr-10 Apr-12 EV 12X 15X 18X 21X 24X Source: Ventura Research Estimates th - 22 - Monday 13 Feb, 2012 This document is for private circulation, and must be read in conjunction with the disclaimer on the last page.
- 23. Financials and Projections Y/E March, Fig in Rs. Cr FY 2011 FY 2012e FY 2013e FY 2014e Y/E March, Fig in Rs. Cr FY 2011 FY 2012e FY 2013e FY 2014e Profit & Loss Statement Per Share Data (Rs) Net Sales 3646.1 4846.1 6206.1 7711.4 EPS 15.1 24.3 24.5 29.4 % Chg. 178.4 32.9 28.1 24.3 Cash EPS 16.6 25.5 26.4 31.6 Total Expenditure 3002.3 3914.7 5015.5 6222.6 DPS 4.5 4.5 4.5 4.5 % Chg. 183.8 30.4 28.1 24.1 Book Value 50.7 69.6 88.7 112.7 EBDITA 643.8 931.4 1190.6 1488.8 Capital, Liquidity, Returns Ratio EBDITA Margin % 17.7 19.2 19.2 19.3 Debt / Equity (x) 1.2 1.1 1.0 1.0 Other Income 69.8 92.8 118.8 115.7 Current Ratio (x) 1.7 2.1 2.5 2.9 PBDIT 713.6 1024.2 1309.4 1604.5 ROE (%) 29.8 34.9 27.6 26.1 Depreciation 49.9 41.0 62.8 72.2 ROCE (%) 19.1 20.2 21.2 20.3 Interest 51.9 70.6 81.6 103.5 Dividend Yield (%) 1.0 1.0 1.0 1.0 Exceptional items 33.1 200.2 0.0 0.0 Valuation Ratio (x) PBT 644.9 1112.7 1165.0 1428.8 P/E 29.3 18.2 18.1 15.1 Tax Provisions 130.2 255.9 268.0 328.6 P/BV 8.7 6.4 5.0 3.9 Minority Interest 0.0 29.9 62.8 98.5 EV/Sales 4.7 3.5 2.7 2.2 Reported PAT 514.7 826.9 834.3 1001.6 EV/EBIDTA 26.4 18.3 14.3 11.4 PAT Margin (%) 14.1 17.1 13.4 13.0 Efficiency Ratio (x) Raw Materials / Sales (%) 49.2 50.0 50.0 50.0 Inventory (days) 44.0 47.0 48.0 49.0 Manpower cost / Sales (%) 7.5 7.0 7.0 7.0 Debtors (days) 38.4 42.0 42.0 42.0 Tax Rate (%) 20.2 23.0 23.0 23.0 Creditors (days) 84.6 82.0 81.0 81.0 Balance Sheet Cash Flow statement Share Capital 32.4 34.0 34.0 34.0 Profit After Tax 514.7 856.8 897.1 1100.1 Reserves & Surplus 1692.8 2334.4 2983.4 3799.8 Depreciation 49.9 41.0 62.8 72.2 Minority Interest 0.0 85.7 148.5 247.0 Working Capital Changes (373.2) (95.5) (20.9) (41.7) Total Loans 2005.4 2605.3 3017.4 3833.8 Others (116.8) (185.3) (186.3) (225.1) Deferred Tax Liability 0.0 0.0 0.0 0.0 Operating Cash Flow 206.1 873.0 1020.6 1234.2 Total Liabilities 3730.6 5059.4 6183.4 7914.6 Capital Expenditure (2,415.1) (656.1) (503.9) (562.8) Gross Block 3455.2 4111.3 4425.1 4988.0 Change in Investment 0.0 (74.5) 0.0 0.0 Less: Acc. Depreciation 377.5 418.5 481.2 553.4 Cash Flow from Investing -2364.3 -730.6 -503.9 -562.8 Net Block 3077.7 3692.8 3943.9 4434.5 Proceeds from equity issue 522.8 0.0 685.0 0.0 Capital Work in Progress 15.4 0.0 0.0 0.0 Increase/(Decrease) in Loans 1760.5 599.8 -82.8 816.3 Investments 0.0 74.5 74.5 74.5 Dividend and DDT -163.1 -153.1 -153.1 -153.1 Net Current Assets 638.9 1296.3 2169.2 3409.8 Cash Flow from Financing 2237.5 343.9 335.3 527.5 Deferred Tax Assets (1.4) (4.1) (4.1) (4.1) Net Change in Cash 79.3 486.3 852.0 1198.9 Misc Expenses 0.0 0.0 0.0 0.0 Opening Cash Balance 51.0 16.8 81.3 149.5 Total Assets 3730.6 5059.6 6183.5 7914.7 Closing Cash Balance 226.9 713.2 1565.2 2764.1 Ventura Securities Limited Corporate Office: C-112/116, Bldg No. 1, Kailash Industrial Complex, Park Site, Vikhroli (W), Mumbai – 400079 This report is neither an offer nor a solicitation to purchase or sell securities. The information and views expressed herein are believed to be reliable, but no responsibility (or liability) is accepted for errors of fact or opinion. Writers and contributors may be trading in or have positions in the securities mentioned in their articles. Neither Ventura Securities Limited nor any of the contributors accepts any liability arising out of the above information/articles. Reproduction in whole or in part without written permission is prohibited. This report is for private circulation. th - 23 - Monday 13 Feb, 2012 This document is for private circulation, and must be read in conjunction with the disclaimer on the last page.