Consumer In The Market Place
- 1. Ch 4. Consumers in the Marketplace • Consumption choices change as a function of price and/or income • Price increases – Lead to decreases in quantity demanded – Lead to pivoting budget line and consumers choosing new consumption point
- 2. Contents 1. Income Change a. Income-Consumption Curve b. Normal/Inferior good 2. Price Change a. Price-Consumption Curve b. Substitution Effect / Income Effect c. Normal/Inferior/Giffen Good 3. Elasticity a. Point/Arc Elasticity b. Elasticity and Total Revenue
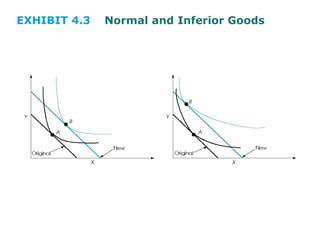
- 3. Changes in Income • Composite good convention • Income changes – Result in a parallel shift of the budget line • Increase in income – Cause consumption increase if normal good – Cause consumption decrease if inferior good
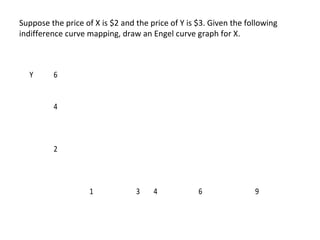
- 4. Suppose the price of X is $2 and the price of Y is $3. Given the following indifference curve mapping, draw an Engel curve graph for X. Y 6 4 2 1 3 4 6 9
- 5. EXHIBIT 4.3 Normal and Inferior Goods
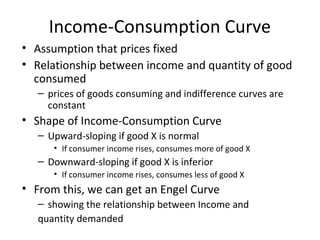
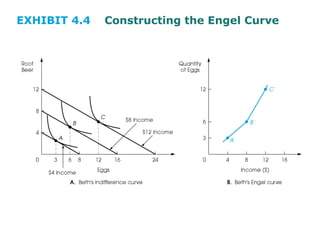
- 6. Income-Consumption Curve • Assumption that prices fixed • Relationship between income and quantity of good consumed – prices of goods consuming and indifference curves are constant • Shape of Income-Consumption Curve – Upward-sloping if good X is normal • If consumer income rises, consumes more of good X – Downward-sloping if good X is inferior • If consumer income rises, consumes less of good X • From this, we can get an Engel Curve – showing the relationship between Income and quantity demanded
- 7. EXHIBIT 4.4 Constructing the Engel Curve
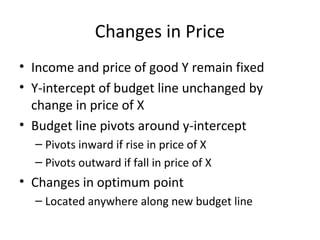
- 8. Changes in Price • Income and price of good Y remain fixed • Y-intercept of budget line unchanged by change in price of X • Budget line pivots around y-intercept – Pivots inward if rise in price of X – Pivots outward if fall in price of X • Changes in optimum point – Located anywhere along new budget line
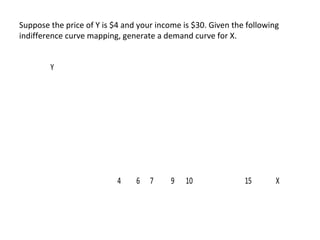
- 9. Suppose the price of Y is $4 and your income is $30. Given the following indifference curve mapping, generate a demand curve for X. Y 4 6 7 9 10 15 X
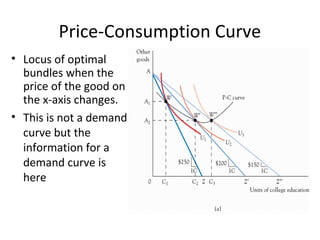
- 10. Price-Consumption Curve • Locus of optimal bundles when the price of the good on the x-axis changes. • This is not a demand curve but the information for a demand curve is here
- 11. The Demand Curve • Engel curve vs demand curve – Engel curve: relationship between income and consumption • Plots income on horizontal axis and consumption on the vertical axis – Demand curve: relationship between price and consumption • Plots price on the vertical axis and consumption on the horizontal axis
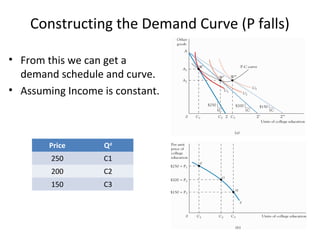
- 12. Constructing the Demand Curve • Derived from indifference curves – Find price of X – Draw budget line given income and prices – Find tangency between budget line and indifference curve – Read off quantity of X – Plot point on demand curve relating price to quantity – Repeat the process for additional points on the demand curve
- 13. Constructing the Demand Curve (P falls) • From this we can get a demand schedule and curve. • Assuming Income is constant. Price Qd 250 C1 200 C2 150 C3
- 14. Shape of Demand Curve • Slopes downward • If Giffen good, slopes upward • Demand and indifference curves cannot be drawn on same graph – Require different axes
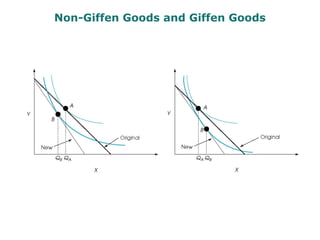
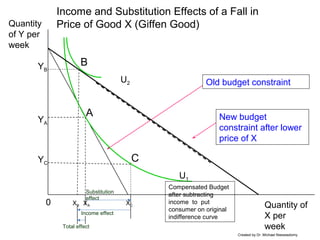
- 15. Giffen Goods • If price of X increases, quantity demanded decreases – Follows law of demand – Then, non-Giffen goods • If price of X increases, quantity demanded increases – Violates law of demand – Then, Giffen goods • Giffen goods rare or nonexistent – Using theory of indifference curves indicates exception to law of demand
- 16. Non-Giffen Goods and Giffen Goods
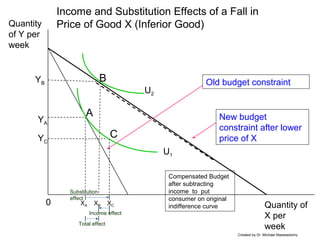
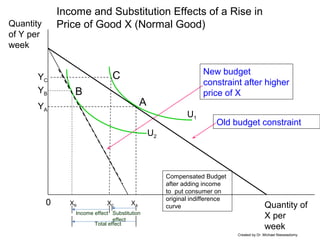
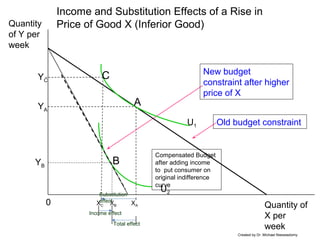
- 17. Income and Substitution Effects • When the price of a good changes, consumers choose a new bundle. • Economists decompose this shift from one bundle to another into two parts: the substitution effect and the income effect. – Substitution effect • Price rises • Adjust consumption of goods whose price above marginal value – Income effect • Price rises • Can no longer afford previous basket • Decrease (increase) consumption if normal (inferior) good
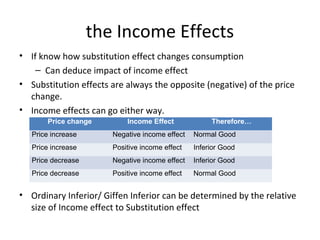
- 18. Income and Substitution Effects • Substitution Effect: The change in Qd resulting from a change in the relative price of a good, and assuming the original level of utility is maintained. – Substitution effects are always the opposite (negative) of the price change. • Income Effect: The effect on the quantity demanded that results from the change in the purchasing power of a given income when the price of a good changes. – Income effects can go either way.
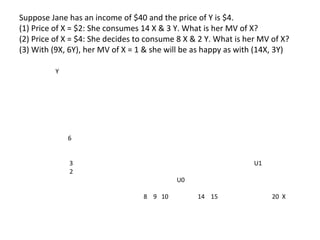
- 19. Y 6 3 U1 2 U0 8 9 10 14 15 20 X Suppose Jane has an income of $40 and the price of Y is $4. (1) Price of X = $2: She consumes 14 X & 3 Y. What is her MV of X? (2) Price of X = $4: She decides to consume 8 X & 2 Y. What is her MV of X? (3) With (9X, 6Y), her MV of X = 1 & she will be as happy as with (14X, 3Y)
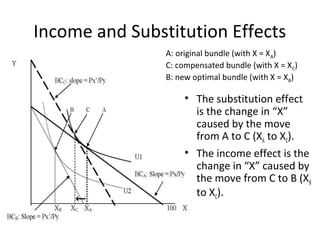
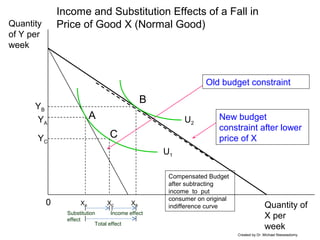
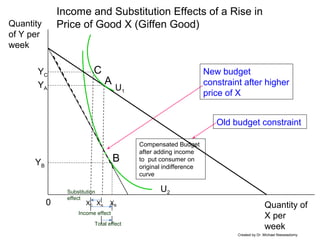
- 20. Income and Substitution Effects • The substitution effect is the change in “X” caused by the move from A to C (XA to XC). • The income effect is the change in “X” caused by the move from C to B (XB to XC). A: original bundle (with X = XA) C: compensated bundle (with X = XC) B: new optimal bundle (with X = XB)
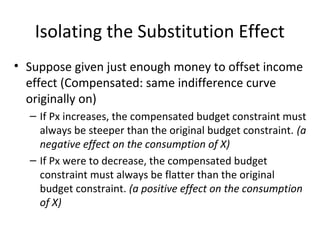
- 21. Isolating the Substitution Effect • Suppose given just enough money to offset income effect (Compensated: same indifference curve originally on) – If Px increases, the compensated budget constraint must always be steeper than the original budget constraint. (a negative effect on the consumption of X) – If Px were to decrease, the compensated budget constraint must always be flatter than the original budget constraint. (a positive effect on the consumption of X)
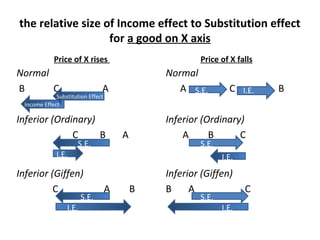
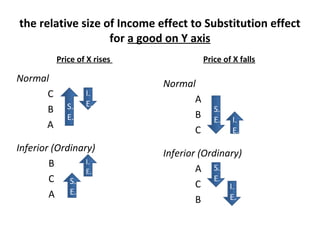
- 22. the Income Effects • If know how substitution effect changes consumption – Can deduce impact of income effect • Substitution effects are always the opposite (negative) of the price change. • Income effects can go either way. • Ordinary Inferior/ Giffen Inferior can be determined by the relative size of Income effect to Substitution effect Price change Income Effect Therefore… Price increase Negative income effect Normal Good Price increase Positive income effect Inferior Good Price decrease Negative income effect Inferior Good Price decrease Positive income effect Normal Good
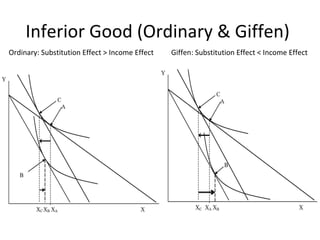
- 23. Inferior Good (Ordinary & Giffen) Ordinary: Substitution Effect > Income Effect Giffen: Substitution Effect < Income Effect
- 24. Total effect Income and Substitution Effects of a Fall in Price of Good X (Normal Good) 0 Quantity of X per week Quantity of Y per week Old budget constraint U1 XA YA New budget constraint after lower price of X U2 XB YB XC A Substitution effect Income effect B C Compensated Budget after subtracting income to put consumer on original indifference curve Created by Dr. Michael Nieswiadomy YC
- 25. Total effect Income and Substitution Effects of a Fall in Price of Good X (Inferior Good) 0 Quantity of X per week Quantity of Y per week Old budget constraint U1 XA YA New budget constraint after lower price of X U2 XB YB XC A Substitution effect Income effect B C Compensated Budget after subtracting income to put consumer on original indifference curve Created by Dr. Michael Nieswiadomy YC
- 26. Total effect Income and Substitution Effects of a Fall in Price of Good X (Giffen Good) 0 Quantity of X per week Quantity of Y per week Old budget constraint U1 XA YA New budget constraint after lower price of X U2 XB YB XC A Substitution effect Income effect B C Compensated Budget after subtracting income to put consumer on original indifference curve Created by Dr. Michael Nieswiadomy YC
- 27. Total effect Income and Substitution Effects of a Rise in Price of Good X (Normal Good) 0 Quantity of X per week Quantity of Y per week Old budget constraint U2 XB YB New budget constraint after higher price of X U1 XA YA XC A Substitution effect Income effect B C Compensated Budget after adding income to put consumer on original indifference curve Created by Dr. Michael Nieswiadomy YC
- 28. Total effect Income and Substitution Effects of a Rise in Price of Good X (Inferior Good) 0 Quantity of X per week Quantity of Y per week Old budget constraint U2 XB YB New budget constraint after higher price of X U1 XA YA XC A Substitution effect Income effect B C Compensated Budget after adding income to put consumer on original indifference curve Created by Dr. Michael Nieswiadomy YC
- 29. Total effect Income and Substitution Effects of a Rise in Price of Good X (Giffen Good) 0 Quantity of X per week Quantity of Y per week Old budget constraint U2 XB YB New budget constraint after higher price of X U1 XA YA XC A Substitution effect Income effect B C Compensated Budget after adding income to put consumer on original indifference curve Created by Dr. Michael Nieswiadomy YC
- 30. the relative size of Income effect to Substitution effect for a good on X axis Price of X rises Normal B C A Inferior (Ordinary) C B A Inferior (Giffen) C A B Price of X falls Income Effect Substitution Effect Normal A C B Inferior (Ordinary) A B C Inferior (Giffen) B A C I.E. S.E. S.E. I.E. S.E. I.E. S.E. S.E. I.E. I.E.
- 31. the relative size of Income effect to Substitution effect for a good on Y axis Price of X rises Normal C B A Inferior (Ordinary) B C A Price of X falls I. E.S. E. I. E. S. E. Normal A B C Inferior (Ordinary) A C B S. E. S. E. I. E. I. E.
- 32. Why Demand Curves Slope Downward: Normal Goods • Geometric Observations – Increases in price, substitution effect means less consumption – Move from compensated line to new line, income falls, consume less of good if normal • Demand curve for normal good – Both effects move consumer leftward – Normal goods are not Giffen goods
- 33. Why Demand Curves Slope Downward: Inferior Goods • Demand curve for inferior goods – Effects move in opposite directions and not as easily analyzed as normal good – Inferior good non-Giffen is substitution effect exceeds income effect – Inferior good Giffen if income effect exceeds substitution effect • Size of income effect – Income effect of price change large if good large fraction of consumer expenditures • Giffen goods revisited – Giffen goods are inferior – Giffen goods account for a large portion of consumer expenditures – However, goods that make up a large portion of your budget are generally normal. – Conditions above explain why so rare (or nonexistent)
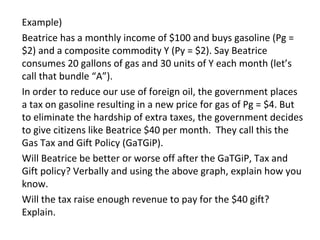
- 34. Example) Beatrice has a monthly income of $100 and buys gasoline (Pg = $2) and a composite commodity Y (Py = $2). Say Beatrice consumes 20 gallons of gas and 30 units of Y each month (let’s call that bundle “A”). In order to reduce our use of foreign oil, the government places a tax on gasoline resulting in a new price for gas of Pg = $4. But to eliminate the hardship of extra taxes, the government decides to give citizens like Beatrice $40 per month. They call this the Gas Tax and Gift Policy (GaTGiP). Will Beatrice be better or worse off after the GaTGiP, Tax and Gift policy? Verbally and using the above graph, explain how you know. Will the tax raise enough revenue to pay for the $40 gift? Explain.
- 35. Substitutes/Complements When PX↑QY↓(Complements), 1.True/False: Y could not possibly be an inferior good for you. 2.True/False: X could not possibly be an inferior good for you.
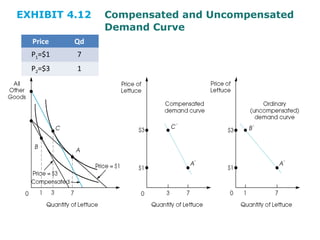
- 36. Compensated Demand Curve • Curve showing, for each price, what the quantity demanded would be if the consumer were income-compensated for all price changes (if there were no income effect.) • Allows for isolation of substitution effect • Confirms that compensated demand curve downward sloping
- 37. EXHIBIT 4.12 Compensated and Uncompensated Demand Curve Price Qd P1=$1 7 P2=$3 1
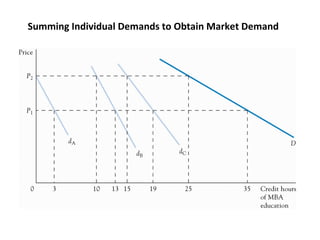
- 38. Summing Individual Demands to Obtain Market Demand
- 39. Elasticity • Anticipate changes in consumer buying habits • Prediction about direction of change – If income increases or price falls, consumer buys more • No predictions about magnitude of change – Consumption and expenditures change by how much • An elasticity can be calculated for any relationships between two variables – the price elasticity of demand – the income elasticity of demand – the cross-price elasticity.
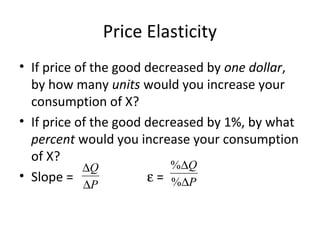
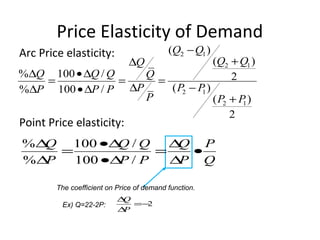
- 40. Price Elasticity • If price of the good decreased by one dollar, by how many units would you increase your consumption of X? • If price of the good decreased by 1%, by what percent would you increase your consumption of X? • Slope = ε = % % Q P ∆ ∆ Q P ∆ ∆
- 41. Price Elasticity of Demand Arc Price elasticity: Point Price elasticity: 2 1 2 1 2 1 2 1 ( ) ( ) % 100 / 2 ( )% 100 / ( ) 2 Q Q Q QQ Q Q Q Q P P PP P P P P P − +∆ ∆ •∆ = = = ∆ −∆ •∆ + Q P P Q PP QQ P Q • ∆ ∆ = ∆• ∆• = ∆ ∆ /100 /100 % % The coefficient on Price of demand function. Ex) Q=22-2P: 2−= ∆ ∆ P Q
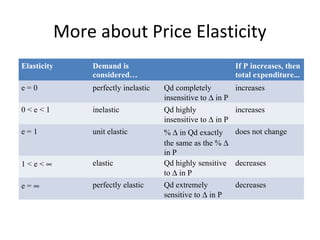
- 42. More about Price Elasticity • Demand highly elastic when price elasticity of demand has large absolute value • Why one good is more elastic? – Availability of substitutes
- 43. More about Price Elasticity Elasticity Demand is considered… If P increases, then total expenditure... e = 0 perfectly inelastic Qd completely insensitive to ∆ in P increases 0 < e < 1 inelastic Qd highly insensitive to ∆ in P increases e = 1 unit elastic % ∆ in Qd exactly the same as the % ∆ in P does not change 1 < e < ∞ elastic Qd highly sensitive to ∆ in P decreases e = ∞ perfectly elastic Qd extremely sensitive to ∆ in P decreases
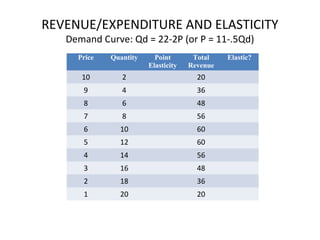
- 44. REVENUE/EXPENDITURE AND ELASTICITY Demand Curve: Qd = 22-2P (or P = 11-.5Qd) Price Quantity Point Elasticity Total Revenue Elastic? 10 2 20 9 4 36 8 6 48 7 8 56 6 10 60 5 12 60 4 14 56 3 16 48 2 18 36 1 20 20
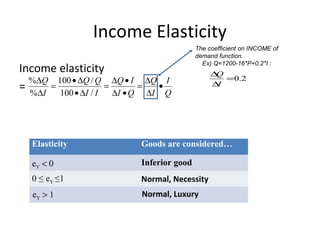
- 45. Income Elasticity Income elasticity = Q I I Q QI IQ II QQ I Q • ∆ ∆ = •∆ •∆ = ∆• ∆• = ∆ ∆ /100 /100 % % Elasticity Goods are considered… eY < 0 Inferior good 0 ≤ eY ≤1 Normal, Necessity eY > 1 Normal, Luxury The coefficient on INCOME of demand function. Ex) Q=1200-16*P+0.2*I : 2.0= ∆ ∆ I Q
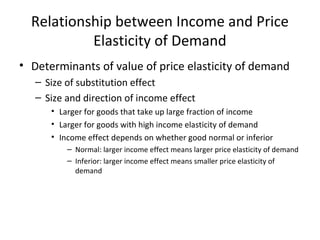
- 46. Relationship between Income and Price Elasticity of Demand • Determinants of value of price elasticity of demand – Size of substitution effect – Size and direction of income effect • Larger for goods that take up large fraction of income • Larger for goods with high income elasticity of demand • Income effect depends on whether good normal or inferior – Normal: larger income effect means larger price elasticity of demand – Inferior: larger income effect means smaller price elasticity of demand
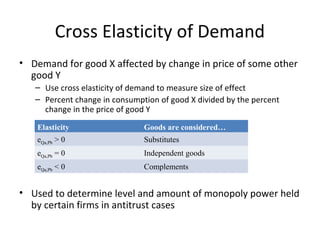
- 47. Cross Elasticity of Demand • Demand for good X affected by change in price of some other good Y – Use cross elasticity of demand to measure size of effect – Percent change in consumption of good X divided by the percent change in the price of good Y • Used to determine level and amount of monopoly power held by certain firms in antitrust cases Elasticity Goods are considered… eQa,Pb > 0 Substitutes eQa,Pb = 0 Independent goods eQa,Pb < 0 Complements

