9. transportation model
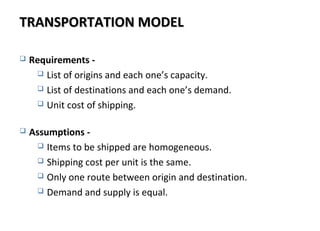
- 2. TRANSPORTATION MODELTRANSPORTATION MODEL Requirements - List of origins and each one’s capacity. List of destinations and each one’s demand. Unit cost of shipping. Assumptions - Items to be shipped are homogeneous. Shipping cost per unit is the same. Only one route between origin and destination. Demand and supply is equal.
- 3. TRANSPORTATION MODEL SCENARIOTRANSPORTATION MODEL SCENARIO D (demand) B (demand) C (demand) A (demand) 1 (supply) 2 (supply) 3 (supply)
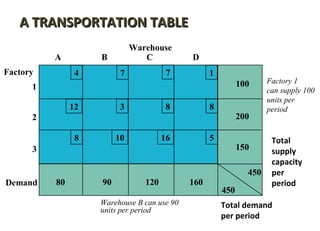
- 4. A TRANSPORTATION TABLEA TRANSPORTATION TABLE Warehouse 4 7 7 1 100 12 3 8 8 200 8 10 16 5 150 450 450 80 90 120 160 A B C D 1 2 3 Factory Factory 1 can supply 100 units per period Total supply capacity per period Total demand per period Demand Warehouse B can use 90 units per period
- 5. NETWORK PRESENTATIONNETWORK PRESENTATION • Transportation problem can be represented as a network. Circles represent origins and destinations, and the arcs between them represent the decision variables, i.e. the amounts shipped. Supply Origin Demand Destination D1 D2 D3 4 10 6 8 16 6 14 18 10 100 300 300 200 300 200 S1 S2 S3
- 6. LINEAR PROGRAMMING FORMULATIONLINEAR PROGRAMMING FORMULATION • Let xij be unknown number of units shipped from origin i to destination j (i,j = 1,2,3) x11 + x21 + x31 > 200 x12 + x22 + x32 > 300 x13 + x23 + x33 > 200 Demand constraintsSupply constraints x11 + x12 + x13 < 100 x21 + x22 + x33 < 300 x31 + x32 + x33 < 300 min z = 4x11 + 10x12 + 6x13 + 8x21 + 16x22 + 6x23 + 14x31 + 18x32 + 10x33 st. xij > 0 Non-negative constraints
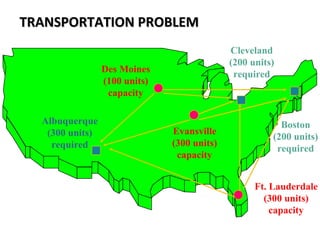
- 7. TRANSPORTATION PROBLEMTRANSPORTATION PROBLEM Des Moines (100 units) capacity Cleveland (200 units) required Boston (200 units) required Evansville (300 units) capacity Ft. Lauderdale (300 units) capacity Albuquerque (300 units) required
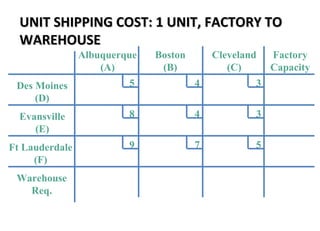
- 8. From (Sources) To (Destinations) Albuquerque Boston Cleveland Des Moines Evansville Fort Lauderdale $5 $8 $9 $4 $4 $7 $3 $3 $5 TRANSPORTATION PROBLEMTRANSPORTATION PROBLEM
- 9. Des Moines (D) Evansville (E) Ft Lauderdale (F) Warehouse Req. Albuquerque (A) Boston (B) Cleveland (C) Factory Capacity 5 4 3 3 57 48 9 UNIT SHIPPING COST: 1 UNIT, FACTORY TOUNIT SHIPPING COST: 1 UNIT, FACTORY TO WAREHOUSEWAREHOUSE
- 10. Des Moines (D) Evansville (E) Ft Lauderdale (F) Warehouse Req. Albuquerque (A) Boston (B) Cleveland (C) Factory Capacity 300 200 200 700 300 300 100 TOTAL DEMAND & TOTAL SUPPLYTOTAL DEMAND & TOTAL SUPPLY
- 11. Des Moines (D) Evansville (E) Ft Lauderdale (F) Warehouse Req. Albuquerque (A) Boston (B) Cleveland (C) Factory Capacity 300 200 200 700 300 300 100 5 4 3 3 57 48 9 TRANSPORTATION TABLETRANSPORTATION TABLE
- 12. • Start in the upper left-hand cell and allocate units to shipping routes as follows: – Exhaust the supply (factory capacity) of each row before moving down to the next row. – Exhaust the demand (warehouse) requirements of each column before moving to the next column to the right. – Check that all supply and demand requirements are met. NORTH - WEST CORNER METHODNORTH - WEST CORNER METHOD
- 13. Des Moines (D) Evansville (E) Ft Lauderdale (F) Warehouse Req. Albuquerque (A) Boston (B) Cleveland (C) Factory Capacity 300 200 200 700 300 300 100 5 4 3 3 57 48 9 100 200 100 100 200 NORTH - WEST CORNER METHOD (CONTD.)NORTH - WEST CORNER METHOD (CONTD.) Total = $4,200
- 14. Des Moines (D) Evansville (E) Ft Lauderdale (F) Warehouse Req. Albuquerque (A) Boston (B) Cleveland (C) Factory Capacity 2000 700 800 500 5 4 3 3 57 48 9 500 600 200 400 300 400 900 700 Total Cost: 10,200 LEAST COST METHODLEAST COST METHOD
- 15. Des Moines (D) Evansville (E) Ft Lauderdale (F) Warehouse Req. Albuquerque (A) Boston (B) Cleveland (C) Factory Capacity 2000 700 800 500 5 4 3 3 57 48 9 100 800 400 900 700 Total Cost: 9,100 400 700 SAME EXAMPLE WITH NWMSAME EXAMPLE WITH NWM


