 SPSS TUTORIALS
 SPSS TUTORIALS

ANOVA (analysis of variance) tests if 3+ population means are all equal.
Example: do the pupils of schools A, B and C have equal mean IQ scores?
This super simple introduction quickly walks you through the basics such as assumptions, null hypothesis and post hoc tests.
SPSS One-Way ANOVA tests whether the means on a metric variable for three or more groups of cases are all equal. The groups of cases are identified by a categorical variable.
Post hoc tests in ANOVA test if the difference between each possible pair of means is statistically significant.
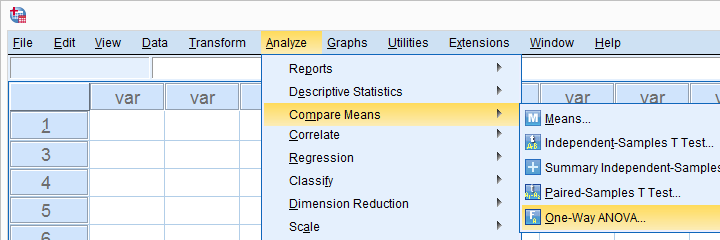
This step-by-step tutorial quickly walks you through the entire procedure.
In SPSS, you can run a one-way ANOVA without the actual data if you have sample sizes, means and SD’s.
The output may include post-hoc tests, effect sizes and power but not Levene's test or any normality tests.
Levene’s test examines if 2+ populations have equal variances on some variable.
This condition -known as the homogeneity of variance assumption- is required by t-tests and ANOVA.
So how to run and interpret this test in SPSS? This simple tutorial quickly walks you through.
If Levene’s test is “Significant“ for an ANOVA, the Welch and Games-Howell tests are good alternatives.
This tutorial quickly walks you through these analyses.
In ANOVA and regression, an interaction effect means that some effect depends on another variable.
Example: women become happier but men become unhappier if they have children. So the effect of having children depends on sex.
This tutorial walks you through testing for and interpreting interaction effects in ANOVA.
Run your SPSS two way ANOVA the right way in 5 simple steps. With downloadable data file, enhanced screenshots and annotated output.
Repeated measures ANOVA tests if 3+ variables have equal means in some population.
Example: are the mean scores on IQ tests A, B and C equal for all Dutch children?
This simple introduction quickly walks you through the basics.
SPSS Repeated measures ANOVA is a procedure for testing whether the means of 3 or more metric variables are equal. These variables have been measured on the same cases.
This step-by-step tutorial walks you through a repeated measures ANOVA with a within and a between-subjects factor in SPSS. Covers post hoc tests and the interaction effect as well.
The variance is a number that indicates how far a set of numbers lie apart. This tutorial explains the concept gently with examples and illustrations.
ANCOVA (analysis of covariance) tests if 2+ population means are equal while controlling for 1+ background variables.
Example: do medicines A, B and C result in equal mean blood pressures when controlling for age?
ANCOVA basically combines ANOVA and regression. This tutorial walks you through the analysis with an example in SPSS.
THIS TUTORIAL HAS 7 COMMENTS:
By Abdulkadir Mudiyu on October 22nd, 2023
Please I am a student of poor mathematics knowledge can you please help me to become a very good in statstics. Thank you.
By Sebastian Wilck on January 1st, 2025
Great tutorial, thank you!