TrendWave Bands [BigBeluga]This is a trend-following indicator that dynamically adapts to market trends using upper and lower bands. It visually highlights trend strength and duration through color intensity while providing additional wave bands for deeper trend analysis.
🔵Key Features:
Adaptive Trend Bands:
➣ Displays a lower band in uptrends and an upper band in downtrends to indicate trend direction.
➣ The bands act as dynamic support and resistance levels, helping traders identify potential entry and exit points.
Wave Bands for Additional Analysis:
➣ A dashed wave band appears opposite the main trend band for deeper trend confirmation.
➣ In an uptrend, the upper dashed wave band helps analyze momentum, while in a downtrend, the lower dashed wave band serves the same purpose.
Gradient Color Intensity:
➣ The trend bands have a color gradient that fades as the trend continues, helping traders visualize trend duration.
➣ The wave bands have an inverse gradient effect—starting with low intensity at the trend's beginning and increasing in intensity as the trend progresses.
Trend Change Signals:
➣ Circular markers appear at trend reversals, providing clear entry and exit points.
➣ These signals mark transitions between bullish and bearish phases based on price action.
🔵Usage:
Trend Following: Use the lower band for confirmation in uptrends and the upper band in downtrends to stay on the right side of the market.
Trend Duration Analysis: Gradient wavebands give an idea of the duration of the current trend — new trends will have high-intensity colored wavebands and as time goes on, trends will fade.
Trend Reversal Detection: Circular markers highlight trend shifts, making it easier to spot entry and exit opportunities.
Volatility Awareness: Volatility-based bands help traders adjust their strategies based on market volatility, ensuring better risk management.
TrendWave Bands is a powerful tool for traders seeking to follow market trends with enhanced visual clarity. By combining trend bands, wave bands, and gradient-based color scaling, it provides a detailed view of market dynamics and trend evolution.
Indicators and strategies

[blackcat] L2 Gradient RSIVWAPOVERVIEW
The L2 Gradient RSIVWAP indicator offers traders a powerful tool for assessing market conditions by combining Relative Strength Index (RSI) with Volume Weighted Average Price (VWAP). It features dynamic coloring and clear buy/sell signals to enhance decision-making.
Customizable Inputs: Adjust key parameters such as RSI-VWAP length, oversold/overbought levels, and smoothing period.
Gradient Color Visualization: Provides intuitive gradient coloring to represent RSI-VWAP values.
Buy/Sell Indicators: On-chart labels highlight potential buying and selling opportunities.
Transparent Fills: Visually distinguishes overbought and oversold zones without obscuring other data.
Access the TradingView platform and select the chart where you wish to implement the indicator.
Go to “Indicators” in the toolbar and search for “ L2 Gradient RSIVWAP.”
Click “Add to Chart” to integrate the indicator into your chart.
Customize settings via the input options:
Toggle between standard RSI and RSI-based VWAP.
Set preferred lengths and thresholds for RSI-VWAP calculations.
Configure the smoothing period for ALMA.
Performance can vary based on asset characteristics like liquidity and volatility.
Historical backtests do not predict future market behavior accurately.
The ALMA function, developed by Arnaud Legoux, enhances response times relative to simple moving averages.
Buy and sell signals are derived from RSI-VWAP crossovers; consider additional factors before making trades.
Special thanks to Arnaud Legoux for creating the ALMA function.

SuperTrend AI with RSI, EMA & Dynamic S/RSupport, resistance, entry and exit signals, and combining the average with the relative strength

Ask2Maniish- Smart Money Volume Analyzer
Ask2Maniish - Smart Money Volume Analyzer
Overview
This Pine Script indicator provides a powerful combination of volume analysis, liquidity zone detection, fair value gaps (FVG), support & resistance (S/R), and imbalance identification. It helps traders identify key market areas where price action and volume dynamics indicate potential trading opportunities.
Key Features
1. Volume Analysis
Volume Spikes (🔥 Orange): Highlights sudden increases in volume.
Extreme Low Volume (🟣 Purple): Detects lowest market activity.
Higher Volume (Above Avg.) (🟢 Lime Green): Strong volume increase.
Higher Volume (Below Avg.) (🟩 Green): Moderate volume increase.
Lower Volume (Above Avg.) (🟥 Maroon): High but declining volume.
Lower Volume (Below Avg.) (🔴 Red): Weak market participation.
Neutral Volume (⚪ Gray): No significant volume change.
ATR-Based Dynamic Multiplier: Adapts high-volume thresholds based on ATR.
Customizable Volume Moving Average (Vol MA): For trend analysis.
2. Liquidity Zones
Identifies liquidity high and low zones based on the highest and lowest price levels over a user-defined period.
Background shading to indicate liquidity zones (Green for high, Red for low).
Alerts for price entering liquidity zones.
3. Support & Resistance (S/R) Detection
Pivot-Based S/R: Identifies significant swing points based on pivots.
Fractal-Based S/R: Uses Bill Williams’ fractal method for support & resistance detection.
4. Fair Value Gaps (FVG) & Imbalance Detection
Bullish FVGs: Highlighting areas of price inefficiency for potential upward moves.
Bearish FVGs: Highlighting areas of price inefficiency for potential downward moves.
Customizable visualization of FVGs.
5. VWAP (Volume Weighted Average Price)
Displays VWAP for intraday trading insights.
6. Moving Averages
Supports multiple moving average types (SMA, EMA, HMA, SMMA, WMA, VWMA).
Customizable Short MA & Long MA settings for trend identification.
7. Alerts
Volume Spike Alerts: Detects high-volume spikes.
Liquidity Zone Alerts: Notifies when price enters a liquidity zone.
Custom alerts for other key conditions.
8. Visualization & Customization
Customizable colors and opacity settings.
User-controlled toggles for various features (Volume MA, VWAP, Liquidity Zones, S/R, etc.).
Table Display for Volume Conditions: Displays key volume metrics in an on-chart table.
How to Use the Indicator
1. Enable/Disable Features
Use input settings to toggle volume spikes, liquidity zones, FVGs, VWAP, etc.
2. Identify Key Market Areas
Look for volume spikes (🔥) to detect strong market participation.
Observe liquidity zones to anticipate areas of interest.
Use S/R and FVGs for trade decision-making.
3. Set Alerts
Utilize built-in alerts to get notified of significant volume and liquidity events.
4. Analyze Trend with Moving Averages
Choose between SMA, EMA, HMA, SMMA, WMA, or VWMA to suit your strategy.
Customization Options
Adjustable period settings for Liquidity Zones and FVG Sensitivity.
Customizable volume thresholds and color coding.
Toggle visibility for individual features to avoid chart clutter.
Final Thoughts
This indicator combines volume, liquidity, S/R, and imbalance analysis into a single tool for more precise trade decisions. Customize it based on your trading style and market conditions for better accuracy.
🚀 Enhance your trading with Ask2Maniish - Volume Spikes Analyzer, S/R, FVG, Imbalance & Liquidity Zone! 🚀

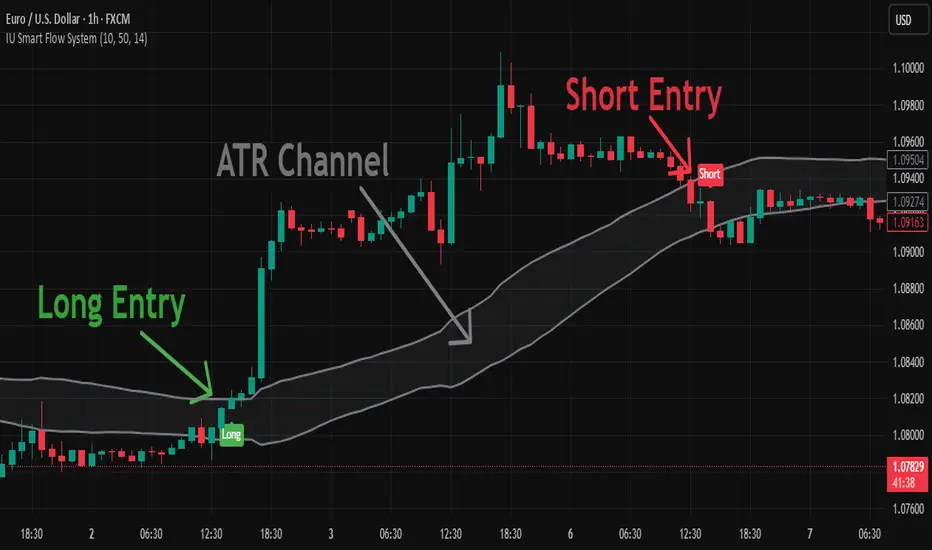
IU Smart Flow SystemDESCRIPTION
The IU Smart Flow System is a powerful and dynamic order flow-based strategy designed to capture high-probability trades by analyzing bullish and bearish imbalances, trend direction, and RSI strength. It identifies trading opportunities by aligning order flow conditions with the prevailing trend and momentum, making it suitable for trend-following and momentum-based trading.
This system utilizes a unique combination of:
- Order flow score to gauge market imbalance
- Trend filter using SMA and ATR to confirm market direction
- RSI to ensure entry only during strong momentum
USER INPUTS:
- Imbalance Length: Defines the lookback period for calculating bullish and bearish imbalances. (Default: 10)
- Trend Length: Determines the length of the SMA to evaluate the trend direction. (Default: 50)
- RSI Length: Specifies the RSI period to assess momentum strength. (Default: 14)
LONG CONDITIONS:
Long entries are triggered when:
- Order flow score is positive, indicating bullish imbalance
- Price is above the bullish trend level (SMA + ATR), confirming an uptrend
- RSI is above 50, indicating bullish momentum
- No active short position is currently open
SHORT CONDITIONS:
Short entries are triggered when:
- Order flow score is negative, indicating bearish imbalance
- Price is below the bearish trend level (SMA - ATR), confirming a downtrend
- RSI is below 50, indicating bearish momentum
- No active long position is currently open
WHY IT IS UNIQUE:
- Imbalance-Based Approach: Unlike traditional strategies that rely solely on price action, this system evaluates bullish and bearish imbalances to anticipate order flow direction.
- Adaptive Trend Filter: The combination of SMA and ATR dynamically adjusts to market volatility, providing a reliable trend confirmation mechanism.
- Momentum Validation with RSI: Ensures that entries are taken only in the direction of strong momentum, reducing false signals.
HOW USERS CAN BENEFIT FROM IT:
- Enhanced Trade Accuracy: Aligning order flow, trend, and momentum reduces false signals and improves trade success rates.
- Versatile Application: Suitable for various markets and timeframes, making it adaptable to different trading styles.
- Clear Trade Signals: Provides clear entry labels and alerts, ensuring traders never miss a potential opportunity.
- Visual Clarity: The filled region between bullish and bearish trends highlights trend direction, enhancing decision-making.
SuperTrend MTF Pro [Cometreon]The SuperTrend MTF Pro takes the classic SuperTrend to a whole new level of customization and accuracy. Unlike the standard version, this indicator allows you to select different moving averages, apply it to various chart types, and fine-tune every key parameter.
If you're looking for an advanced, non-repainting, and highly configurable SuperTrend, this is the right choice for you.
🔷 New Features and Improvements
🟩 Multi-MA SuperTrend
Now you can customize the SuperTrend calculation by choosing from 15 different moving averages:
SMA (Simple Moving Average)
EMA (Exponential Moving Average)
WMA (Weighted Moving Average)
RMA (Smoothed Moving Average)
HMA (Hull Moving Average)
JMA (Jurik Moving Average)
DEMA (Double Exponential Moving Average)
TEMA (Triple Exponential Moving Average)
LSMA (Least Squares Moving Average)
VWMA (Volume-Weighted Moving Average)
SMMA (Smoothed Moving Average)
KAMA (Kaufman’s Adaptive Moving Average)
ALMA (Arnaud Legoux Moving Average)
FRAMA (Fractal Adaptive Moving Average)
VIDYA (Variable Index Dynamic Average)
🟩 Multiple Chart Types
You're no longer limited to candlestick charts! Now you can use SuperTrend with different chart formats, including:
Heikin Ashi
Renko
Kagi
Line Break
Point & Figure
🟩 Customizable Timeframe
Now you can adjust the SuperTrend timeframe without repainting issues, avoiding signal distortions.
🔷 Technical Details and Customizable Inputs
SuperTrend offers multiple customization options to fit any trading strategy:
1️⃣ ATR Period – Defines the ATR length, affecting the indicator’s sensitivity.
2️⃣ Source – Selects the price value used for calculations (Close, HL2, Open, etc.).
3️⃣ ATR Mult – Multiplies the ATR to determine band distance. Higher values reduce false signals, lower values make it more reactive.
4️⃣ Change ATR Calculation Method – When enabled, uses the default ATR method; when disabled, allows selecting another Moving Average with "Use Different Type".
5️⃣ Source Break – Defines the price source for trend changes (Close for more stability, High/Low for more reactivity).
6️⃣ Use Different Type – Allows selecting an alternative Moving Average for ATR calculation if "Change ATR Calculation Method" is disabled.
7️⃣ SuperTrend Type – Advanced options for specific MAs (JMA, ALMA, FRAMA, VIDYA), with dedicated parameters like Phase, Sigma, and Offset for optimized responsiveness.
8️⃣ Ticker Settings – Customize parameters for special chart types such as Renko, Heikin Ashi, Kagi, Line Break, and Point & Figure, adjusting reversal, number of lines, and ATR length.
9️⃣ Timeframe – Enables using SuperTrend on a higher timeframe.
🔟 Wait for Timeframe Closes -
Enabled ✅ – Prevents multiple signals, useful for precise alerts.
Disabled ❌ – Displays SuperTrend smoothly without interruptions.
🔷 How to Use SuperTrend MTF Pro
🔍 Identifying Trends
SuperTrend follows the ongoing trend and provides clear visual signals:
When the price is above the line, the trend is bullish.
When the price is below the line, the trend is bearish.
📈 Interpreting Signals
Line color and position change → Possible trend reversal
Bounce off the line → Potential trend continuation
Strong breakout of the line → Possible reversal
🛠 Integration with Other Tools
RSI or MACD to filter false signals
Moving Averages to confirm trend direction
Support and Resistance to improve entry points
☄️ If you find this indicator useful, leave a Boost to support its development!
Every feedback helps to continuously improve the tool, offering an even more effective trading experience. Share your thoughts in the comments! 🚀🔥

SENEE Buy Sell Signal Easy to use:
Buy signal has appeared >>> open long position
Sell signal has appeared >>> open short position
Green ext signal has appeared >>> close long position
Red ext signal has appeared >>> close short position
The colour is an analysis of the trend:
Green bars >>> Up trend
Red bars >>> Down trend
White bars >>> side way
Blue bars >>> Overbought
Orange bars >>> Oversold
How to be setting:
Candles period is Calculation range >>> up to you
Overbought oversold sensitivity is Sensitivity of calculation of
Overbought and Oversold zone
Signal sensitivity is Sensitivity of calculation of Buy,Sell and ext signals
///// Good luck /////

MA SniperThis indicator automatically finds the most effective moving average to use in a price crossover strategy—so you can focus on trading, not testing. It continuously evaluates a wide range of moving average periods, ranks them based on real-time market performance, and selects the one delivering the highest quality signals. The result? A smarter, adaptive tool that shows you exactly when price crosses its optimal moving average—bullish signals in green, bearish in red.
What makes it unique is the way it thinks.
Under the hood, the script doesn’t just pick a random MA or let you choose one manually. Instead, it backtests a large panel of moving average lengths for the current asset and timeframe. It evaluates each one by calculating its **Profit Factor**—a key performance metric used by pros to measure the quality of a strategy. Then, it assigns each MA a score and ranks them in a clean, built-in table so you can see, at a glance, which ones are currently most effective.
From that list, it picks the top-performing MA and uses it to generate live crossover signals on your chart. That MA is plotted automatically, and the signals adapt in real-time. This isn’t a static setup—it’s a dynamic system that evolves as the market evolves.
Even better: the indicator detects the type of instrument you’re trading (forex, stocks, etc.) and adjusts its internal calculations accordingly, including how many bars per day to consider. That means it remains highly accurate whether you’re trading EURUSD, SPX500, or TSLA.
You also get a real-time dashboard (via the table) that acts as a transparent scorecard. Want to see how other MAs are doing? You can. Want to understand why a certain MA was selected? The data is right there.
This tool is for traders who love crossover strategies but want something smarter, faster, and more precise—without spending hours manually testing. Whether you're scalping or swing trading, it offers a data-driven edge that’s hard to ignore.
Give it a try—you’ll quickly see how powerful it can be when your MA does the thinking for you.
This tool is for informational and educational purposes only. Trading involves risk, and past performance does not guarantee future results. Use responsibly.

Advanced Trend Indicator🚀 Overview:
The Advanced Trend Indicator is a powerful and reliable tool designed to identify strong market trends with high accuracy. It works seamlessly across stocks, indices, commodities, and cryptocurrencies, making it a versatile asset for traders of all levels.
🎯 Key Features:
✅ EMA Crossover with ADX Filter - Confirms strong trend momentum before signaling entry.
✅ Buy & Sell Signals - Clear and visually appealing labels for trade execution.
✅ Dynamic Background Coloring - Instantly highlights bullish and bearish market conditions.
✅ Trend Strength Meter - Histogram visualization to gauge market direction.
✅ Minimalist & Non-Cluttering Design - Ensures a smooth and distraction-free trading experience.
📊 How It Works:
🔹 Fast & Slow EMA Crossover: The script uses a 9-period Exponential Moving Average (EMA) and a 21-period EMA to detect bullish and bearish trends.
🔹 ADX Confirmation: A 14-period Average Directional Index (ADX) ensures only strong trends generate signals, reducing false entries.
🔹 Buy Signal: Triggered when the fast EMA crosses above the slow EMA AND ADX confirms strong trend strength.
🔹 Sell Signal: Triggered when the fast EMA crosses below the slow EMA AND ADX confirms bearish momentum.
🔹 Trend Strength Meter: Displays bullish (lime) or bearish (maroon) trend intensity for quick visual insights.
🎨 Visual Enhancements:
Buy Signal 🟢: "BUY ✅" label appears at the lowest point of the candle.
Sell Signal 🔴: "SELL ❌" label appears at the highest point of the candle.
Trend Strength Box: Indicates whether the market is in a Strong Uptrend 🔼, Strong Downtrend 🔽, or Neutral 🔍.
Adaptive Background Color: Greenish shade for bullish conditions, reddish shade for bearish conditions.
📈 Best Used On:
📌 Intraday & Swing Trading (Optimized for 5m, 15m, 1H, 4H, and Daily charts)
📌 Works on All Assets (Equities, Forex, Commodities, Indices, and Crypto)
⚡ Why Choose This Indicator?
✅ High Accuracy & Low False Signals 📊
✅ Lightweight & Lag-Free Performance 🚀
✅ Customizable & User-Friendly 🎛️
🚀 Start Trading Smarter with the Advanced Trend Indicator Today! 📉📈

DC | SMC Pro Tool by SmileCrypto2018ndicator Description – DC | SMC Pro Tool by SmileCrypto2018
DC | SMC Pro Tool is a professional Smart Money Concept (SMC) indicator developed exclusively for Digital Carmel College.
It is designed to identify key market structures including Swing Highs/Lows, Supply & Demand zones, Break of Structure (BOS), Change of Character (CHoCH), and Liquidity Zones.
This tool helps traders spot high-probability trade setups by visually marking:
✅ Supply & Demand zones with precision
✅ BOS/CHoCH levels with automatic detection
✅ Liquidity sweeps above/below key levels
✅ Entry points with predefined Stop Loss (SL) and Take Profit (TP1–TP3) levels
Built with clarity, performance, and SMC logic in mind –
this tool is ideal for scalpers, intraday, and swing traders alike.
Created by SmileCrypto2018 for students of Digital Carmel College (DC).
V2

[COG]Adaptive Volatility Bands# Adaptive Volatility Bands (AVB) Indicator Guide for Traders
## Special Acknowledgment 🙌
This script is inspired by and builds upon the foundational work of **DonovanWall**, a respected contributor to the trading community. His innovative approach to adaptive indicators has been instrumental in developing this advanced trading tool.
## What is the Adaptive Volatility Bands Indicator?
The Adaptive Volatility Bands (AVB) is a sophisticated technical analysis tool designed to help traders understand market dynamics by creating dynamic, responsive price channels that adapt to changing market conditions. Unlike traditional static indicators, this script uses advanced mathematical techniques to create flexible bands that adjust to market volatility in real-time.
## Key Features and Inputs
### 1. Price and Filtering Options
- **Price Source**: Determines the base price used for calculations (default is HLC3 - Average of High, Low, and Close)
- **Filter Poles**: Controls the smoothness of the indicator (1-9 poles)
- Lower values: More responsive, more noise
- Higher values: Smoother, but slower to react
### 2. Volatility and Band Settings
- **Sample Length**: Determines how many bars are used to calculate volatility (default 144)
- **Volatility Multiplier**: Adjusts the width of the main bands (default 1.414)
- **Outer Band Multiplier**: Controls the width of the outer bands (default 2.5)
- **Inner Band Ratio**: Positions the inner bands between the center and outer bands (default 0.25)
### 3. Advanced Processing Options
- **Lag Reduction Mode**: Helps reduce indicator delay
- **Fast Response Mode**: Makes the indicator more responsive to recent price changes
### 4. Signal and Visualization Options
- **Show Entry Signals**: Displays buy and sell signals
- **Signal Display Style**: Choose between labels or shapes
- **Range Filter**: Adds an additional filter for signal validation
## How the Indicator Works
The Adaptive Volatility Bands create a dynamic price channel with three key components:
1. **Center Line**: Represents the core trend direction
2. **Inner Bands**: Closer to the center line
3. **Outer Bands**: Wider bands that show broader price potential
### Color Dynamics
- The indicator uses a smart color gradient system
- Colors change based on price position within the bands
- Helps visualize bullish (green/blue) and bearish (red) market conditions
## Trading Strategies for Beginners
### Basic Entry Signals
- **Buy Signal**:
- Price touches the center line from below
- Candle is bullish (closes higher than it opens)
- Price is above the center line
- Trend is upward
- **Sell Signal**:
- Price touches the center line from above
- Candle is bearish (closes lower than it opens)
- Price is below the center line
- Trend is downward
### Risk Management Tips
1. Use the bands to identify:
- Potential trend changes
- Volatility levels
- Support and resistance areas
2. Combine with other indicators for confirmation
3. Always use stop-loss orders
4. Adjust parameters to match your trading style and asset
## When to Use This Indicator
Best suited for:
- Trending markets
- Swing trading
- Identifying potential entry and exit points
- Understanding market volatility
### Recommended Markets
- Stocks
- Forex
- Cryptocurrencies
- Futures
## Customization
The script offers extensive customization:
- Adjust smoothness
- Change band multipliers
- Modify color schemes
- Enable/disable features like lag reduction
## Important Considerations for Beginners
🚨 **Disclaimer**:
- No indicator guarantees profits
- Always practice with a demo account first
- Learn and understand the indicator before live trading
- Market conditions change, so continually adapt your strategy
## Getting Started
1. Add the script to your TradingView chart
2. Experiment with different settings
3. Backtest on historical data
4. Start with small positions
5. Continuously learn and improve
Happy Trading! 📈🔍
Realtime HTF Candle [NLR]This lightweight indicator displays higher timeframe candles on your current chart - in real-time as they form, not just after they close.
Unlike most HTF candle indicators that only show completed candles (and often feel bloated with too many features), this script updates the current HTF candle live, including its open, high, low, and close as it develops.
🔹 Features:
Draws full-body HTF candles (high-to-low and open-to-close ranges).
Supports any custom HTF (e.g., 15m candles on a 1m chart).
Color-coded boxes to differentiate between bullish and bearish candles.
Live updating HTF candle box as price evolves — no delay.
Optional moving average overlays with smoothing to help track short- and long-term trends.
Perfect for intraday traders who want to stay aligned with higher timeframe structure without clogging up their charts.

GIGANEVA V6.6 PublicFib levels and Fib Fans from Top and Bottom of the "Range".
Plots are calculated on Log and Linear Scale.
It calculates Time pivots by fans crossing each other
It calculates Time pivots by fans crossing top and bottom of the "Range"
Golden pivots are 0.5 fan crossing log 0.5 or via versa
Selecting Bool Fib Right, expends them Right, no matter how you picked top or bottom (doesn't matter which you picked first.
Why is this code unique?
It incorporates all the fib functions together and it's coded to the max Plot capabilities Trading View allows.

Smart Money Concepts (SMC) Indicator for Altcoin Scalpingquent movement. It implements filtering mechanisms to display only relevant order blocks and differentiates between premium and discount zones.
2. Multi-timeframe Analysis
Order blocks are detected across three timeframes (1-minute, 5-minute, and 15-minute), with visual differentiation between zones from different timeframes. The indicator includes a confluence detector that identifies when zones from multiple timeframes overlap, highlighting these high-probability areas.
3. Liquidity Analysis
The indicator detects areas of high liquidation activity, identifies stop hunts and liquidity sweeps, and monitors the formation of fresh order blocks that indicate smart money activity.
4. Entry, Stop-Loss, and Take-Profit Signals
Clear entry signals are generated when price approaches validated order blocks, with adaptive stop-loss placement based on market volatility and zone strength. Take-profit targets are calculated using risk-to-reward multipliers, and the risk-to-reward ratio is displayed for each potential trade.
5. Volume Profile Integration
Volume analysis is integrated to confirm order block validity, with anomalous volume spikes highlighted and a volume-weighted effectiveness score assigned to each zone.
6. Technical Indicator Integration
The indicator incorporates customizable momentum oscillators (RSI and MACD) to confirm zone strength, with divergence detection to enhance entry accuracy.
7. Performance Metrics
Historical performance tracking is included, calculating win rate, average risk-to-reward ratio, and expectancy for generated signals, with a performance index score for each trading opportunity.
8. Alert System
Comprehensive alerts are implemented for approaches to order blocks, entries, take-profits, and stop-losses, with priority alerts based on zone strength and multi-timeframe confluence.
9. Visual Design
The indicator uses distinct color schemes for bearish and bullish order blocks, with transparency options to maintain chart clarity. Features can be toggled on/off for customization, and clear visual indicators are provided for entry, stop-loss, and take-profit levels.
10. Automatic Detection and Optimization
The indicator provides fully automated identification of all zones and signals, with adaptive parameters that adjust to different market conditions and optimization capabilities based on recent market behavior.
Implementation Details
The code is thoroughly documented with clear sections for:
User configuration parameters (fully customizable)
Data structure definitions for order blocks, entry signals, and liquidity zones
Core detection algorithms for order blocks and liquidity zones
Multi-timeframe analysis with higher timeframe data integration
Entry signal generation with adaptive risk management
Performance tracking and metrics calculation
Visual elements for clear chart representation
Using the Indicator
To use this indicator:
Compile and add to your chart
Adjust the settings via the indicator parameters panel to optimize for your trading style
Focus on trading from the order blocks with highest strength and multi-timeframe confluence
The indicator is specifically optimized for 1-minute timeframe altcoin cryptocurrency scalping but incorporates data from higher timeframes to identify high-probability trading opportunities.

[blackcat] L3 Breakout IndicatorOVERVIEW
This script provides a breakout detection system ( L3 Breakout Indicator) analyzing price momentum across timeframes. It identifies market entry/exit zones through dynamically scaled thresholds and visual feedback layers.
FEATURES
Dual momentum visualization: • Price Momentum Ratio Plot ( yellow ) • Filtered Signal Value Plot ( fuchsia )
Adjustable trade boundaries: ▪ Lower Threshold (default: 0.5) ▪ Upper Threshold (default: 2.9) ▪ Central boundary ( fixed at 2.0 )
Real-time visual feedback: ☀ Buy zone highlights ( lime ) on momentum crossover ⚠ Sell zone highlights ( red ) on momentum cross-under ♦ Dynamic convergence area between plots ( colored gradient )
HOW TO USE
Interpretation Flow
Monitor momentum plots relative to threshold lines
Actionable signals occur when momentum crosses thresholds
Persistent movement above/below central boundary indicates trend continuation
Key Zones
• Below 0.5: Potential buying opportunity zone
• Above 2.0: Cautionary selling region
• Between 0.5-2.0: Neutral consolidation phase
Optimization Tips
Adjust thresholds based on asset volatility
Combine with volume metrics for confirmation
Backtest parameters using historical data
LIMITATIONS
• Lag induced by 4-period EMA smoothing
• Historical dependency in calculating extremes (lowest(100)/highest(250))
• No built-in risk management protocols (stop loss take profit)
• Performance variability during sideways markets

[blackcat] L3 Volatility Ehlers Stochastic CGOOVERVIEW
This advanced indicator integrates the Center of Gravity Oscillator (CGO) with an Ehlers-Stochastic framework and an Adaptive Local Minimum-Maximum Average (ALMA) smoothing algorithm. Designed for non-overlaid charts, it identifies market momentum shifts by analyzing price action through multi-layer volatility analysis.
FEATURES
• Dual-line system:
✓ Stochastic CGO: Core oscillating line derived from weighted OHLC price calculations
✓ ALMA Lagging Line: Smoothing component using customizable offset/sigma parameters
• Dynamic color scheme:
✓ Green/red trend differentiation via crossover comparison
✓ Optional fill areas between lines (toggleable)
• Clear trade signals:
✓ Buy/Sell labels triggered by mathematically defined crossovers
✓ Zero-reference baseline marker (#0ebb23)
• Customizable parameters:
Fast Length (9 default) controls CGO sensitivity
Slow Length (5 default) governs ALMA responsiveness
ALMA Offset/Sigma allow adaptive curve optimization
HOW TO USE
Configure core parameters:
• Adjust Fast Length (CGO timeframe window)
• Set Slow Length, ALMA Offset, and Sigma for smoother/laggier response
Interpret visuals:
• Bullish trend = green shaded zone (when primary line above lagging line)
• Bearish trend = red shaded zone (primary line below lagging line)
Analyze signals:
• Buy triggers occur when rising CGO crosses above ALMA while below zero
• Sell triggers activate when falling CGO breaks below ALMA after exceeding zero base
Optimize display:
✓ Enable/disable fill area via Fill Between Lines
LIMITATIONS
• Relies heavily on lookback periods - rapid market changes may reduce predictive accuracy
• Signal frequency increases during high-volatility environments
• Requires additional confirmation methods due to occasional premature crossovers
• Default parameter settings may lack universality across asset classes
NOTES
• Best paired with volume-based confirmations for stronger signals
• Reducing ALMA Sigma sharpens line responsiveness at cost of noise susceptibility
• Increasing Fast Length extends calculation horizon while reducing peak sensitivity
• Weighted OHLC source formula prioritizes closing prices for swing direction assessment

Reversal Trade DetectorThe original script is a "Reversal Trade Detector" that identifies potential reversal points in the market based on two key concepts:
CHoCH (Change of Character) - Identifies shifts in market structure
IDM (Internal Distorted Move) - Detects potential reversal points within the established structure
The indicator uses swing detection to identify high and low points, then determines market structure using those points. When a reversal pattern forms (IDM) against the established structure, it generates a signal if the potential move meets a minimum percentage threshold.
Strategy Improvements I've Made
I've transformed this indicator into a complete trading strategy with these key enhancements:
1. Risk Management with ATR
Added Average True Range (ATR) for dynamic stop-loss and take-profit levels
Configurable multipliers to adjust risk/reward ratio
Both TP and SL are shown on chart and included in trade labels
2. Multiple Filtering Mechanisms
Volume Filter: Requires above-average volume for signal confirmation
Trend Filter: Uses a 200-period EMA to ensure trades align with the long-term trend
RSI Filter: Adds oversold/overbought conditions for better entry timing
3. Strategy Components
Proper entry and exit commands for backtesting
Position sizing based on percentage of equity (default 10%)
Enhanced info table with key metrics
Visual indicators for entry points and active TP/SL levels
4. Implementation Details
The strategy maintains the core logic of the original indicator while adding:
Entry Conditions:
For long positions: Bearish structure + bullish IDM + close > open + price near IDM level + sufficient potential + passing all filters
For short positions: Bullish structure + bearish IDM + close < open + price near IDM level + sufficient potential + passing all filters
Exit Conditions:
Take profit: Current price + (ATR × TP multiplier)
Stop loss: Current price - (ATR × SL multiplier)
Usage Instructions
Apply the strategy to any chart
Adjust the original parameters (detection periods, minimum move) as needed
Fine-tune the risk parameters (ATR period, TP/SL multipliers)
Enable/disable filters based on your trading preferences
Backtest on historical data to verify performance
This strategy maintains the core reversal detection logic while adding proper risk management and filtering mechanisms to improve profitability and reduce false signals.

Rev&Line with TrendMarker - CoffeeKillerRev&Line with TrendMarker - Update Guide
🔔 **Warning: This Indicator Repaints** 🔔 This indicator uses real-time calculations that may change based on future price action. As a result, signals (such as arrows, lines, or color changes) **can and will repaint** — meaning they may appear, disappear, or shift after a candle closes.
**Do not rely on this tool alone for live trading decisions.** Use with caution and always confirm with non-repainting tools or additional analysis. (I planned to make this an update to the Rev&Line indicator but the greater minds said my write-up was too long, so it's getting published as a new indicator. Please refer to the Rev&Line indicator for a proper write-up on it.)
Major Updates & Enhancements
The Rev&Line indicator has been significantly enhanced with the integration of the TrendMarker system, adding powerful trend detection capabilities and intelligently connecting them with the existing marker lines. Here's what's new:
1. TrendMarker Integration
The original Rev&Line indicator has been expanded to include a comprehensive trend detection system that combines:
1. SuperTrend Algorithm
- ATR-based trend detection with customizable period and factor
- Direction-based logic to determine bull/bear market conditions
- Optional trend line visualization
2. Parabolic SAR
- Classic trend-following indicator with start, increment, and maximum parameters
- Used as confirmation for the SuperTrend signals
- Optional plotting of SAR points
3. Smart Background Coloring
- Green fluorescent background when both SuperTrend and PSAR indicate bullish conditions
- Red fluorescent background when both SuperTrend and PSAR indicate bearish conditions
- Customizable transparency levels
2. Enhanced Marker Lines System
The marker lines functionality has been completely revolutionized:
Before:
- Marker lines were reset based on pivot detection in the ZigZag system
- Resets occurred when new pivot lows or highs were identified
Now:
- Marker lines reset based on SuperTrend direction changes
- When SuperTrend changes from bearish to bullish, high marker lines reset
- When SuperTrend changes from bullish to bearish, low marker lines reset
- This creates a much more responsive and trend-aligned marker system
How the New Marker Lines Work
Trend-Based Reset Mechanism
The most important change is the marker line reset logic that now uses SuperTrend direction changes instead of ZigZag pivots.
This creates a system where:
1. When the market transitions from bearish to bullish (SuperTrend direction changes from -1 to 1):
- The high marker line resets, establishing a new range base
- This allows the indicator to track the new uptrend from its beginning
2. When the market transitions from bullish to bearish (SuperTrend direction changes from 1 to -1):
- The low marker line resets, establishing a new range base
- This allows the indicator to track the new downtrend from its beginning
Trading Applications
This trend-synchronized marker system offers several advantages:
1. Trend-Aligned Range Tracking
- Marker lines now automatically reset at trend changes
- Ranges are more relevant to the current market phase
- Percentage position becomes more meaningful for decision-making
2. Improved Breakout Detection
- High marker line now represents resistance established during the current bullish phase
- Low marker line now represents support established during the current bearish phase
- Breaks above/below these lines have greater significance
3. Enhanced Visual Clarity
- Background coloring clearly indicates the trend direction
- Marker lines show the range established during the current trend
- Percentage labels provide context within the trend range
New Parameter Groups
SuperTrend Parameters
- **ATR Period**: Period for Average True Range calculation (default: 4)
- **Factor**: Multiplier for ATR to determine band width (default: 1.0)
- **Show SuperTrend Line**: Toggle to display the SuperTrend line on chart (default: false)
Parabolic SAR Parameters
- **Start**: Initial acceleration factor (default: 0.02)
- **Increment**: Step value for acceleration factor (default: 0.02)
- **Max Value**: Maximum acceleration factor (default: 0.2)
- **Show Parabolic SAR Points**: Toggle to display SAR points on chart (default: false)
- **Parabolic SAR Trend Highlight**: Background color based on trend (default: true)
- **Background Transparency**: Opacity of background highlighting (default: 95)
Marker Lines Parameters (Enhanced)
- All original marker line settings are preserved
- The behavior is now tied to trend changes instead of pivots
Practical Usage
1. Trend Identification
- Green background: Strong bullish trend (both SuperTrend and PSAR aligned)
- Red background: Strong bearish trend (both SuperTrend and PSAR aligned)
- No background: Mixed or transitioning signals
2. Range Trading Within Trends
- During bullish trends:
* Use the high marker line as resistance level
* Use the low marker line as support level
* Consider entries near the low marker line with targets toward the high marker line
- During bearish trends:
* Use the low marker line as support level that may break
* Use the high marker line as resistance level
* Consider short entries near the high marker line with targets toward the low marker line
3. Percentage Position Trading
- In bullish trends: Look for long entries when percentage position is low (0-30%)
- In bearish trends: Look for short entries when percentage position is high (70-100%)
- Use the position marker to gauge current location within the trend range
4. Breakout Confirmation
- Breaks above the high marker line during bullish trends: Strong continuation signal
- Breaks below the low marker line during bearish trends: Strong continuation signal
- Trend changes that coincide with marker line breaks: Powerful reversal signals
Strategy Examples
Trend-Aligned Range Strategy
1. Identify the market trend using the background color
2. Wait for a pullback to the 0-30% zone during bullish trends
3. Enter long positions with targets at the 70-100% zone
4. Use the opposite approach during bearish trends
Trend Change Strategy
1. Monitor for SuperTrend direction changes (marker line resets)
2. Confirm with PSAR alignment (background color change)
3. Enter in the new trend direction after the first reset of marker lines
4. Place stops beyond the recent swing high/low
Breakout Confirmation Strategy
1. Identify consolidation phases where price oscillates between marker lines
2. Wait for a decisive break above/below marker lines in the direction of the background color
3. Enter on the breakout with targets at the next significant level
4. Use trend changes as warning signals for potential reversals
Best Practices
1. Combined Confirmation
- Use both SuperTrend and PSAR alignment for highest probability trades
- Look for ZigZag pivot confirmations in the same direction
- Wait for marker line resets to complete before entering new trend trades
2. Range Context
- Consider the distance between high and low marker lines
- Wider ranges suggest higher volatility and potential for larger moves
- Narrower ranges suggest consolidation and potential breakout opportunities
3. Visual Harmony
- Background color should align with overall direction of price movement
- Marker lines should contain most price action during the trend
- Percentage position should correlate with relative price location
Remember, the enhanced TrendMarker integration makes the Rev&Line indicator a more complete trading system, but always use proper risk management and confirm signals with other analysis methods.
**DISCLAIMER**: This indicator and its signals are intended solely for educational and informational purposes. They do not constitute financial advice. Trading involves significant risk of loss. Always conduct your own analysis and consult with financial professionals before making trading decisions.

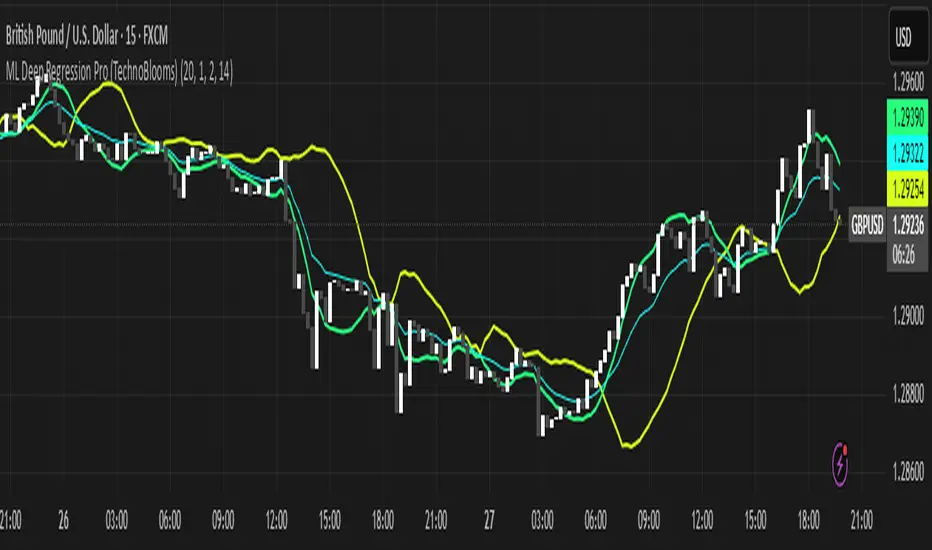
ML Deep Regression Pro (TechnoBlooms)ML Deep Regression Pro is a machine-learning-inspired trading indicator that integrates Polynomial Regression, Linear Regression and Statistical Deviation models to provide a powerful, data-driven approach to market trend analysis.
Designed for traders, quantitative analysts and developers, this tool transforms raw market data into predictive trend insights, allowing for better decision-making and trend validation.
By leveraging statistical regression techniques, ML Deep Regression Pro eliminates market noise and identifies key trend shifts, making it a valuable addition to both manual and algorithmic trading strategies.
REGRESSION ANALYSIS
Regression is a statistical modeling technique used in machine learning and data science to identify patterns and relationships between variables. In trading, it helps detect price trends, reversals and volatility changes by fitting price data into a predictive model.
1. Linear Regression -
The most widely used regression model in trading, providing a best-fit plotted line to track price trends.
2. Polynomial Regression -
A more advanced form of regression that fits curved price structures, capturing complex market cycles and improving trend forecasting accuracy.
3. Standard Deviation Bands -
Based on regression calculations, these bands measure price dispersion and identify overbought/ oversold conditions, similar to Bollinger Bands. By default, these lines are hidden and user can make it visible through Settings.
KEY FEATURES :-
✅ Hybrid Regression Engine – Combines Linear and Polynomial Regression to detect market trends with greater accuracy.
✅ Dynamic Trend Bias Analysis – Identifies bullish & bearish market conditions using real-time regression models.
✅ Standard Deviation Bands – Measures price volatility and potential reversals with an advanced deviation model.
✅ Adaptive EMA Crossover Signals – Generates buy/sell signals when price momentum shifts relative to the regression trend.
Fundamental Fair Value RangeFundamental Fair Value Range
This indicator calculates and visualizes a company's intrinsic fair value based on several fundamental valuation metrics, including Price-to-Earnings (P/E), Price-to-Book (P/B), Price-to-Sales (P/S), Price-to-Free Cash Flow (P/FCF), Price-to-Tangible Book Value (P/TBV), Enterprise Value-to-EBITDA (EV/EBITDA), and Price-to-Cash Flow (P/CF). It dynamically computes median historical ratios to establish a robust fair value range, enhanced by forward-looking estimates and adjusted for financial risk and dividend yield.
Features :
Dynamic Valuation Metrics : Combines historical and forward-looking financial data to calculate realistic fair value estimates.
Flexible Weighting System : Assign customized weights to valuation metrics depending on profitability conditions (positive or negative EPS).
Risk & Dividend Adjustments : Includes risk assessment via Debt-to-Equity and Altman Z-Score, and adjusts valuations for dividends up to a specified cap.
Confidence Range Visualization : Displays fair value with clearly marked upper and lower confidence bounds to simplify interpretation.
Customizable Display : Table position, text size, and theme (dark or light mode) can be adjusted for optimal readability and integration into your chart layout.
Strengths:
Incorporates multiple robust valuation metrics for a comprehensive analysis.
Adapts dynamically to changing financial conditions.
Provides clear actionable signals for investors.
Weaknesses:
Relies heavily on historical data, which may not fully capture future market disruptions.
Sensitivity to user-defined parameters may impact reliability; careful selection is required.
To use this indicator, simply apply it to your chart and customize parameters according to your analysis preferences. Monitor signals closely to identify stocks trading below or above intrinsic value, guiding investment decisions with greater confidence.
This indicator is freely available and open-source on TradingView for everyone to use. Enjoy!

Beep BoopThe Beep Boop indicator is designed to simplify visual trading decisions by combining the concepts of MACD (Moving Average Convergence Divergence) and a customizable EMA trend filter. It provides clear visual cues to help traders quickly assess market momentum and the current trend direction.
### What Makes Beep Boop Unique?
This indicator uniquely modifies the standard MACD histogram to create a simplified binary visualization—highlighting either bullish or bearish momentum clearly. Rather than displaying traditional MACD bars of varying sizes, it assigns fixed positive or negative values to simplify interpretation:
- A positive histogram (fixed at 0.1) indicates bullish momentum.
- A negative histogram (fixed at 0.09) indicates bearish momentum.
Additionally, Beep Boop integrates a configurable EMA (Exponential Moving Average) to filter signals, allowing traders to identify stronger directional moves by comparing the current price action with the EMA trend line:
- Bullish bars (green) appear only when price action is above the EMA.
- Bearish bars (red) appear only when price action is below the EMA.
- Neutral bars (white) appear when price action is uncertain or mixed in relation to the EMA.
### How to Use Beep Boop?
1. Fast and Slow Lengths: Adjust these to configure the MACD calculation for different timeframes or market volatility.
2. EMA Trend: Change this parameter to fine-tune the sensitivity of the EMA filter based on your preferred trading style (short-term, swing, or long-term).
3. Simple or Exponential MA: Toggle between SMA (Simple Moving Average) or EMA calculations to personalize the responsiveness of the MACD and signal lines.
### Recommended Applications
- Trend-following strategies: Clearly identifies market direction for entries and exits.
- Momentum Trading: Provides simple momentum confirmation for scalping and short-term trading.
- Market Screening: Quickly filters assets based on bullish or bearish momentum strength.
This indicator offers traders a clean, straightforward method to gauge market conditions at a glance, simplifying the complexity inherent in traditional momentum and trend indicators.
Happy Trading!
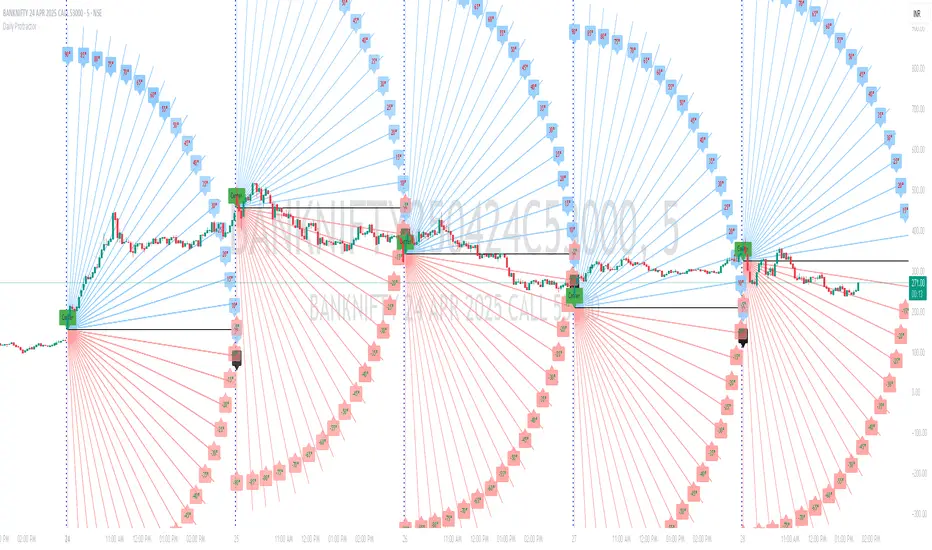
Daily ProtractorDaily Protractor Indicator
Overview
The Daily Protractor is a visually intuitive tool designed for traders who want to analyze price action through angular measurements on a 5-minute chart. By overlaying a protractor on the chart, this indicator helps identify potential support, resistance, and trend directions based on angular relationships from the first 5-minute candle of each day. It’s particularly useful for intraday traders looking to incorporate geometric analysis into their strategies for spot or strike charts.
Key Features
Dynamic Protractor Overlay: Draws a protractor centered on the low of the first 5-minute candle of each day, with customizable radius in both bars (horizontal) and price units (vertical).
Angular Measurements: Displays angles in 5-degree increments, covering a full 360° circle or a 105° to -105° (91° to 269°) half-circle, depending on user preference.
Customizable Display:
Adjust the number of days to display protractors (up to 5 days).
Customize line colors for different angle ranges (0° to 180°, 180° to 360°, and 0° specifically).
Modify line thickness, label size, and label colors for better visibility.
Center Point Highlight: Marks the center of each protractor with a labeled point for easy reference.
Efficient Design:
Optimized with max_lines_count, max_labels_count, and max_bars_back to ensure smooth performance on TradingView.
How It Works
The indicator identifies the first 5-minute candle of each day and uses its low price as the center point for a protractor. It then draws lines at 5-degree intervals, radiating from the center, with each line representing an angle from 0° to 360°. Labels at the end of each line display the angle in degrees, with negative values shown for angles between 195° and 345° (e.g., 270° is displayed as -90°). The protractor’s radius can be adjusted in both time (bars) and price units, allowing traders to scale the tool to their chart’s characteristics.
Usage Instructions
Add to Chart:
Apply the indicator to a 5-minute chart of your chosen instrument (e.g., spot or strike charts).
Interpret the Protractor:
Use the angular lines to identify potential price levels or trend directions.
The 0° line (horizontal) can act as a reference for horizontal support/resistance.
Angles between 0° and 180° (upper half) and 180° and 360° (lower half) are color-coded for quick identification.
Customize Settings:
Toggle the Show 105° to -105° option to display a half-circle (91° to 269°) instead of a full 360° protractor.
Adjust the Radius in Bars and Radius in Price Units to scale the protractor to your chart.
Set the Maximum Days to Display to control how many daily protractors are shown.
Modify line thickness, colors, and label settings to suit your visual preferences.
Customization Options
Protractor Settings:
Show 105° to -105° (91° to 269°): Toggle between a full circle or a half-circle protractor.
Radius in Bars: Set the horizontal span of the protractor (default: 75 bars).
Radius in Price Units: Set the vertical span in price units (default: 1000.0).
Maximum Days to Display: Limit the number of protractors shown (default: 5 days).
Line Settings:
Line Thickness: Adjust the thickness of the protractor lines (1 or 2).
Line Color (0° to 180°): Color for the upper half (default: light blue).
Line Color (180° to 360°): Color for the lower half (default: light red).
Line Color (0°): Color for the 0° line (default: black).
Label Settings:
Label Size: Choose between small, normal, or large labels.
Label Color (0° to 180°): Color for labels in the upper half (default: red).
Label Color (180° to 360°): Color for labels in the lower half (default: green).
Notes
The indicator was designed with the help of Grok3 for use on 5-minute charts only, as it relies on the first 5-minute candle of the day to set the protractor’s center.
For best results, adjust the radius settings to match the volatility and price scale of your instrument. However, where the price is in single digits it is advised to switch off the labels or I would suggest not to use the same.
The protractor can be used alongside other technical tools to confirm trends, reversals, or key price levels.
Limitations: This cannot be used on instruments that trade for more than 75 candles with a timeframe of 5 minutes as the angles would not cover the entire trading window. I am working coming up with a script to address this limitation.
Feedback
I’d love to hear your thoughts! If you find the Daily Protractor helpful or have suggestions for improvements, please leave a comment or reach out. Happy trading!
OG Volume Power Suite📊 OG Volume Power Suite
A stripped-down, high-performance volume toolkit engineered for elite traders who want volume precision without visual clutter. This version excludes VWAP to make room for your own price anchors while preserving the powerful logic of dynamic volume aggression and real-time support zones.
🔥 What’s Inside:
✅ Dynamic POC (Point of Control): Auto-detects the most traded price level in your custom lookback range. Watch how price reacts around it — it's your magnet and battlefield.
✅ Buyer Delta Clusters: Green triangle signals when buyers overpower sellers with volume confirmation — ideal for scalps, breakouts, and momentum swings.
✅ Seller Delta Clusters: Red triangle flags strong sell pressure — perfect for catching tops, rejecting key levels, or sniper puts.
🧠 Pro Tips:
POC Rejection = 🚀 or 🛑 — price tends to either reverse or accelerate off this zone.
Use with:
EMA Stack / VWAP overlays
QQE MOD or RSI Momentum
Trend Meter or Pre-Market Gaps
Great for AMEX:SPY , NASDAQ:QQQ , Futures, or Large Cap Options
Created by OG WEALTH — precision meets flow. Just volume that speaks facts.
