Bastrop, Louisiana

Bastrop: Parish Courthouse "On the Square"

Bastrop: Chaming rural homes, Mer Rouge

Bastrop: Old school to apartment "GREAT"

Bastrop: ARTIST JIM YATES/BASTROP LA. / BEAUTIFICATION

Bastrop: 350 west madison ave. one block from main street

Bastrop: DowntownBastropMhseParishCourthouse

Bastrop: My city ditch after 2 years of begging city to fix it. Payed taxes here for 14 years. I've even met with the current Mayor. No satisfaction. Promises but never any action

Bastrop: From old school to apartment

Bastrop: DowntownBastropLAEast Madison-May2008

Bastrop: SIROD Building, 126 S. Washington St., Bastrop, LA

Bastrop: SIROD Building, 126 S. Washington St., Bastrop, LA
- see
15
more - add
your
Submit your own pictures of this city and show them to the world
- OSM Map
- General Map
- Google Map
- MSN Map

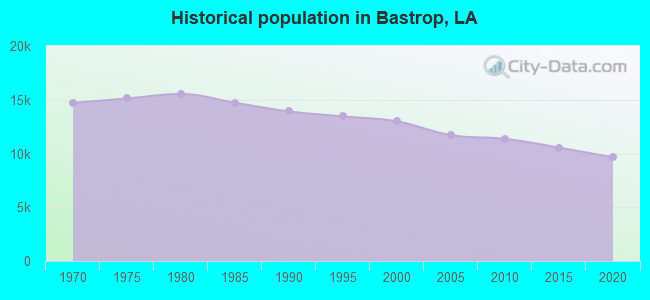
Population change since 2000: -29.4%
| Males: 4,560 | |
| Females: 4,609 |
| Median resident age: | 33.5 years |
| Louisiana median age: | 38.7 years |
Zip codes: 71220.
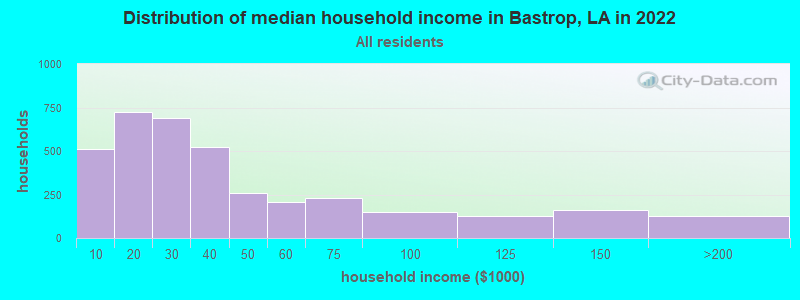
| Bastrop: | $29,170 |
| LA: | $58,229 |
Estimated per capita income in 2023: $16,730 (it was $10,769 in 2000)
Bastrop city income, earnings, and wages data
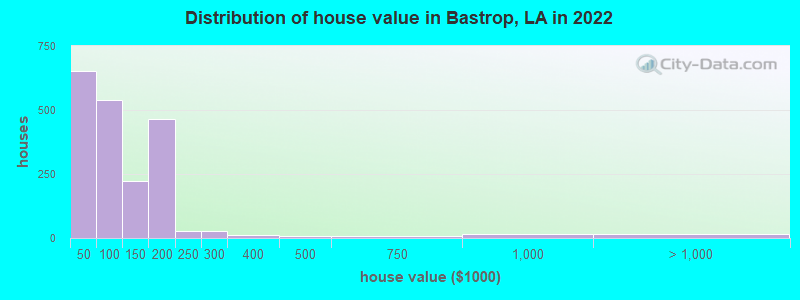
Estimated median house or condo value in 2023: $88,223 (it was $38,000 in 2000)
| Bastrop: | $88,223 |
| LA: | $215,600 |
Mean prices in 2023: all housing units: $164,485; detached houses: $165,775; townhouses or other attached units: $346,218; mobile homes: $48,468
Median gross rent in 2023: $813.
(35.7% for White Non-Hispanic residents, 45.2% for Black residents, 12.9% for Hispanic or Latino residents, 100.0% for other race residents, 6.2% for two or more races residents)
Detailed information about poverty and poor residents in Bastrop, LA


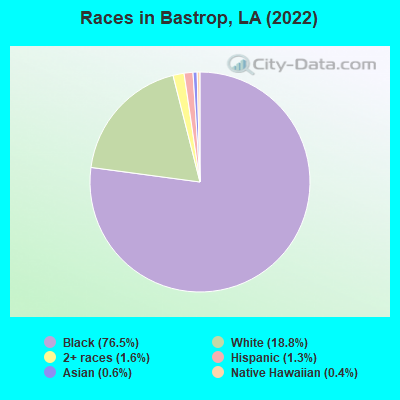
- 7,20677.4%Black alone
- 1,57516.9%White alone
- 2012.2%Two or more races
- 1411.5%Hispanic
- 700.8%Native Hawaiian and Other
Pacific Islander alone
Races in Bastrop detailed stats: ancestries, foreign born residents, place of birth
According to our research of Louisiana and other state lists, there were 63 registered sex offenders living in Bastrop, Louisiana as of May 04, 2025.
The ratio of all residents to sex offenders in Bastrop is 174 to 1.
Type |
2010 |
2011 |
2012 |
2013 |
2014 |
2015 |
2016 |
2017 |
2018 |
2019 |
2020 |
2021 |
2022 |
2023 |
|---|---|---|---|---|---|---|---|---|---|---|---|---|---|---|
| Murders (per 100,000) | 0 (0.0) | 1 (8.7) | 0 (0.0) | 2 (18.0) | 2 (18.4) | 1 (9.3) | 2 (18.9) | 1 (9.6) | 3 (29.2) | 0 (0.0) | 0 (0.0) | 8 (83.8) | 1 (10.8) | 2 (22.3) |
| Rapes (per 100,000) | 3 (26.4) | 2 (17.4) | 3 (26.6) | 5 (45.1) | 7 (64.5) | 3 (27.8) | 3 (28.3) | 4 (38.2) | 2 (19.5) | 4 (39.4) | 0 (0.0) | 1 (10.5) | 1 (10.8) | 2 (22.3) |
| Robberies (per 100,000) | 26 (228.8) | 31 (270.3) | 33 (292.6) | 31 (279.4) | 28 (257.9) | 30 (278.5) | 29 (273.7) | 31 (296.4) | 16 (155.8) | 14 (137.8) | 0 (0.0) | 7 (73.4) | 6 (64.6) | 3 (33.5) |
| Assaults (per 100,000) | 89 (783.1) | 101 (880.6) | 134 (1,188) | 117 (1,054) | 104 (957.9) | 98 (909.7) | 119 (1,123) | 122 (1,167) | 117 (1,139) | 84 (827.1) | 0 (0.0) | 114 (1,195) | 103 (1,109) | 59 (658.6) |
| Burglaries (per 100,000) | 454 (3,995) | 436 (3,802) | 304 (2,695) | 370 (3,334) | 412 (3,795) | 463 (4,298) | 465 (4,389) | 357 (3,414) | 342 (3,330) | 302 (2,974) | 2 (20.2) | 136 (1,425) | 97 (1,044) | 106 (1,183) |
| Thefts (per 100,000) | 832 (7,321) | 842 (7,342) | 751 (6,658) | 830 (7,479) | 872 (8,032) | 721 (6,693) | 717 (6,767) | 597 (5,709) | 635 (6,183) | 499 (4,913) | 9 (91.0) | 443 (4,642) | 312 (3,358) | 261 (2,913) |
| Auto thefts (per 100,000) | 63 (554.3) | 40 (348.8) | 50 (443.3) | 65 (585.7) | 43 (396.1) | 44 (408.4) | 38 (358.7) | 32 (306.0) | 29 (282.4) | 26 (256.0) | 1 (10.1) | 32 (335.3) | 17 (183.0) | 14 (156.3) |
| Arson (per 100,000) | 5 (44.0) | 8 (69.8) | 6 (53.2) | 8 (72.1) | 3 (27.6) | 6 (55.7) | 3 (28.3) | 6 (57.4) | 0 (0.0) | 1 (9.8) | 0 (0.0) | 8 (83.8) | 2 (21.5) | 1 (11.2) |
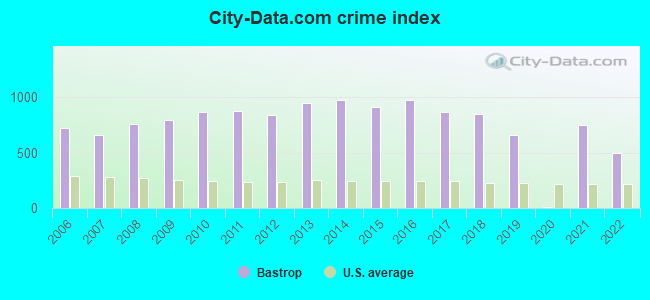
| City-Data.com crime index | 863.2 | 876.3 | 837.1 | 946.2 | 976.0 | 907.5 | 973.8 | 863.7 | 851.6 | 663.5 | 5.9 | 749.2 | 493.3 | 416.1 |
The City-Data.com crime index weighs serious crimes and violent crimes more heavily. Higher means more crime, U.S. average is 240.7. It adjusts for the number of visitors and daily workers commuting into cities.
Crime rate in Bastrop detailed stats: murders, rapes, robberies, assaults, burglaries, thefts, arson
Full-time law enforcement employees in 2023, including police officers: 15 (14 officers - 7 male; 7 female).
| Officers per 1,000 residents here: | 1.56 |
| Louisiana average: | 3.21 |
 Recent articles from our blog. Our writers, many of them Ph.D. graduates or candidates, create easy-to-read articles on a wide variety of topics.

 | CenturyLink Hiring in Monroe (12 replies) |
| IBM in Monroe (12 replies) |
| Miserable in Monroe... (79 replies) |
| Bastrop, is it really that bad? (18 replies) |
| Bastrop High School Class Reunion for 1972-1976 (0 replies) |
| Louisiana worst state to be an atheist (121 replies) |
Latest news from Bastrop, LA collected exclusively by city-data.com from local newspapers, TV, and radio stations
Ancestries: American (4.6%), Italian (2.9%), Irish (1.4%).
Current Local Time: CST time zone
Incorporated in 1852
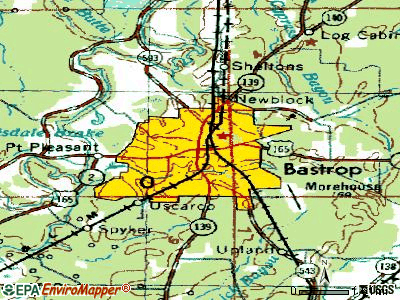
Elevation: 126 feet
Land area: 8.41 square miles.
Population density: 1,090 people per square mile (low).

18 residents are foreign born
| This city: | 0.2% |
| Louisiana: | 4.7% |
Median real estate property taxes paid for housing units with mortgages in 2023: $717 (0.5%)
Median real estate property taxes paid for housing units with no mortgage in 2023: $248 (0.4%)
Nearest city with pop. 50,000+: Monroe, LA (21.3 miles
, pop. 53,107).
Nearest city with pop. 200,000+: Shreveport, LA (110.2 miles
, pop. 200,145).
Nearest city with pop. 1,000,000+: Dallas, TX (283.3 miles
, pop. 1,188,580).
Nearest cities:
Latitude: 32.78 N, Longitude: 91.91 W
Daytime population change due to commuting: +613 (+6.6%)
Workers who live and work in this city: 1,833 (53.8%)
Area code: 318

Bastrop, Louisiana accommodation & food services, waste management - Economy and Business Data
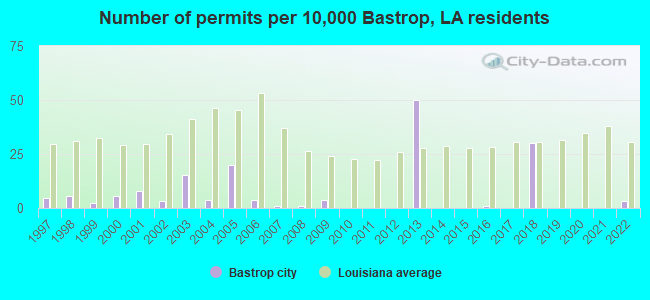
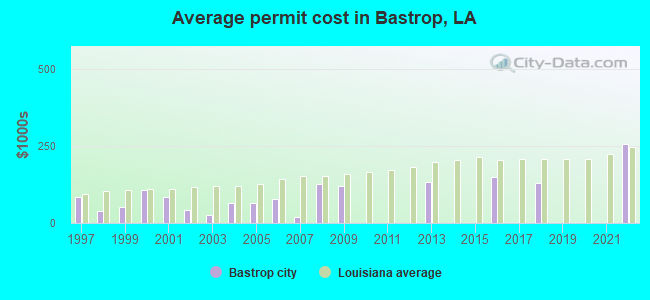
Single-family new house construction building permits:
- 2022: 4 buildings, average cost: $256,200
- 2018: 39 buildings, average cost: $130,800
- 2016: 1 building, cost: $148,600
- 2013: 65 buildings, average cost: $133,300
- 2009: 5 buildings, average cost: $119,500
- 2008: 1 building, cost: $128,000
- 2007: 1 building, cost: $20,000
- 2006: 5 buildings, average cost: $77,100
- 2005: 26 buildings, average cost: $63,800
- 2004: 5 buildings, average cost: $64,000
- 2003: 20 buildings, average cost: $25,600
- 2002: 4 buildings, average cost: $42,200
- 2001: 10 buildings, average cost: $84,500
- 2000: 7 buildings, average cost: $109,400
- 1999: 3 buildings, average cost: $52,300
- 1998: 7 buildings, average cost: $38,600
- 1997: 6 buildings, average cost: $84,100
| Here: | 6.5% |
| Louisiana: | 4.3% |

- Health care & social assistance (18.2%)
- Manufacturing (16.4%)
- Retail trade (10.9%)
- Public administration (8.9%)
- Accommodation & food services (8.8%)
- Educational services (7.1%)
- Other services, except public administration (6.7%)

- Manufacturing (25.7%)
- Retail trade (11.5%)
- Other services, except public administration (10.0%)
- Public administration (9.8%)
- Construction (8.0%)
- Transportation & warehousing (7.8%)
- Agriculture, forestry, fishing & hunting (6.6%)

- Health care & social assistance (29.4%)
- Accommodation & food services (13.5%)
- Educational services (11.8%)
- Retail trade (10.4%)
- Manufacturing (8.8%)
- Public administration (8.2%)
- Finance & insurance (5.3%)
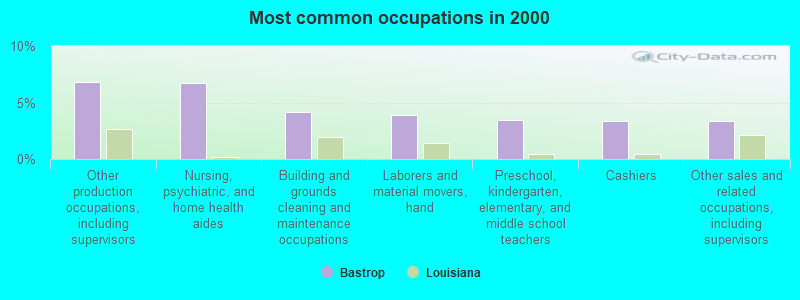
- Other production occupations, including supervisors (6.8%)
- Nursing, psychiatric, and home health aides (6.7%)
- Building and grounds cleaning and maintenance occupations (4.2%)
- Laborers and material movers, hand (3.9%)
- Preschool, kindergarten, elementary, and middle school teachers (3.5%)
- Cashiers (3.4%)
- Other sales and related occupations, including supervisors (3.4%)
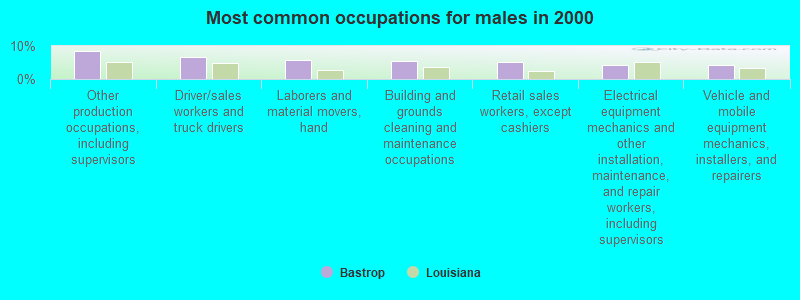
- Other production occupations, including supervisors (8.4%)
- Driver/sales workers and truck drivers (6.8%)
- Laborers and material movers, hand (5.8%)
- Building and grounds cleaning and maintenance occupations (5.5%)
- Retail sales workers, except cashiers (5.0%)
- Electrical equipment mechanics and other installation, maintenance, and repair workers, including supervisors (4.4%)
- Vehicle and mobile equipment mechanics, installers, and repairers (4.2%)
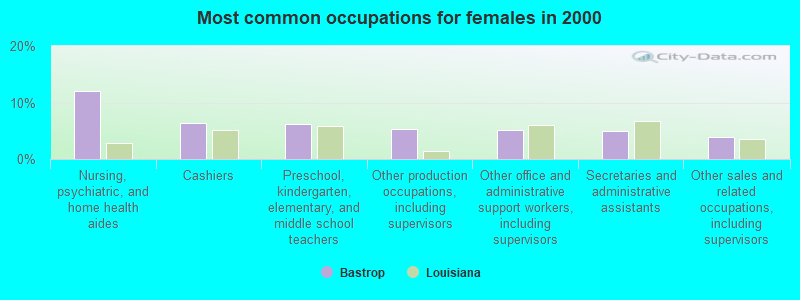
- Nursing, psychiatric, and home health aides (12.0%)
- Cashiers (6.4%)
- Preschool, kindergarten, elementary, and middle school teachers (6.2%)
- Other production occupations, including supervisors (5.4%)
- Other office and administrative support workers, including supervisors (5.2%)
- Secretaries and administrative assistants (5.0%)
- Other sales and related occupations, including supervisors (3.9%)
Average climate in Bastrop, Louisiana
Based on data reported by over 4,000 weather stations


|
|


(lower is better)
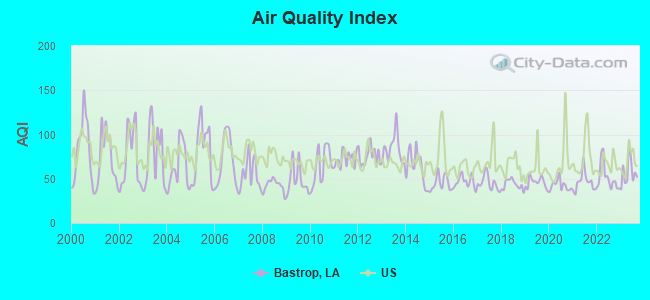
Air Quality Index (AQI) level in 2023 was 56.9. This is better than average.
| City: | 56.9 |
| U.S.: | 72.6 |
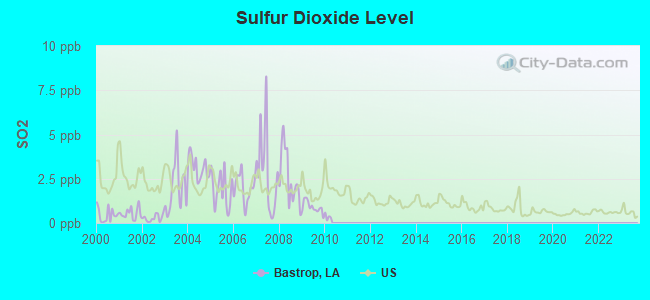
Sulfur Dioxide (SO2) [ppb] level in 2009 was 0.894. This is significantly better than average. Closest monitor was 20.0 miles away from the city center.
| City: | 0.894 |
| U.S.: | 1.515 |
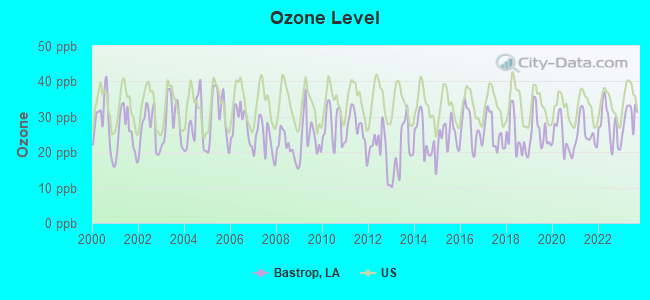
Ozone [ppb] level in 2023 was 30.1. This is about average. Closest monitor was 20.0 miles away from the city center.
| City: | 30.1 |
| U.S.: | 33.3 |
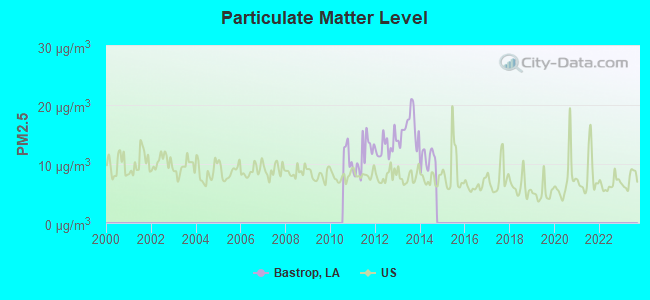
Particulate Matter (PM2.5) [µg/m3] level in 2014 was 10.9. This is worse than average. Closest monitor was 20.0 miles away from the city center.
| City: | 10.9 |
| U.S.: | 8.1 |
Tornado activity:
Bastrop-area historical tornado activity is slightly above Louisiana state average. It is 95% greater than the overall U.S. average.
On 4/1/1983, a category F4 (max. wind speeds 207-260 mph) tornado 6.0 miles away from the Bastrop city center killed 2 people and injured 20 people and caused between $500,000 and $5,000,000 in damages.
On 2/21/1971, a category F5 (max. wind speeds 261-318 mph) tornado 37.8 miles away from the city center killed 47 people and injured 510 people and caused between $5,000,000 and $50,000,000 in damages.
Earthquake activity:
Bastrop-area historical earthquake activity is significantly above Louisiana state average. It is 303% greater than the overall U.S. average.On 5/17/2012 at 08:12:00, a magnitude 4.8 (4.8 MW, Depth: 3.1 mi, Class: Light, Intensity: IV - V) earthquake occurred 155.0 miles away from the city center
On 11/6/2011 at 03:53:10, a magnitude 5.7 (5.7 MW, Depth: 3.2 mi, Class: Moderate, Intensity: VI - VII) earthquake occurred 336.6 miles away from Bastrop center
On 3/25/1976 at 00:41:20, a magnitude 5.0 (4.9 MB, 5.0 LG) earthquake occurred 217.6 miles away from the city center
On 1/21/1982 at 00:33:54, a magnitude 4.7 (4.5 MB, 4.7 LG, 4.5 LG) earthquake occurred 166.3 miles away from the city center
On 5/4/2001 at 06:42:12, a magnitude 4.7 (4.2 MB, 4.7 LG, 4.5 LG) earthquake occurred 168.6 miles away from Bastrop center
On 2/28/2011 at 05:00:50, a magnitude 4.7 (4.7 MW, Depth: 2.0 mi) earthquake occurred 174.1 miles away from the city center
Magnitude types: regional Lg-wave magnitude (LG), body-wave magnitude (MB), moment magnitude (MW)
Natural disasters:
The number of natural disasters in Morehouse Parish (30) is a lot greater than the US average (19).Major Disasters (Presidential) Declared: 11
Emergencies Declared: 4
Causes of natural disasters: Hurricanes: 10, Storms: 7, Floods: 6, Tropical Storms: 6, Freezes: 2, Tornadoes: 2, Winter Storms: 2, Drought: 1, Ice Storm: 1, Other: 3 (Note: some incidents may be assigned to more than one category).
Hospitals in Bastrop:
- BASTROP REHABILITATION HOSPITAL (323 W WALNUT ST)
- CROSSETT ROAD GROUP HOME (12460 CROSSETT RD)
- LILLIAN LOUISE BEHAVIORAL HEALTH HOSPITAL-BASTROP (provides emergency services, 4673 EUGENE WARE ROAD)
- MOREHOUSE GENERAL HOSPITAL (Government - Hospital District or Authority, 323 W WALNUT)
- PREMIER HOSPICE, LLC (1513 TEXAS AVENUE)
- VERRETT GROUP HOME (200 SOUTH ALVIN STREET)
Nursing Homes in Bastrop:
- CHERRY RIDGE (5980 CHERRY RIDGE RD)
- HICKORY MANOR NURSING HOME (370 WEST HICKORY AVENUE PO BOX 69)
- LAGNIAPPE HEALTHCARE (1408 SUMMERLIN LANE)
- LEGRAND HEALTHCARE AND REHABILITATION CENTER (2650 HOLT STREET)
Dialysis Facilities in Bastrop:
Airports located in Bastrop:
- Morehouse Memorial Airport (BQP) (Runways: 1, Itinerant Ops: 10,000, Local Ops: 20,000, Military Ops: 200)
- Travis Airport (LA63) (Runways: 1)
Colleges/universities with over 2000 students nearest to Bastrop:
- University of Louisiana at Monroe (about 20 miles; Monroe, LA; Full-time enrollment: 6,764)
- Louisiana Delta Community College (about 21 miles; Monroe, LA; FT enrollment: 3,168)
- Louisiana Tech University (about 47 miles; Ruston, LA; FT enrollment: 5,874)
- Grambling State University (about 50 miles; Grambling, LA; FT enrollment: 4,885)
- University of Arkansas at Monticello (about 57 miles; Monticello, AR; FT enrollment: 3,130)
- Alcorn State University (about 77 miles; Alcorn State, MS; FT enrollment: 3,479)
- Southern Arkansas University Main Campus (about 85 miles; Magnolia, AR; FT enrollment: 3,005)
Public high schools in Bastrop:
- BASTROP HIGH SCHOOL (Students: 1,053, Location: 402 HIGHLAND AVENUE, Grades: 8-12)
- BEEKMAN CHARTER SCHOOL (Location: 15190 AM BAKER ROAD, Grades: PK-12, Charter school)
Private high school in Bastrop:
Public elementary/middle schools in Bastrop:
- MOREHOUSE JUNIOR HIGH SCHOOL (Students: 527, Location: 1001 WEST MADISON AVENUE, Grades: 6-8)
- OAK HILL ELEMENTARY SCHOOL (Students: 384, Location: 630 COLLINSTON ROAD, Grades: 3-5)
- MOREHOUSE MAGNET SCHOOL (Students: 322, Location: 909 LARCHE LANE, Grades: PK-8)
- CHERRY RIDGE ELEMENTARY SCHOOL (Students: 315, Location: 6281 CHERRY RIDGE ROAD, Grades: PK-2)
- HENRY V. ADAMS ELEMENTARY SCHOOL (Students: 309, Location: 804 KAMMELL STREET, Grades: PK-2)
- PINE GROVE ELEMENTARY SCHOOL (Location: 7261 PINE GROVE LOOP, Grades: 3-5)
User-submitted facts and corrections:
- Saint Joseph Catholic School closed in 2005.
Points of interest:
Notable locations in Bastrop: Coulter Industrial Park (A), Morehouse Country Club (B), Bastrop Fire Department Station 1 (C), Bastrop Fire Department Station 2 (D), Bastrop Fire Department Station 3 (E), Bastrop City Hall (F), Bastrop Municipal Center (G), Bastrop Public Library (H), Morehouse Parish Courthouse (I), Snyder Memorial Museum (J), Bastrop Rehabilitation Hospital (K). Display/hide their locations on the map
Shopping Center: Washington Square Shopping Center (1). Display/hide its location on the map
Churches in Bastrop include: Central Missionary Baptist Church (A), Cherry Ridge Baptist Church (B), Christ Episcopal Church (C), Faith Baptist Church (D), First Assembly of God Church (E), First Baptist Church (F), First Church of God (G), First Presbyterian Church (H), First United Methodist Church (I). Display/hide their locations on the map
Parks in Bastrop include: A P Carter Park (1), Dotson Park (2), East Madison Park (3), Emilea Park (4), Forrest Park (5), G P Griffin Park (6), Gladney Park (7), Ralph George Park (8), Welch Street Playground (9). Display/hide their locations on the map
Tourist attraction: Snyder Memorial Museum & Creative Arts Center (1620 East Madison Avenue).
Hotels: Budget Inn (206 South Franklin Street), Saxton Arms Apartments (1053 East Madison Avenue), Bastrop Inn (1053 East Madison Avenue), Heusel Real Estate (1053 East Madison Avenue), Sara's Restaurant (1053 East Madison Avenue), Best Western North Inn (2130 East Madison Avenue), Country Inn (1815 East Madison Avenue), Preferred Inn (1053 East Madison Avenue).
Courts: Morehouse Parish - Sheriff's Ofc- Operation Center- Shop- Teen Court (351 South Franklin Street), Morehouse Parish - Clerk of Court (100 East Madison Avenue), Bastrop City - Municipal Clerk Of Court (City Hall), Morehouse Parish - 4th District Court Probation- Probation-4Th District C (125 East Madison Avenue).
Birthplace of: Bill Dickey - Baseball player and coach, Bob Love - Basketball player, Brian Jones - 2005 NFL player (Jacksonville Jaguars, born: Aug 23, 1981), John Wesley Ryles - Country singer, Mack Barham - Judge, Ronnie Coleman - Bodybuilder, Rueben Randle - Football wide receiver, W. K. Henderson - Businessman, Brian Jones (American football) - Football player, Carl Kilpatrick - Basketball player.
Drinking water stations with addresses in Bastrop and their reported violations in the past:
BASTROP WATER SYSTEM (Population served: 20,190, Groundwater):Past health violations:CONSOLIDATED WATERWORKS DISTRICT 2 (Address: 7125 PINE GROVE LOOP , Population served: 3,411, Groundwater):
- MCL, Monthly (TCR) - In DEC-2009, Contaminant: Coliform. Follow-up actions: St Public Notif requested (JAN-15-2010), St Violation/Reminder Notice (JAN-15-2010), St Public Notif received (JAN-26-2010), St Compliance achieved (FEB-16-2011)
- MCL, Monthly (TCR) - In AUG-2009, Contaminant: Coliform. Follow-up actions: St Public Notif requested (SEP-04-2009), St Violation/Reminder Notice (SEP-04-2009), St Compliance achieved (FEB-16-2011)
Past health violations:
- MCL, Monthly (TCR) - In SEP-2012, Contaminant: Coliform. Follow-up actions: St Violation/Reminder Notice (OCT-04-2012), St Public Notif requested (OCT-04-2012)
| This city: | 2.6 people |
| Louisiana: | 2.5 people |
| This city: | 67.3% |
| Whole state: | 67.1% |
| This city: | 7.5% |
| Whole state: | 6.8% |
Likely homosexual households (counted as self-reported same-sex unmarried-partner households)
- Lesbian couples: 0.2% of all households
- Gay men: 0.0% of all households
118 people in nursing facilities/skilled-nursing facilities in 2010
People in group quarters in Bastrop in 2000:
- 266 people in nursing homes
- 135 people in local jails and other confinement facilities (including police lockups)
- 7 people in homes for the mentally retarded
Banks with branches in Bastrop (2011 data):
- Iberiabank: Bastrop Motor Branch at 2126 East Madison Avenue, branch established on 2003/04/01; Bastrop Branch at 1927 East Madison Avenue, branch established on 2000/12/04. Info updated 2011/06/08: Bank assets: $11,676.7 mil, Deposits: $9,387.9 mil, headquarters in Lafayette, LA, positive income, Commercial Lending Specialization, 187 total offices, Holding Company: Iberiabank Corporation
- Community Trust Bank: Bastrop Drive Thru Facility at 635 East Madison Ave., branch established on 2008/05/12; Bastrop Banking Center at 617 East Madison Ave., branch established on 2008/05/12. Info updated 2011/10/14: Bank assets: $2,472.6 mil, Deposits: $1,908.3 mil, headquarters in Choudrant, LA, positive income, Commercial Lending Specialization, 32 total offices, Holding Company: Community Trust Financial Corporation
- Ouachita Independent Bank: Bastrop Branch at 311 North Franklin, branch established on 1950/08/21; East Madison Branch at 1503 East Madison Street, branch established on 1977/10/11. Info updated 2006/11/03: Bank assets: $567.7 mil, Deposits: $472.5 mil, headquarters in Monroe, LA, positive income, Commercial Lending Specialization, 12 total offices, Holding Company: Ouachita Bancshares Corp.
- Regions Bank: West Monroe Bastrop Branch at 1927 East Madison Avenue, branch established on 1995/01/09. Info updated 2011/02/24: Bank assets: $123,368.2 mil, Deposits: $98,301.3 mil, headquarters in Birmingham, AL, positive income, Commercial Lending Specialization, 1778 total offices, Holding Company: Regions Financial Corporation
- Woodforest National Bank: Bastrop Branch at 6091 Mer Rouge Road, branch established on 2008/10/25. Info updated 2011/05/10: Bank assets: $3,488.9 mil, Deposits: $3,097.6 mil, headquarters in Houston, TX, positive income, Commercial Lending Specialization, 766 total offices, Holding Company: Woodforest Financial Group Employee Stock Ownership Plan (With 401(K) Provisions)
- Capital One, National Association: Bastrop Branch at 101 South Franklin, branch established on 1892/01/01. Info updated 2011/07/01: Bank assets: $133,477.8 mil, Deposits: $97,063.7 mil, headquarters in Mclean, VA, positive income, 984 total offices, Holding Company: Capital One Financial Corporation
For population 15 years and over in Bastrop:
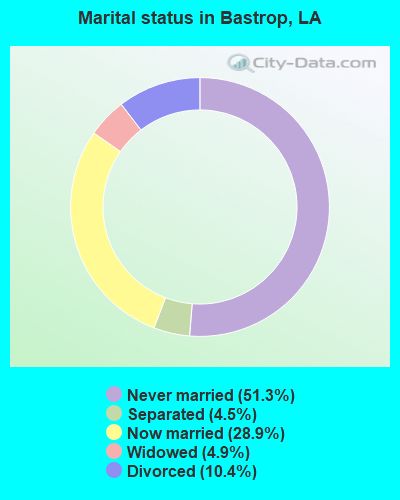
- Never married: 50.3%
- Now married: 26.4%
- Separated: 4.6%
- Widowed: 5.3%
- Divorced: 13.4%
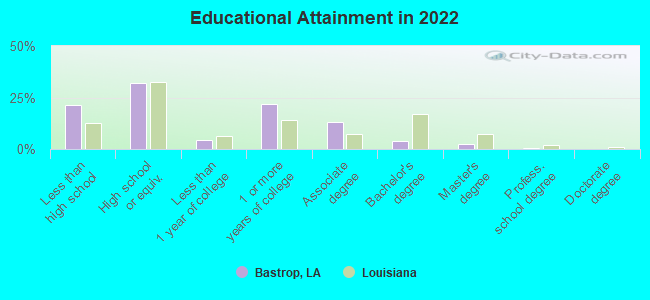
For population 25 years and over in Bastrop:
- High school or higher: 81.6%
- Bachelor's degree or higher: 5.2%
- Graduate or professional degree: 2.5%
- Unemployed: 15.1%
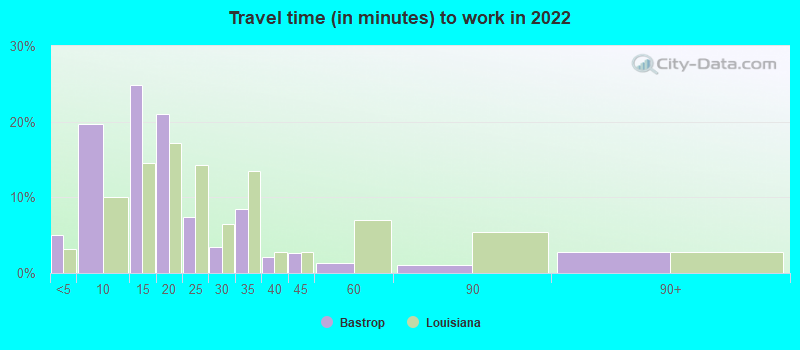
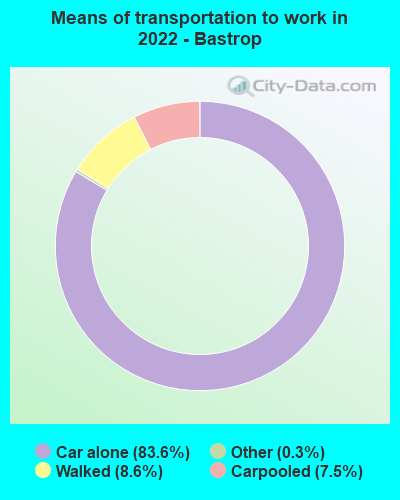
- Mean travel time to work (commute): 22.3 minutes
| Here: | 10.2 |
| Louisiana average: | 11.9 |
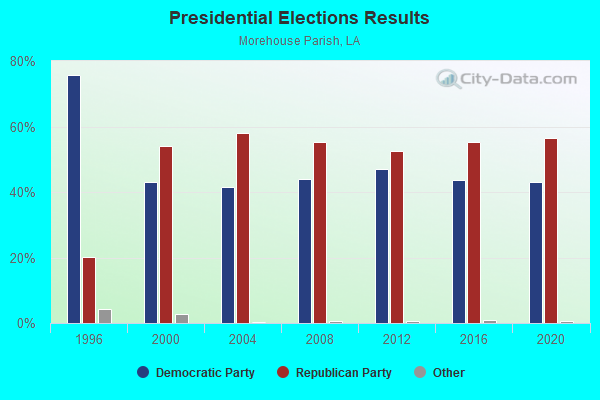
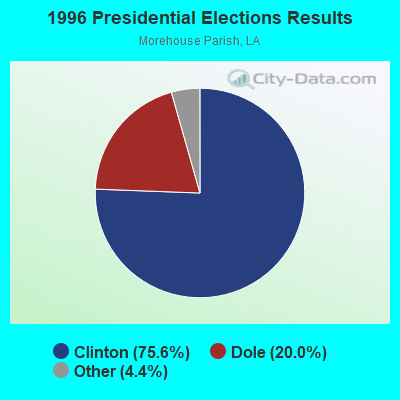
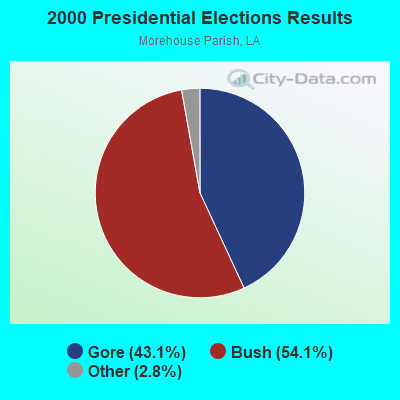
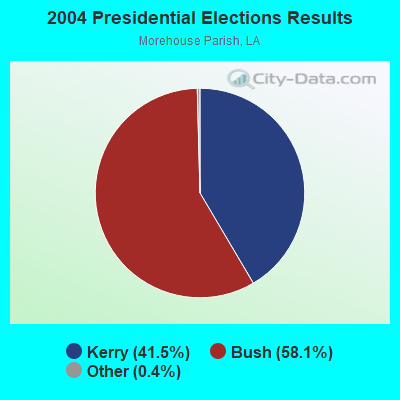
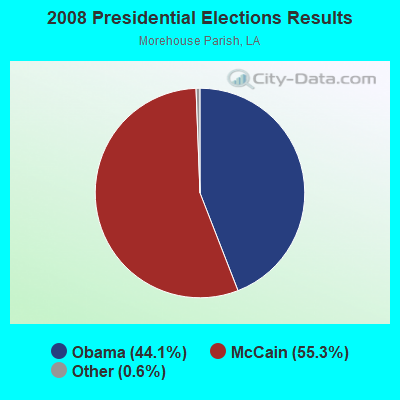
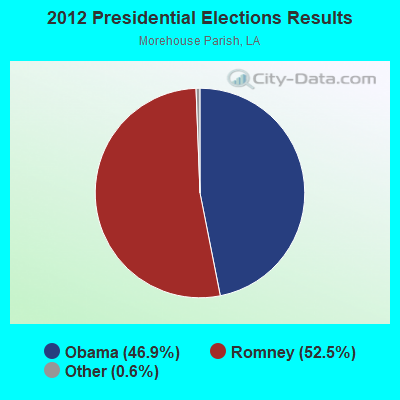


Graphs represent county-level data. Detailed 2008 Election Results
Religion statistics for Bastrop, LA (based on Morehouse Parish data)
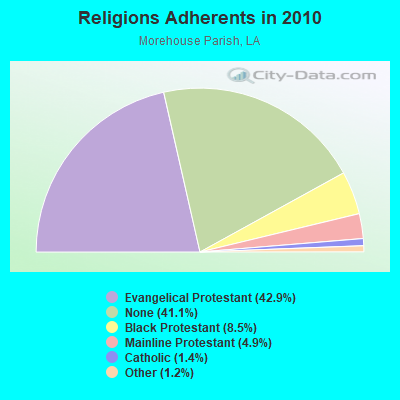
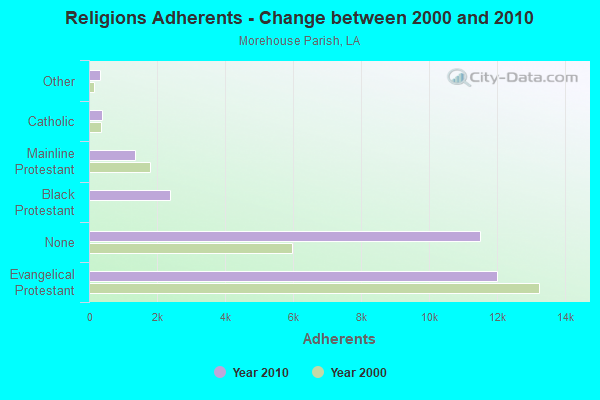
| Religion | Adherents | Congregations |
|---|---|---|
| Evangelical Protestant | 12,005 | 46 |
| Black Protestant | 2,386 | 17 |
| Mainline Protestant | 1,365 | 14 |
| Catholic | 393 | 1 |
| Other | 331 | 2 |
| None | 11,499 | - |
Food Environment Statistics:
| Morehouse Parish: | 2.09 / 10,000 pop. |
| Louisiana: | 2.56 / 10,000 pop. |
| Morehouse Parish: | 1.39 / 10,000 pop. |
| Louisiana: | 1.29 / 10,000 pop. |
| Morehouse Parish: | 5.91 / 10,000 pop. |
| State: | 4.49 / 10,000 pop. |
| Here: | 1.39 / 10,000 pop. |
| State: | 5.92 / 10,000 pop. |
| This county: | 12.5% |
| Louisiana: | 10.9% |
| Morehouse Parish: | 32.7% |
| Louisiana: | 29.2% |
| This county: | 5.5% |
| State: | 13.7% |
Health and Nutrition:
| Bastrop: | 46.6% |
| Louisiana: | 49.4% |
| Bastrop: | 42.9% |
| State: | 46.5% |
| This city: | 30.6 |
| Louisiana: | 29.1 |
| Bastrop: | 19.0% |
| Louisiana: | 20.3% |
| Bastrop: | 14.8% |
| State: | 11.4% |
| Bastrop: | 6.6 |
| Louisiana: | 6.8 |
| Here: | 36.6% |
| Louisiana: | 34.5% |
| Bastrop: | 51.4% |
| State: | 55.8% |
| This city: | 84.0% |
| Louisiana: | 80.2% |
More about Health and Nutrition of Bastrop, LA Residents
| Local government employment and payroll (March 2022) | |||||
| Function | Full-time employees | Monthly full-time payroll | Average yearly full-time wage | Part-time employees | Monthly part-time payroll |
|---|---|---|---|---|---|
| Firefighters | 37 | $112,826 | $36,592 | 0 | $0 |
| Police Protection - Officers | 18 | $63,283 | $42,189 | 0 | $0 |
| Other and Unallocable | 13 | $23,940 | $22,098 | 0 | $0 |
| Parks and Recreation | 9 | $17,499 | $23,332 | 1 | $1,732 |
| Streets and Highways | 9 | $19,261 | $25,681 | 1 | $1,301 |
| Judicial and Legal | 9 | $23,092 | $30,789 | 0 | $0 |
| Financial Administration | 7 | $17,141 | $29,385 | 1 | $1,293 |
| Other Government Administration | 4 | $17,126 | $51,378 | 5 | $4,600 |
| Health | 2 | $6,092 | $36,552 | 0 | $0 |
| Fire - Other | 1 | $1,873 | $22,476 | 0 | $0 |
| Police - Other | 0 | $0 | 9 | $2,959 | |
| Totals for Government | 109 | $302,133 | $33,262 | 17 | $11,885 |
Bastrop government finances - Expenditure in 2022 (per resident):
- Construction - Judicial and Legal Services: $15,000 ($1.64)
- Current Operations - Financial Administration: $3,772,000 ($411.39)
Local Fire Protection: $3,079,000 ($335.81)
Police Protection: $2,062,000 ($224.89)
Sewerage: $2,002,000 ($218.34)
Regular Highways: $1,324,000 ($144.40)
Parks and Recreation: $525,000 ($57.26)
General - Other: $363,000 ($39.59)
General Public Buildings: $173,000 ($18.87)
Health - Other: $130,000 ($14.18)
Air Transportation: $129,000 ($14.07)
- General - Interest on Debt: $319,000 ($34.79)
- Total Salaries and Wages: $59,000 ($6.43)
Bastrop government finances - Revenue in 2022 (per resident):
- Charges - Sewerage: $1,465,000 ($159.78)
Air Transportation: $83,000 ($9.05)
Other: $59,000 ($6.43)
Parks and Recreation: $53,000 ($5.78)
- Federal Intergovernmental - Other: $177,000 ($19.30)
- Local Intergovernmental - Other: $1,012,000 ($110.37)
- Miscellaneous - General Revenue - Other: $1,013,000 ($110.48)
Interest Earnings: $79,000 ($8.62)
Fines and Forfeits: $49,000 ($5.34)
Rents: $42,000 ($4.58)
Sale of Property: $29,000 ($3.16)
- State Intergovernmental - Other: $361,000 ($39.37)
- Tax - General Sales and Gross Receipts: $6,542,000 ($713.49)
Property: $3,373,000 ($367.87)
Occupation and Business License - Other: $524,000 ($57.15)
Public Utilities Sales: $407,000 ($44.39)
Other Selective Sales: $46,000 ($5.02)
Alcoholic Beverage Sales: $28,000 ($3.05)
Alcoholic Beverage License: $27,000 ($2.94)
Other: $4,000 ($0.44)
Bastrop government finances - Debt in 2022 (per resident):
- Long Term Debt - Beginning Outstanding - Unspecified Public Purpose: $8,197,000 ($893.99)
Outstanding Unspecified Public Purpose: $8,197,000 ($893.99)
| Businesses in Bastrop, LA | ||||
| Name | Count | Name | Count | |
|---|---|---|---|---|
| AT&T | 1 | Payless | 1 | |
| Advance Auto Parts | 1 | Pizza Hut | 1 | |
| AutoZone | 1 | Popeyes | 1 | |
| Best Western | 1 | RadioShack | 1 | |
| Burger King | 1 | Rite Aid | 1 | |
| Domino's Pizza | 1 | Rue21 | 1 | |
| FedEx | 1 | SONIC Drive-In | 1 | |
| GNC | 1 | Taco Bell | 1 | |
| Goodwill | 3 | Toyota | 1 | |
| H&R Block | 1 | U-Haul | 2 | |
| Jones New York | 1 | UPS | 1 | |
| Lane Furniture | 1 | Walgreens | 1 | |
| McDonald's | 1 | Walmart | 1 | |
| Nike | 3 | Wendy's | 1 | |
Strongest AM radio stations in Bastrop:
- KNOE (540 AM; 5 kW; MONROE, LA; Owner: NOE CORP., LLC)
- KRJO (1680 AM; 10 kW; MONROE, LA; Owner: NEW SOUTH COMMUNICATIONS, INC.)
- KMLB (1440 AM; 5 kW; MONROE, LA)
- KMBS (1310 AM; 5 kW; WEST MONROE, LA; Owner: RED BEAR BROADCASTING)
- KEEL (710 AM; 50 kW; SHREVEPORT, LA; Owner: CITICASTERS LICENSES, L.P.)
- WJNT (1180 AM; 50 kW; PEARL, MS; Owner: BUCHANAN BROADCASTING CO., INC.)
- KWKH (1130 AM; 50 kW; SHREVEPORT, LA; Owner: CITICASTERS LICENSES, L.P.)
- KGHT (880 AM; 50 kW; SHERIDAN, AR; Owner: METROPOLITAN RADIO GROUP, INC.)
- WSJC (810 AM; 50 kW; MAGEE, MS; Owner: FAMILY TALK RADIO)
- KAAY (1090 AM; 50 kW; LITTLE ROCK, AR; Owner: CITADEL BROADCASTING COMPANY)
- WCRV (640 AM; 50 kW; COLLIERVILLE, TN; Owner: BOTT BROADCASTING COMPANY/TENNESSEE)
- KLIC (1230 AM; 1 kW; MONROE, LA; Owner: MEDIA MINISTRIES, INC.)
- WCPC (940 AM; 50 kW; HOUSTON, MS; Owner: WCPC BROADCASTING CO., INC.)
Strongest FM radio stations in Bastrop:
- KJMG (97.3 FM; BASTROP, LA; Owner: HOLLADAY BROADCASTING OF LOUISIANA,)
- KTRY-FM (94.3 FM; BASTROP, LA; Owner: JAMIE PATRICK BROADCASTING, LTD.)
- KJLO-FM (104.1 FM; MONROE, LA; Owner: NEW SOUTH COMMUNICATIONS, INC.)
- KEDM (90.3 FM; MONROE, LA; Owner: UNIVERSITY OF LOUISIANA AT MONROE)
- KXRR (106.1 FM; MONROE, LA; Owner: MONROE RADIO MEMBERS, L.L.C.)
- K202DD (88.3 FM; BASTROP, LA; Owner: FAMILY WORSHIP CENTER CHURCH, INC.)
- KRVV (100.1 FM; BASTROP, LA; Owner: HOLLADAY BROADCASTING OF LOUISIANA, INC)
- KAXV (91.9 FM; BASTROP, LA; Owner: AMERICAN FAMILY ASSOCIATION)
- KXUL (91.1 FM; MONROE, LA; Owner: UNIVERSITY OF LOUISIANA AT MONROE)
- KNOE-FM (101.9 FM; MONROE, LA; Owner: NOE CORP., LLC)
- KLIP (105.3 FM; MONROE, LA; Owner: NEW SOUTH COMMUNICATIONS, INC.)
- KURC-LP (95.7 FM; BASTROP, LA; Owner: THE UPPER ROOM CHURCH MINISTRIES)
- KYFL (89.5 FM; MONROE, LA; Owner: BIBLE BROADCASTING NETWORK, INC.)
- KWJM (92.7 FM; FARMERVILLE, LA; Owner: UNION BROADCASTING CO., INC.)
- KAGH-FM (104.9 FM; CROSSETT, AR; Owner: ASHLEY COUNTY BROADCASTERS, INC.)
TV broadcast stations around Bastrop:
- KARD (Channel 14; WEST MONROE, LA; Owner: QUORUM OF LOUISIANA LICENSE, LLC)
- KTVE (Channel 10; EL DORADO, AR; Owner: PIEDMONT TELEVISION OF MONROE/EL DORADO LICENSE LLC)
- K59GI (Channel 59; MONROE, LA; Owner: TRINITY BROADCASTING NETWORK)
- KNOE-TV (Channel 8; MONROE, LA; Owner: NOE CORP., LLC)
- KAQY (Channel 11; COLUMBIA, LA; Owner: MONROE BROADCASTING, INC.)
- KLTM-TV (Channel 13; MONROE, LA; Owner: LOUISIANA EDUCATIONAL TELEVISION AUTHORITY)
- KMCT-TV (Channel 39; WEST MONROE, LA; Owner: LOUISIANA CHRISTIAN B/CASTING, INC.)
- KWMS-LP (Channel 17; WEST MONROE, LA; Owner: SONRISE COMMUNICATIONS, INC.)
- KMNO-LP (Channel 22; MONROE, LA; Owner: GREAT OAKS BROADCASTING CORPORATION)
- National Bridge Inventory (NBI) Statistics
- 17Number of bridges
- 223ft / 68.0mTotal length
- $1,490,000Total costs
- 46,053Total average daily traffic
- 3,687Total average daily truck traffic
- 50,653Total future (year 1999) average daily traffic
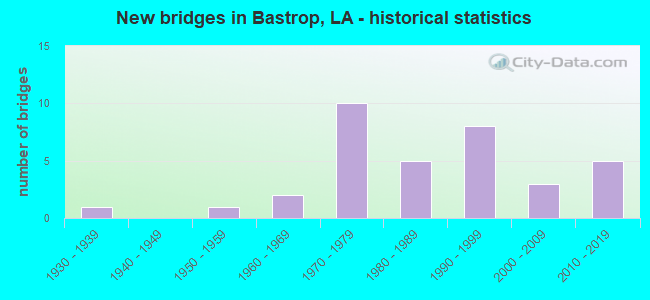
- New bridges - historical statistics
- 11950-1959
- 51970-1979
- 21980-1989
- 31990-1999
- 12000-2009
- 42010-2019
- 12020-2024
FCC Registered Antenna Towers: 154 (See the full list of FCC Registered Antenna Towers)
FCC Registered Commercial Land Mobile Towers: 3 (See the full list of FCC Registered Commercial Land Mobile Towers in Bastrop, LA)
FCC Registered Private Land Mobile Towers: 4 (See the full list of FCC Registered Private Land Mobile Towers)
FCC Registered Broadcast Land Mobile Towers: 21 (See the full list of FCC Registered Broadcast Land Mobile Towers)
FCC Registered Microwave Towers: 25 (See the full list of FCC Registered Microwave Towers in this town)
FCC Registered Maritime Coast & Aviation Ground Towers: 5 (See the full list of FCC Registered Maritime Coast & Aviation Ground Towers)
FCC Registered Amateur Radio Licenses: 57 (See the full list of FCC Registered Amateur Radio Licenses in Bastrop)
FAA Registered Aircraft: 11 (See the full list of FAA Registered Aircraft in Bastrop)
2002 - 2018 National Fire Incident Reporting System (NFIRS) incidents
- Fire incident types reported to NFIRS in Bastrop, LA
- 85840.9%Structure Fires
- 84340.2%Outside Fires
- 29914.2%Mobile Property/Vehicle Fires
- 994.7%Other
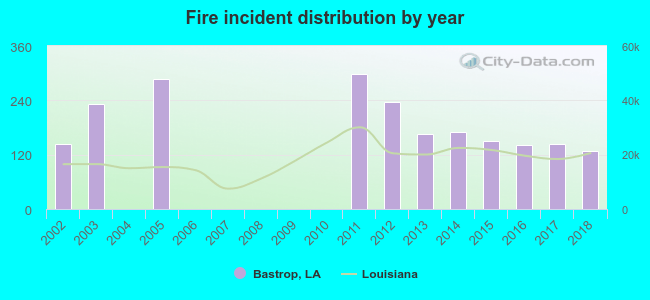 According to the data from the years 2002 - 2018 the average number of fires per year is 123. The highest number of fire incidents - 299 took place in 2011, and the least - 0 in 2004. The data has a declining trend.
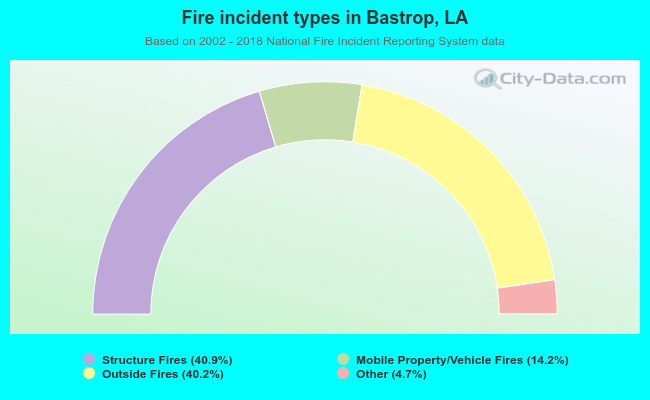 When looking into fire subcategories, the most incidents belonged to: Structure Fires (40.9%), and Outside Fires (40.2%).
| Most common first names in Bastrop, LA among deceased individuals | ||
| Name | Count | Lived (average) |
|---|---|---|
| James | 222 | 72.1 years |
| John | 201 | 73.4 years |
| Mary | 181 | 77.3 years |
| William | 178 | 74.0 years |
| Willie | 153 | 74.8 years |
| Robert | 115 | 71.0 years |
| George | 102 | 72.2 years |
| Charles | 86 | 68.5 years |
| Annie | 86 | 79.4 years |
| Henry | 77 | 74.9 years |
| Most common last names in Bastrop, LA among deceased individuals | ||
| Last name | Count | Lived (average) |
|---|---|---|
| Johnson | 168 | 74.0 years |
| Smith | 166 | 74.8 years |
| Williams | 145 | 75.0 years |
| Jones | 140 | 74.3 years |
| Brown | 102 | 73.0 years |
| Robinson | 88 | 77.2 years |
| White | 87 | 75.8 years |
| Moore | 73 | 77.7 years |
| Jackson | 67 | 78.8 years |
| Harris | 60 | 74.8 years |
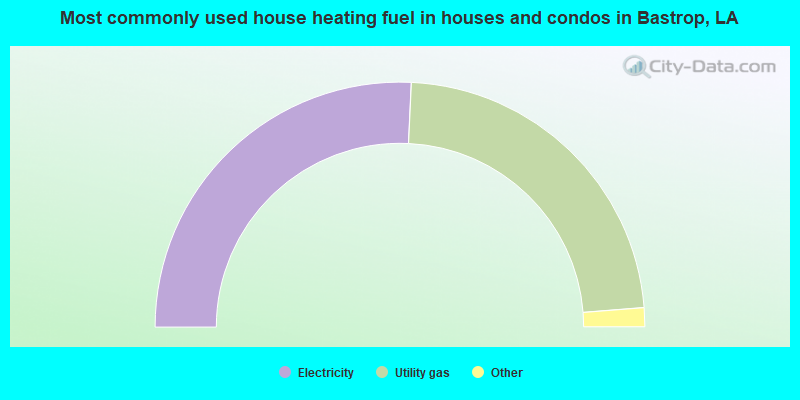
- 51.4%Electricity
- 45.3%Utility gas
- 2.3%Bottled, tank, or LP gas
- 1.0%Wood
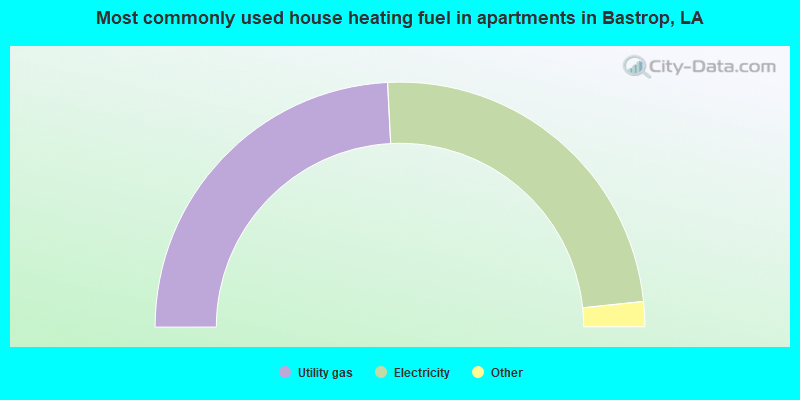
- 51.7%Electricity
- 44.7%Utility gas
- 2.0%Bottled, tank, or LP gas
- 0.9%Fuel oil, kerosene, etc.
- 0.7%No fuel used
Bastrop compared to Louisiana state average:
- Median household income below state average.
- Median house value significantly below state average.
- Black race population percentage above state average.
- Hispanic race population percentage significantly below state average.
- Median age below state average.
- Foreign-born population percentage significantly below state average.
- Length of stay since moving in significantly above state average.
- Percentage of population with a bachelor's degree or higher significantly below state average.
Bastrop on our top lists:
- #28 on the list of "Top 101 cities with the most people below the poverty level, excluding cities with 15% or more of residents in college and with the median age below 28 (population 5,000+)"
- #40 on the list of "Top 101 cities with the highest number of burglaries per 100,000 residents, excludes tourist destinations and others with a lot of outsiders visiting based on city industries data (population 5,000+)"
- #44 on the list of "Top 101 cities with the highest city-data.com crime index, excludes tourist destinations and others with a lot of outsiders visiting based on city industries data (population 5,000+)"
- #47 on the list of "Top 101 cities with the largest city-data.com crime index per police officer (population 5,000+)"
- #52 on the list of "Top 101 cities with the most people taking a taxi to work (population 5,000+)"
- #56 on the list of "Top 101 cities with the highest number of assaults per 100,000 residents, excludes tourist destinations and others with a lot of outsiders visiting based on city industries data (population 5,000+)"
- #57 on the list of "Top 101 cities with the most people below 50% of the poverty level, excluding cities with 15% or more of residents in college and with the median age below 28 (population 5,000+)"
- #62 on the list of "Top 101 cities with the highest percentage of single-parent households, population 5,000+"
- #66 on the list of "Top 101 cities with the highest number of thefts per 100,000 residents, excludes tourist destinations and others with a lot of outsiders visiting based on city industries data (population 5,000+)"
- #73 on the list of "Top 101 cities with largest percentage of males in occupations: transportation occupations (population 5,000+)"
- #76 on the list of "Top 101 cities with the largest percentage population decrease from 2000 (population 5,000+)"
- #82 on the list of "Top 100 least-safe cities (highest city-data.com crime index)"
- #83 on the list of "Top 101 cities with the highest percentage of English-only speaking households, population 5,000+"
- #92 on the list of "Top 101 cities with largest percentage of females in occupations: healthcare support occupations (population 5,000+)"
- #94 on the list of "Top 101 cities with the smallest percentage of likely homosexual households (counted as self-reported same-sex unmarried-partner households) (population 5,000+)"
- #94 on the list of "Top 101 cities with the most people born in the same U.S. state as the city (population 5,000+)"
- #95 (71220) on the list of "Top 101 zip codes with the largest percentage of English first ancestries (pop 5,000+)"

|
Total of 1 patent application in 2008-2025.