Gretna, Louisiana Submit your own pictures of this city and show them to the world
OSM Map
General Map
Google Map
MSN Map
OSM Map
General Map
Google Map
MSN Map
OSM Map
General Map
Google Map
MSN Map
OSM Map
General Map
Google Map
MSN Map
Please wait while loading the map...
Population in 2022: 17,195 (100% urban, 0% rural). Population change since 2000: -1.3%Males: 8,661 Females: 8,534
December 2024 cost of living index in Gretna: 97.1 (near average, U.S. average is 100) Percentage of residents living in poverty in 2023: 25.0%for White Non-Hispanic residents , 36.5% for Black residents , 28.2% for Hispanic or Latino residents , 77.2% for American Indian residents , 13.0% for other race residents , 37.0% for two or more races residents )
Profiles of local businesses
Business Search - 14 Million verified businesses
Data:
Median household income ($)
Median household income (% change since 2000)
Household income diversity
Ratio of average income to average house value (%)
Ratio of average income to average rent
Median household income ($) - White
Median household income ($) - Black or African American
Median household income ($) - Asian
Median household income ($) - Hispanic or Latino
Median household income ($) - American Indian and Alaska Native
Median household income ($) - Multirace
Median household income ($) - Other Race
Median household income for houses/condos with a mortgage ($)
Median household income for apartments without a mortgage ($)
Races - White alone (%)
Races - White alone (% change since 2000)
Races - Black alone (%)
Races - Black alone (% change since 2000)
Races - American Indian alone (%)
Races - American Indian alone (% change since 2000)
Races - Asian alone (%)
Races - Asian alone (% change since 2000)
Races - Hispanic (%)
Races - Hispanic (% change since 2000)
Races - Native Hawaiian and Other Pacific Islander alone (%)
Races - Native Hawaiian and Other Pacific Islander alone (% change since 2000)
Races - Two or more races (%)
Races - Two or more races (% change since 2000)
Races - Other race alone (%)
Races - Other race alone (% change since 2000)
Racial diversity
Unemployment (%)
Unemployment (% change since 2000)
Unemployment (%) - White
Unemployment (%) - Black or African American
Unemployment (%) - Asian
Unemployment (%) - Hispanic or Latino
Unemployment (%) - American Indian and Alaska Native
Unemployment (%) - Multirace
Unemployment (%) - Other Race
Population density (people per square mile)
Population - Males (%)
Population - Females (%)
Population - Males (%) - White
Population - Males (%) - Black or African American
Population - Males (%) - Asian
Population - Males (%) - Hispanic or Latino
Population - Males (%) - American Indian and Alaska Native
Population - Males (%) - Multirace
Population - Males (%) - Other Race
Population - Females (%) - White
Population - Females (%) - Black or African American
Population - Females (%) - Asian
Population - Females (%) - Hispanic or Latino
Population - Females (%) - American Indian and Alaska Native
Population - Females (%) - Multirace
Population - Females (%) - Other Race
Coronavirus confirmed cases (Apr 28, 2025)
Deaths caused by coronavirus (Apr 28, 2025)
Coronavirus confirmed cases (per 100k population) (Apr 28, 2025)
Deaths caused by coronavirus (per 100k population) (Apr 28, 2025)
Daily increase in number of cases (Apr 28, 2025)
Weekly increase in number of cases (Apr 28, 2025)
Cases doubled (in days) (Apr 28, 2025)
Hospitalized patients (Apr 18, 2022)
Negative test results (Apr 18, 2022)
Total test results (Apr 18, 2022)
COVID Vaccine doses distributed (per 100k population) (Sep 19, 2023)
COVID Vaccine doses administered (per 100k population) (Sep 19, 2023)
COVID Vaccine doses distributed (Sep 19, 2023)
COVID Vaccine doses administered (Sep 19, 2023)
Likely homosexual households (%)
Likely homosexual households (% change since 2000)
Likely homosexual households - Lesbian couples (%)
Likely homosexual households - Lesbian couples (% change since 2000)
Likely homosexual households - Gay men (%)
Likely homosexual households - Gay men (% change since 2000)
Cost of living index
Median gross rent ($)
Median contract rent ($)
Median monthly housing costs ($)
Median house or condo value ($)
Median house or condo value ($ change since 2000)
Mean house or condo value by units in structure - 1, detached ($)
Mean house or condo value by units in structure - 1, attached ($)
Mean house or condo value by units in structure - 2 ($)
Mean house or condo value by units in structure by units in structure - 3 or 4 ($)
Mean house or condo value by units in structure - 5 or more ($)
Mean house or condo value by units in structure - Boat, RV, van, etc. ($)
Mean house or condo value by units in structure - Mobile home ($)
Median house or condo value ($) - White
Median house or condo value ($) - Black or African American
Median house or condo value ($) - Asian
Median house or condo value ($) - Hispanic or Latino
Median house or condo value ($) - American Indian and Alaska Native
Median house or condo value ($) - Multirace
Median house or condo value ($) - Other Race
Median resident age
Resident age diversity
Median resident age - Males
Median resident age - Females
Median resident age - White
Median resident age - Black or African American
Median resident age - Asian
Median resident age - Hispanic or Latino
Median resident age - American Indian and Alaska Native
Median resident age - Multirace
Median resident age - Other Race
Median resident age - Males - White
Median resident age - Males - Black or African American
Median resident age - Males - Asian
Median resident age - Males - Hispanic or Latino
Median resident age - Males - American Indian and Alaska Native
Median resident age - Males - Multirace
Median resident age - Males - Other Race
Median resident age - Females - White
Median resident age - Females - Black or African American
Median resident age - Females - Asian
Median resident age - Females - Hispanic or Latino
Median resident age - Females - American Indian and Alaska Native
Median resident age - Females - Multirace
Median resident age - Females - Other Race
Commute - mean travel time to work (minutes)
Travel time to work - Less than 5 minutes (%)
Travel time to work - Less than 5 minutes (% change since 2000)
Travel time to work - 5 to 9 minutes (%)
Travel time to work - 5 to 9 minutes (% change since 2000)
Travel time to work - 10 to 19 minutes (%)
Travel time to work - 10 to 19 minutes (% change since 2000)
Travel time to work - 20 to 29 minutes (%)
Travel time to work - 20 to 29 minutes (% change since 2000)
Travel time to work - 30 to 39 minutes (%)
Travel time to work - 30 to 39 minutes (% change since 2000)
Travel time to work - 40 to 59 minutes (%)
Travel time to work - 40 to 59 minutes (% change since 2000)
Travel time to work - 60 to 89 minutes (%)
Travel time to work - 60 to 89 minutes (% change since 2000)
Travel time to work - 90 or more minutes (%)
Travel time to work - 90 or more minutes (% change since 2000)
Marital status - Never married (%)
Marital status - Now married (%)
Marital status - Separated (%)
Marital status - Widowed (%)
Marital status - Divorced (%)
Median family income ($)
Median family income (% change since 2000)
Median non-family income ($)
Median non-family income (% change since 2000)
Median per capita income ($)
Median per capita income (% change since 2000)
Median family income ($) - White
Median family income ($) - Black or African American
Median family income ($) - Asian
Median family income ($) - Hispanic or Latino
Median family income ($) - American Indian and Alaska Native
Median family income ($) - Multirace
Median family income ($) - Other Race
Median year house/condo built
Median year apartment built
Year house built - Built 2005 or later (%)
Year house built - Built 2000 to 2004 (%)
Year house built - Built 1990 to 1999 (%)
Year house built - Built 1980 to 1989 (%)
Year house built - Built 1970 to 1979 (%)
Year house built - Built 1960 to 1969 (%)
Year house built - Built 1950 to 1959 (%)
Year house built - Built 1940 to 1949 (%)
Year house built - Built 1939 or earlier (%)
Average household size
Household density (households per square mile)
Average household size - White
Average household size - Black or African American
Average household size - Asian
Average household size - Hispanic or Latino
Average household size - American Indian and Alaska Native
Average household size - Multirace
Average household size - Other Race
Occupied housing units (%)
Vacant housing units (%)
Owner occupied housing units (%)
Renter occupied housing units (%)
Vacancy status - For rent (%)
Vacancy status - For sale only (%)
Vacancy status - Rented or sold, not occupied (%)
Vacancy status - For seasonal, recreational, or occasional use (%)
Vacancy status - For migrant workers (%)
Vacancy status - Other vacant (%)
Residents with income below the poverty level (%)
Residents with income below 50% of the poverty level (%)
Children below poverty level (%)
Poor families by family type - Married-couple family (%)
Poor families by family type - Male, no wife present (%)
Poor families by family type - Female, no husband present (%)
Poverty status for native-born residents (%)
Poverty status for foreign-born residents (%)
Poverty among high school graduates not in families (%)
Poverty among people who did not graduate high school not in families (%)
Residents with income below the poverty level (%) - White
Residents with income below the poverty level (%) - Black or African American
Residents with income below the poverty level (%) - Asian
Residents with income below the poverty level (%) - Hispanic or Latino
Residents with income below the poverty level (%) - American Indian and Alaska Native
Residents with income below the poverty level (%) - Multirace
Residents with income below the poverty level (%) - Other Race
Air pollution - Air Quality Index (AQI)
Air pollution - CO
Air pollution - NO2
Air pollution - SO2
Air pollution - Ozone
Air pollution - PM10
Air pollution - PM25
Air pollution - Pb
Crime - Murders per 100,000 population
Crime - Rapes per 100,000 population
Crime - Robberies per 100,000 population
Crime - Assaults per 100,000 population
Crime - Burglaries per 100,000 population
Crime - Thefts per 100,000 population
Crime - Auto thefts per 100,000 population
Crime - Arson per 100,000 population
Crime - City-data.com crime index
Crime - Violent crime index
Crime - Property crime index
Crime - Murders per 100,000 population (5 year average)
Crime - Rapes per 100,000 population (5 year average)
Crime - Robberies per 100,000 population (5 year average)
Crime - Assaults per 100,000 population (5 year average)
Crime - Burglaries per 100,000 population (5 year average)
Crime - Thefts per 100,000 population (5 year average)
Crime - Auto thefts per 100,000 population (5 year average)
Crime - Arson per 100,000 population (5 year average)
Crime - City-data.com crime index (5 year average)
Crime - Violent crime index (5 year average)
Crime - Property crime index (5 year average)
1996 Presidential Elections Results (%) - Democratic Party (Clinton)
1996 Presidential Elections Results (%) - Republican Party (Dole)
1996 Presidential Elections Results (%) - Other
2000 Presidential Elections Results (%) - Democratic Party (Gore)
2000 Presidential Elections Results (%) - Republican Party (Bush)
2000 Presidential Elections Results (%) - Other
2004 Presidential Elections Results (%) - Democratic Party (Kerry)
2004 Presidential Elections Results (%) - Republican Party (Bush)
2004 Presidential Elections Results (%) - Other
2008 Presidential Elections Results (%) - Democratic Party (Obama)
2008 Presidential Elections Results (%) - Republican Party (McCain)
2008 Presidential Elections Results (%) - Other
2012 Presidential Elections Results (%) - Democratic Party (Obama)
2012 Presidential Elections Results (%) - Republican Party (Romney)
2012 Presidential Elections Results (%) - Other
2016 Presidential Elections Results (%) - Democratic Party (Clinton)
2016 Presidential Elections Results (%) - Republican Party (Trump)
2016 Presidential Elections Results (%) - Other
2020 Presidential Elections Results (%) - Democratic Party (Biden)
2020 Presidential Elections Results (%) - Republican Party (Trump)
2020 Presidential Elections Results (%) - Other
Ancestries Reported - Arab (%)
Ancestries Reported - Czech (%)
Ancestries Reported - Danish (%)
Ancestries Reported - Dutch (%)
Ancestries Reported - English (%)
Ancestries Reported - French (%)
Ancestries Reported - French Canadian (%)
Ancestries Reported - German (%)
Ancestries Reported - Greek (%)
Ancestries Reported - Hungarian (%)
Ancestries Reported - Irish (%)
Ancestries Reported - Italian (%)
Ancestries Reported - Lithuanian (%)
Ancestries Reported - Norwegian (%)
Ancestries Reported - Polish (%)
Ancestries Reported - Portuguese (%)
Ancestries Reported - Russian (%)
Ancestries Reported - Scotch-Irish (%)
Ancestries Reported - Scottish (%)
Ancestries Reported - Slovak (%)
Ancestries Reported - Subsaharan African (%)
Ancestries Reported - Swedish (%)
Ancestries Reported - Swiss (%)
Ancestries Reported - Ukrainian (%)
Ancestries Reported - United States (%)
Ancestries Reported - Welsh (%)
Ancestries Reported - West Indian (%)
Ancestries Reported - Other (%)
Educational Attainment - No schooling completed (%)
Educational Attainment - Less than high school (%)
Educational Attainment - High school or equivalent (%)
Educational Attainment - Less than 1 year of college (%)
Educational Attainment - 1 or more years of college (%)
Educational Attainment - Associate degree (%)
Educational Attainment - Bachelor's degree (%)
Educational Attainment - Master's degree (%)
Educational Attainment - Professional school degree (%)
Educational Attainment - Doctorate degree (%)
School Enrollment - Nursery, preschool (%)
School Enrollment - Kindergarten (%)
School Enrollment - Grade 1 to 4 (%)
School Enrollment - Grade 5 to 8 (%)
School Enrollment - Grade 9 to 12 (%)
School Enrollment - College undergrad (%)
School Enrollment - Graduate or professional (%)
School Enrollment - Not enrolled in school (%)
School enrollment - Public schools (%)
School enrollment - Private schools (%)
School enrollment - Not enrolled (%)
Median number of rooms in houses and condos
Median number of rooms in apartments
Housing units lacking complete plumbing facilities (%)
Housing units lacking complete kitchen facilities (%)
Density of houses
Urban houses (%)
Rural houses (%)
Households with people 60 years and over (%)
Households with people 65 years and over (%)
Households with people 75 years and over (%)
Households with one or more nonrelatives (%)
Households with no nonrelatives (%)
Population in households (%)
Family households (%)
Nonfamily households (%)
Population in families (%)
Family households with own children (%)
Median number of bedrooms in owner occupied houses
Mean number of bedrooms in owner occupied houses
Median number of bedrooms in renter occupied houses
Mean number of bedrooms in renter occupied houses
Median number of vehichles in owner occupied houses
Mean number of vehichles in owner occupied houses
Median number of vehichles in renter occupied houses
Mean number of vehichles in renter occupied houses
Mortgage status - with mortgage (%)
Mortgage status - with second mortgage (%)
Mortgage status - with home equity loan (%)
Mortgage status - with both second mortgage and home equity loan (%)
Mortgage status - without a mortgage (%)
Average family size
Average family size - White
Average family size - Black or African American
Average family size - Asian
Average family size - Hispanic or Latino
Average family size - American Indian and Alaska Native
Average family size - Multirace
Average family size - Other Race
Geographical mobility - Same house 1 year ago (%)
Geographical mobility - Moved within same county (%)
Geographical mobility - Moved from different county within same state (%)
Geographical mobility - Moved from different state (%)
Geographical mobility - Moved from abroad (%)
Place of birth - Born in state of residence (%)
Place of birth - Born in other state (%)
Place of birth - Native, outside of US (%)
Place of birth - Foreign born (%)
Housing units in structures - 1, detached (%)
Housing units in structures - 1, attached (%)
Housing units in structures - 2 (%)
Housing units in structures - 3 or 4 (%)
Housing units in structures - 5 to 9 (%)
Housing units in structures - 10 to 19 (%)
Housing units in structures - 20 to 49 (%)
Housing units in structures - 50 or more (%)
Housing units in structures - Mobile home (%)
Housing units in structures - Boat, RV, van, etc. (%)
House/condo owner moved in on average (years ago)
Renter moved in on average (years ago)
Year householder moved into unit - Moved in 1999 to March 2000 (%)
Year householder moved into unit - Moved in 1995 to 1998 (%)
Year householder moved into unit - Moved in 1990 to 1994 (%)
Year householder moved into unit - Moved in 1980 to 1989 (%)
Year householder moved into unit - Moved in 1970 to 1979 (%)
Year householder moved into unit - Moved in 1969 or earlier (%)
Means of transportation to work - Drove car alone (%)
Means of transportation to work - Carpooled (%)
Means of transportation to work - Public transportation (%)
Means of transportation to work - Bus or trolley bus (%)
Means of transportation to work - Streetcar or trolley car (%)
Means of transportation to work - Subway or elevated (%)
Means of transportation to work - Railroad (%)
Means of transportation to work - Ferryboat (%)
Means of transportation to work - Taxicab (%)
Means of transportation to work - Motorcycle (%)
Means of transportation to work - Bicycle (%)
Means of transportation to work - Walked (%)
Means of transportation to work - Other means (%)
Working at home (%)
Industry diversity
Most Common Industries - Agriculture, forestry, fishing and hunting, and mining (%)
Most Common Industries - Agriculture, forestry, fishing and hunting (%)
Most Common Industries - Mining, quarrying, and oil and gas extraction (%)
Most Common Industries - Construction (%)
Most Common Industries - Manufacturing (%)
Most Common Industries - Wholesale trade (%)
Most Common Industries - Retail trade (%)
Most Common Industries - Transportation and warehousing, and utilities (%)
Most Common Industries - Transportation and warehousing (%)
Most Common Industries - Utilities (%)
Most Common Industries - Information (%)
Most Common Industries - Finance and insurance, and real estate and rental and leasing (%)
Most Common Industries - Finance and insurance (%)
Most Common Industries - Real estate and rental and leasing (%)
Most Common Industries - Professional, scientific, and management, and administrative and waste management services (%)
Most Common Industries - Professional, scientific, and technical services (%)
Most Common Industries - Management of companies and enterprises (%)
Most Common Industries - Administrative and support and waste management services (%)
Most Common Industries - Educational services, and health care and social assistance (%)
Most Common Industries - Educational services (%)
Most Common Industries - Health care and social assistance (%)
Most Common Industries - Arts, entertainment, and recreation, and accommodation and food services (%)
Most Common Industries - Arts, entertainment, and recreation (%)
Most Common Industries - Accommodation and food services (%)
Most Common Industries - Other services, except public administration (%)
Most Common Industries - Public administration (%)
Occupation diversity
Most Common Occupations - Management, business, science, and arts occupations (%)
Most Common Occupations - Management, business, and financial occupations (%)
Most Common Occupations - Management occupations (%)
Most Common Occupations - Business and financial operations occupations (%)
Most Common Occupations - Computer, engineering, and science occupations (%)
Most Common Occupations - Computer and mathematical occupations (%)
Most Common Occupations - Architecture and engineering occupations (%)
Most Common Occupations - Life, physical, and social science occupations (%)
Most Common Occupations - Education, legal, community service, arts, and media occupations (%)
Most Common Occupations - Community and social service occupations (%)
Most Common Occupations - Legal occupations (%)
Most Common Occupations - Education, training, and library occupations (%)
Most Common Occupations - Arts, design, entertainment, sports, and media occupations (%)
Most Common Occupations - Healthcare practitioners and technical occupations (%)
Most Common Occupations - Health diagnosing and treating practitioners and other technical occupations (%)
Most Common Occupations - Health technologists and technicians (%)
Most Common Occupations - Service occupations (%)
Most Common Occupations - Healthcare support occupations (%)
Most Common Occupations - Protective service occupations (%)
Most Common Occupations - Fire fighting and prevention, and other protective service workers including supervisors (%)
Most Common Occupations - Law enforcement workers including supervisors (%)
Most Common Occupations - Food preparation and serving related occupations (%)
Most Common Occupations - Building and grounds cleaning and maintenance occupations (%)
Most Common Occupations - Personal care and service occupations (%)
Most Common Occupations - Sales and office occupations (%)
Most Common Occupations - Sales and related occupations (%)
Most Common Occupations - Office and administrative support occupations (%)
Most Common Occupations - Natural resources, construction, and maintenance occupations (%)
Most Common Occupations - Farming, fishing, and forestry occupations (%)
Most Common Occupations - Construction and extraction occupations (%)
Most Common Occupations - Installation, maintenance, and repair occupations (%)
Most Common Occupations - Production, transportation, and material moving occupations (%)
Most Common Occupations - Production occupations (%)
Most Common Occupations - Transportation occupations (%)
Most Common Occupations - Material moving occupations (%)
People in Group quarters - Institutionalized population (%)
People in Group quarters - Correctional institutions (%)
People in Group quarters - Federal prisons and detention centers (%)
People in Group quarters - Halfway houses (%)
People in Group quarters - Local jails and other confinement facilities (including police lockups) (%)
People in Group quarters - Military disciplinary barracks (%)
People in Group quarters - State prisons (%)
People in Group quarters - Other types of correctional institutions (%)
People in Group quarters - Nursing homes (%)
People in Group quarters - Hospitals/wards, hospices, and schools for the handicapped (%)
People in Group quarters - Hospitals/wards and hospices for chronically ill (%)
People in Group quarters - Hospices or homes for chronically ill (%)
People in Group quarters - Military hospitals or wards for chronically ill (%)
People in Group quarters - Other hospitals or wards for chronically ill (%)
People in Group quarters - Hospitals or wards for drug/alcohol abuse (%)
People in Group quarters - Mental (Psychiatric) hospitals or wards (%)
People in Group quarters - Schools, hospitals, or wards for the mentally retarded (%)
People in Group quarters - Schools, hospitals, or wards for the physically handicapped (%)
People in Group quarters - Institutions for the deaf (%)
People in Group quarters - Institutions for the blind (%)
People in Group quarters - Orthopedic wards and institutions for the physically handicapped (%)
People in Group quarters - Wards in general hospitals for patients who have no usual home elsewhere (%)
People in Group quarters - Wards in military hospitals for patients who have no usual home elsewhere (%)
People in Group quarters - Juvenile institutions (%)
People in Group quarters - Long-term care (%)
People in Group quarters - Homes for abused, dependent, and neglected children (%)
People in Group quarters - Residential treatment centers for emotionally disturbed children (%)
People in Group quarters - Training schools for juvenile delinquents (%)
People in Group quarters - Short-term care, detention or diagnostic centers for delinquent children (%)
People in Group quarters - Type of juvenile institution unknown (%)
People in Group quarters - Noninstitutionalized population (%)
People in Group quarters - College dormitories (includes college quarters off campus) (%)
People in Group quarters - Military quarters (%)
People in Group quarters - On base (%)
People in Group quarters - Barracks, unaccompanied personnel housing (UPH), (Enlisted/Officer), ;and similar group living quarters for military personnel (%)
People in Group quarters - Transient quarters for temporary residents (%)
People in Group quarters - Military ships (%)
People in Group quarters - Group homes (%)
People in Group quarters - Homes or halfway houses for drug/alcohol abuse (%)
People in Group quarters - Homes for the mentally ill (%)
People in Group quarters - Homes for the mentally retarded (%)
People in Group quarters - Homes for the physically handicapped (%)
People in Group quarters - Other group homes (%)
People in Group quarters - Religious group quarters (%)
People in Group quarters - Dormitories (%)
People in Group quarters - Agriculture workers' dormitories on farms (%)
People in Group quarters - Job Corps and vocational training facilities (%)
People in Group quarters - Other workers' dormitories (%)
People in Group quarters - Crews of maritime vessels (%)
People in Group quarters - Other nonhousehold living situations (%)
People in Group quarters - Other noninstitutional group quarters (%)
Residents speaking English at home (%)
Residents speaking English at home - Born in the United States (%)
Residents speaking English at home - Native, born elsewhere (%)
Residents speaking English at home - Foreign born (%)
Residents speaking Spanish at home (%)
Residents speaking Spanish at home - Born in the United States (%)
Residents speaking Spanish at home - Native, born elsewhere (%)
Residents speaking Spanish at home - Foreign born (%)
Residents speaking other language at home (%)
Residents speaking other language at home - Born in the United States (%)
Residents speaking other language at home - Native, born elsewhere (%)
Residents speaking other language at home - Foreign born (%)
Class of Workers - Employee of private company (%)
Class of Workers - Self-employed in own incorporated business (%)
Class of Workers - Private not-for-profit wage and salary workers (%)
Class of Workers - Local government workers (%)
Class of Workers - State government workers (%)
Class of Workers - Federal government workers (%)
Class of Workers - Self-employed workers in own not incorporated business and Unpaid family workers (%)
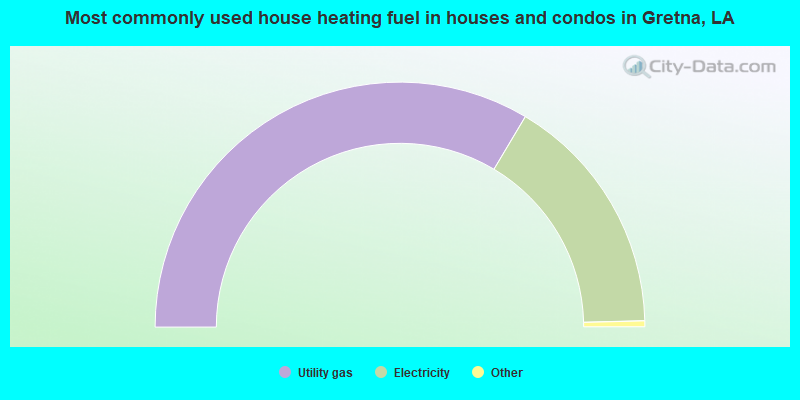
House heating fuel used in houses and condos - Utility gas (%)
House heating fuel used in houses and condos - Bottled, tank, or LP gas (%)
House heating fuel used in houses and condos - Electricity (%)
House heating fuel used in houses and condos - Fuel oil, kerosene, etc. (%)
House heating fuel used in houses and condos - Coal or coke (%)
House heating fuel used in houses and condos - Wood (%)
House heating fuel used in houses and condos - Solar energy (%)
House heating fuel used in houses and condos - Other fuel (%)
House heating fuel used in houses and condos - No fuel used (%)
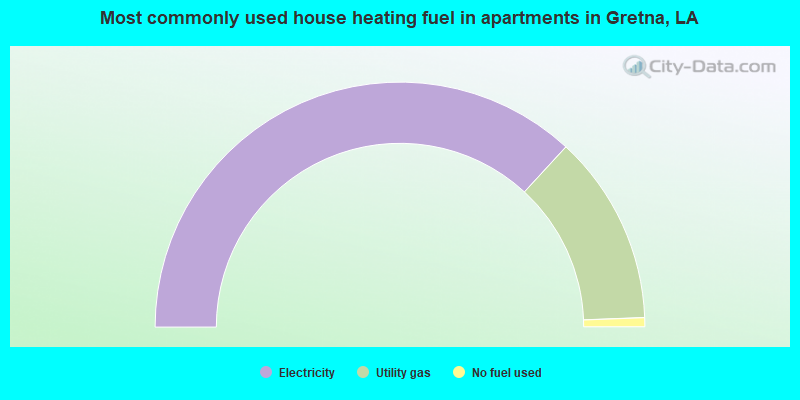
House heating fuel used in apartments - Utility gas (%)
House heating fuel used in apartments - Bottled, tank, or LP gas (%)
House heating fuel used in apartments - Electricity (%)
House heating fuel used in apartments - Fuel oil, kerosene, etc. (%)
House heating fuel used in apartments - Coal or coke (%)
House heating fuel used in apartments - Wood (%)
House heating fuel used in apartments - Solar energy (%)
House heating fuel used in apartments - Other fuel (%)
House heating fuel used in apartments - No fuel used (%)
Armed forces status - In Armed Forces (%)
Armed forces status - Civilian (%)
Armed forces status - Civilian - Veteran (%)
Armed forces status - Civilian - Nonveteran (%)
Read more: https://www.city-data.com/accidents/acc-Addison-Illinois.html
Fatal accidents locations in years 2005-2022
Fatal accidents locations in 2022
Fatal accidents locations in 2021
Fatal accidents locations in 2020
Fatal accidents locations in 2019
Fatal accidents locations in 2018
Fatal accidents locations in 2017
Fatal accidents locations in 2016
Fatal accidents locations in 2015
Fatal accidents locations in 2014
Fatal accidents locations in 2013
Fatal accidents locations in 2012
Fatal accidents locations in 2011
Fatal accidents locations in 2010
Fatal accidents locations in 2009
Fatal accidents locations in 2008
Fatal accidents locations in 2007
Fatal accidents locations in 2006
Fatal accidents locations in 2005
Alcohol use - People drinking some alcohol every month (%)
Alcohol use - People not drinking at all (%)
Alcohol use - Average days/month drinking alcohol
Alcohol use - Average drinks/week
Alcohol use - Average days/year people drink much
Audiometry - Average condition of hearing (%)
Audiometry - People that can hear a whisper from across a quiet room (%)
Audiometry - People that can hear normal voice from across a quiet room (%)
Audiometry - Ears ringing, roaring, buzzing (%)
Audiometry - Had a job exposure to loud noise (%)
Audiometry - Had off-work exposure to loud noise (%)
Blood Pressure & Cholesterol - Has high blood pressure (%)
Blood Pressure & Cholesterol - Checking blood pressure at home (%)
Blood Pressure & Cholesterol - Frequently checking blood cholesterol (%)
Blood Pressure & Cholesterol - Has high cholesterol level (%)
Consumer Behavior - Money monthly spent on food at supermarket/grocery store
Consumer Behavior - Money monthly spent on food at other stores
Consumer Behavior - Money monthly spent on eating out
Consumer Behavior - Money monthly spent on carryout/delivered foods
Consumer Behavior - Income spent on food at supermarket/grocery store (%)
Consumer Behavior - Income spent on food at other stores (%)
Consumer Behavior - Income spent on eating out (%)
Consumer Behavior - Income spent on carryout/delivered foods (%)
Current Health Status - General health condition (%)
Current Health Status - Blood donors (%)
Current Health Status - Has blood ever tested for HIV virus (%)
Current Health Status - Left-handed people (%)
Dermatology - People using sunscreen (%)
Diabetes - Diabetics (%)
Diabetes - Had a blood test for high blood sugar (%)
Diabetes - People taking insulin (%)
Diet Behavior & Nutrition - Diet health (%)
Diet Behavior & Nutrition - Milk product consumption (# of products/month)
Diet Behavior & Nutrition - Meals not home prepared (#/week)
Diet Behavior & Nutrition - Meals from fast food or pizza place (#/week)
Diet Behavior & Nutrition - Ready-to-eat foods (#/month)
Diet Behavior & Nutrition - Frozen meals/pizza (#/month)
Drug Use - People that ever used marijuana or hashish (%)
Drug Use - Ever used hard drugs (%)
Drug Use - Ever used any form of cocaine (%)
Drug Use - Ever used heroin (%)
Drug Use - Ever used methamphetamine (%)
Health Insurance - People covered by health insurance (%)
Kidney Conditions-Urology - Avg. # of times urinating at night
Medical Conditions - People with asthma (%)
Medical Conditions - People with anemia (%)
Medical Conditions - People with psoriasis (%)
Medical Conditions - People with overweight (%)
Medical Conditions - Elderly people having difficulties in thinking or remembering (%)
Medical Conditions - People who ever received blood transfusion (%)
Medical Conditions - People having trouble seeing even with glass/contacts (%)
Medical Conditions - People with arthritis (%)
Medical Conditions - People with gout (%)
Medical Conditions - People with congestive heart failure (%)
Medical Conditions - People with coronary heart disease (%)
Medical Conditions - People with angina pectoris (%)
Medical Conditions - People who ever had heart attack (%)
Medical Conditions - People who ever had stroke (%)
Medical Conditions - People with emphysema (%)
Medical Conditions - People with thyroid problem (%)
Medical Conditions - People with chronic bronchitis (%)
Medical Conditions - People with any liver condition (%)
Medical Conditions - People who ever had cancer or malignancy (%)
Mental Health - People who have little interest in doing things (%)
Mental Health - People feeling down, depressed, or hopeless (%)
Mental Health - People who have trouble sleeping or sleeping too much (%)
Mental Health - People feeling tired or having little energy (%)
Mental Health - People with poor appetite or overeating (%)
Mental Health - People feeling bad about themself (%)
Mental Health - People who have trouble concentrating on things (%)
Mental Health - People moving or speaking slowly or too fast (%)
Mental Health - People having thoughts they would be better off dead (%)
Oral Health - Average years since last visit a dentist
Oral Health - People embarrassed because of mouth (%)
Oral Health - People with gum disease (%)
Oral Health - General health of teeth and gums (%)
Oral Health - Average days a week using dental floss/device
Oral Health - Average days a week using mouthwash for dental problem
Oral Health - Average number of teeth
Pesticide Use - Households using pesticides to control insects (%)
Pesticide Use - Households using pesticides to kill weeds (%)
Physical Activity - People doing vigorous-intensity work activities (%)
Physical Activity - People doing moderate-intensity work activities (%)
Physical Activity - People walking or bicycling (%)
Physical Activity - People doing vigorous-intensity recreational activities (%)
Physical Activity - People doing moderate-intensity recreational activities (%)
Physical Activity - Average hours a day doing sedentary activities
Physical Activity - Average hours a day watching TV or videos
Physical Activity - Average hours a day using computer
Physical Functioning - People having limitations keeping them from working (%)
Physical Functioning - People limited in amount of work they can do (%)
Physical Functioning - People that need special equipment to walk (%)
Physical Functioning - People experiencing confusion/memory problems (%)
Physical Functioning - People requiring special healthcare equipment (%)
Prescription Medications - Average number of prescription medicines taking
Preventive Aspirin Use - Adults 40+ taking low-dose aspirin (%)
Reproductive Health - Vaginal deliveries (%)
Reproductive Health - Cesarean deliveries (%)
Reproductive Health - Deliveries resulted in a live birth (%)
Reproductive Health - Pregnancies resulted in a delivery (%)
Reproductive Health - Women breastfeeding newborns (%)
Reproductive Health - Women that had a hysterectomy (%)
Reproductive Health - Women that had both ovaries removed (%)
Reproductive Health - Women that have ever taken birth control pills (%)
Reproductive Health - Women taking birth control pills (%)
Reproductive Health - Women that have ever used Depo-Provera or injectables (%)
Reproductive Health - Women that have ever used female hormones (%)
Sexual Behavior - People 18+ that ever had sex (vaginal, anal, or oral) (%)
Sexual Behavior - Males 18+ that ever had vaginal sex with a woman (%)
Sexual Behavior - Males 18+ that ever performed oral sex on a woman (%)
Sexual Behavior - Males 18+ that ever had anal sex with a woman (%)
Sexual Behavior - Males 18+ that ever had any sex with a man (%)
Sexual Behavior - Females 18+ that ever had vaginal sex with a man (%)
Sexual Behavior - Females 18+ that ever performed oral sex on a man (%)
Sexual Behavior - Females 18+ that ever had anal sex with a man (%)
Sexual Behavior - Females 18+ that ever had any kind of sex with a woman (%)
Sexual Behavior - Average age people first had sex
Sexual Behavior - Average number of female sex partners in lifetime (males 18+)
Sexual Behavior - Average number of female vaginal sex partners in lifetime (males 18+)
Sexual Behavior - Average age people first performed oral sex on a woman (18+)
Sexual Behavior - Average number of woman performed oral sex on in lifetime (18+)
Sexual Behavior - Average number of male sex partners in lifetime (males 18+)
Sexual Behavior - Average number of male anal sex partners in lifetime (males 18+)
Sexual Behavior - Average age people first performed oral sex on a man (18+)
Sexual Behavior - Average number of male oral sex partners in lifetime (18+)
Sexual Behavior - People using protection when performing oral sex (%)
Sexual Behavior - Average number of times people have vaginal or anal sex a year
Sexual Behavior - People having sex without condom (%)
Sexual Behavior - Average number of male sex partners in lifetime (females 18+)
Sexual Behavior - Average number of male vaginal sex partners in lifetime (females 18+)
Sexual Behavior - Average number of female sex partners in lifetime (females 18+)
Sexual Behavior - Circumcised males 18+ (%)
Sleep Disorders - Average hours sleeping at night
Sleep Disorders - People that has trouble sleeping (%)
Smoking-Cigarette Use - People smoking cigarettes (%)
Taste & Smell - People 40+ having problems with smell (%)
Taste & Smell - People 40+ having problems with taste (%)
Taste & Smell - People 40+ that ever had wisdom teeth removed (%)
Taste & Smell - People 40+ that ever had tonsils teeth removed (%)
Taste & Smell - People 40+ that ever had a loss of consciousness because of a head injury (%)
Taste & Smell - People 40+ that ever had a broken nose or other serious injury to face or skull (%)
Taste & Smell - People 40+ that ever had two or more sinus infections (%)
Weight - Average height (inches)
Weight - Average weight (pounds)
Weight - Average BMI
Weight - People that are obese (%)
Weight - People that ever were obese (%)
Weight - People trying to lose weight (%)
Officers per 1,000 residents here:
4.79Louisiana average:
3.21
Latest news from Gretna, LA collected exclusively by city-data.com from local newspapers, TV, and radio stations
Ancestries: Italian (4.8%), American (3.7%), French (3.1%), German (3.0%), Irish (1.7%), Arab (1.4%).
Current Local Time:
Land area: 3.50 square miles.
Population density: 4,919 people per square mile (average).
3,338 residents are foreign born (15.6% Latin America , 2.1% Asia ).
This city:
19.6%Louisiana:
4.7%
Median real estate property taxes paid for housing units with mortgages in 2023: $2,119 (0.7%)Median real estate property taxes paid for housing units with no mortgage in 2023: $1,193 (0.5%)
Nearest city with pop. 50,000+: New Orleans, LA
Nearest city with pop. 1,000,000+: Houston, TX
Nearest cities:
Latitude: 29.92 N, Longitude: 90.05 W
Daytime population change due to commuting: +1,617 (+9.5%)Workers who live and work in this city: 1,787 (25.3%)
Area code commonly used in this area: 504
Gretna tourist attractions:
Single-family new house construction building permits:
2023: 11 buildings , average cost: $225,8002022: 12 buildings , average cost: $184,9002021: 32 buildings , average cost: $215,3002020: 32 buildings , average cost: $224,0002019: 16 buildings , average cost: $168,1002018: 26 buildings , average cost: $190,3002017: 13 buildings , average cost: $188,2002016: 14 buildings , average cost: $175,7002015: 21 buildings , average cost: $173,5002014: 17 buildings , average cost: $129,9002013: 14 buildings , average cost: $159,8002012: 13 buildings , average cost: $161,2002011: 11 buildings , average cost: $163,1002010: 10 buildings , average cost: $175,3002009: 14 buildings , average cost: $134,0002008: 22 buildings , average cost: $117,5002007: 17 buildings , average cost: $104,0002006: 27 buildings , average cost: $89,2002005: 47 buildings , average cost: $92,1002004: 59 buildings , average cost: $83,4002003: 30 buildings , average cost: $92,5002002: 25 buildings , average cost: $108,3002001: 24 buildings , average cost: $90,7002000: 17 buildings , average cost: $108,6001999: 19 buildings , average cost: $85,3001998: 14 buildings , average cost: $53,1001997: 6 buildings , average cost: $74,400Unemployment in November 2024:
Population change in the 1990s: +432 (+2.5%).
Most common occupations in Gretna, LA (%)
Both Males Females
Building and grounds cleaning and maintenance occupations (6.0%)
Other office and administrative support workers, including supervisors (3.7%)
Electrical equipment mechanics and other installation, maintenance, and repair workers, including supervisors (3.6%)
Retail sales workers, except cashiers (3.6%)
Other management occupations, except farmers and farm managers (3.5%)
Cashiers (3.4%)
Secretaries and administrative assistants (2.8%)
Building and grounds cleaning and maintenance occupations (7.1%)
Electrical equipment mechanics and other installation, maintenance, and repair workers, including supervisors (6.5%)
Vehicle and mobile equipment mechanics, installers, and repairers (4.7%)
Driver/sales workers and truck drivers (4.4%)
Metal workers and plastic workers (4.0%)
Other production occupations, including supervisors (3.6%)
Other management occupations, except farmers and farm managers (3.6%)
Cashiers (6.7%)
Secretaries and administrative assistants (6.2%)
Other office and administrative support workers, including supervisors (5.7%)
Retail sales workers, except cashiers (4.8%)
Building and grounds cleaning and maintenance occupations (4.7%)
Information and record clerks, except customer service representatives (4.1%)
Other management occupations, except farmers and farm managers (3.4%)
Tornado activity:
Gretna-area historical tornado activity is slightly below Louisiana state average. It is 20% greater than the overall U.S. average.
On 12/6/1983, a category F4 (max. wind speeds 207-260 mph) tornado 24.7 miles away from the Gretna city center injured 25 people and caused between $5,000,000 and $50,000,000 in damages.
On 10/3/1964, a category F4 tornado 29.0 miles away from the city center killed 22 people and injured 165 people and caused between $500,000 and $5,000,000 in damages.
Earthquake activity:
Gretna-area historical earthquake activity is significantly above Louisiana state average. It is 56% smaller than the overall U.S. average. On 9/10/2006 at 14:56:08, a magnitude 5.9 (5.9 MB, 5.5 MS, 5.8 MW, Class: Moderate, Intensity: VI - VII) earthquake occurred 328.6 miles away from Gretna center On 10/24/1997 at 08:35:17, a magnitude 4.9 (4.8 MB, 4.2 MS, 4.9 LG, Depth: 6.2 mi, Class: Light, Intensity: IV - V) earthquake occurred 185.6 miles away from the city center On 5/6/2018 at 16:47:09, a magnitude 4.6 (4.6 MB, Depth: 6.2 mi) earthquake occurred 164.2 miles away from the city center On 6/30/1994 at 01:08:24, a magnitude 4.2 (4.2 MB, Depth: 6.2 mi) earthquake occurred 138.9 miles away from Gretna center On 5/17/2012 at 08:12:00, a magnitude 4.8 (4.8 MW, Depth: 3.1 mi) earthquake occurred 291.3 miles away from Gretna center On 1/18/1999 at 07:00:53, a magnitude 4.8 (4.8 MB, 4.0 LG, Depth: 0.6 mi) earthquake occurred 292.2 miles away from Gretna center Magnitude types: regional Lg-wave magnitude (LG), body-wave magnitude (MB), surface-wave magnitude (MS), moment magnitude (MW) Natural disasters: The number of natural disasters in Jefferson Parish (48) is a lot greater than the US average (19).Major Disasters (Presidential) Declared: 23Emergencies Declared: 5Hurricanes: 22, Tropical Storms: 13, Floods: 6, Storms: 6, Winter Storms: 2, Heavy Rain: 1, Tornado: 1, Other: 5 (Note: some incidents may be assigned to more than one category). Main business address for: TORCH OFFSHORE INC OIL, GAS FIELD SERVICES, NBC ).
Hospitals in Gretna: CHER AMI OF GRETNA INC (1817 HANCOCK STREET) FOURTH STREET GROUP HOME (906 FOURTH ST) HAMILTON GROUP HOME (136 HAMILTON ROAD) JEFFERSON COMMUNITY HOME (1331 JEFFERSON STREET) NEL COURT COMMUNITY HOME (541 NEL COURT) OCHSNER MEDICAL CENTER-WESTBANK LLC (2500 BELLE CHASE HIGHWAY) SEVENTEENTH STREET GROUP HOME (404 17TH STREET) ST JUDE THE APOSTLE COMMUNITY (1430 CLAIRE AVE) ST ROSALIE COMMUNITY HOME (119 KASS STREET) Nursing Homes in Gretna: BAYSIDE HEALTHCARE CENTER (3201 WALL BLVD) BELLE VIE LIVING CENTER (535 COMMERCE STREET) HEALTH WEST REHAB HOSPITAL (SNF) (3201- B WALL BLVD) MEADOWCREST HOSPITAL DPSNF (2500 BELLE CHASSE HIGHWAY) Dialysis Facilities in Gretna: DAVITA - OAKWOOD DIALYSIS (148 HECTOR AVE) DCI-WESTBANK-GRETNA (1010 BEHRMAN HWY) Home Health Centers in Gretna: ACTS HOME HEALTH CARE, INC. (252 HECTOR AVENUE) COMPREHENSIVE NSG AND HH SERVICE,INC (1141 WHITNEY AVENUE BLDG 2) EXCELLENT HOME HEALTH CARE, LLC (1400 FRANKLIN STREET) MAXIMA HOME HEALTH CARE CORP (1799 STUMPF BLVD BLDG 7, STE 8) ST MARGARET'S HOME HEALTH AND HOSPICE (919 AMELIA STREET) TLC HOME HEALTH CARE (1581 CAROL SUE AVE , STE 215) TOTAL HOME HEALTH CARE, INC. (628 FOURTH STREET) UNITY HOME HEALTH CARE, INC (1101 WESTBANK EXPRESSWAY) WE CARE HHA INC (781 BEHRMAN HWY STE 203) Amtrak station near Gretna: 3 miles: NEW ORLEANS (1001 LOYOLA AVE.) Services: ticket office, fully wheelchair accessible, enclosed waiting area, public restrooms, public payphones, snack bar, paid short-term parking, paid long-term parking, call for car rental service, taxi stand, intercity bus service, public transit connection.
College/University in Gretna: My Le's Beauty College Full-time enrollment: 128; Location: 601 Terry Parkway Ste. A; Private, for-profit; Website: mylebeautycollegellc.com/Home.html)
Colleges/universities with over 2000 students nearest to Gretna:
Loyola University New Orleans (about 5 miles; New Orleans, LA ; Full-time enrollment: 3,912)
Tulane University of Louisiana (about 5 miles; New Orleans, LA ; FT enrollment: 11,089)
Xavier University of Louisiana (about 5 miles; New Orleans, LA ; FT enrollment: 2,492)
Delgado Community College (about 6 miles; New Orleans, LA ; FT enrollment: 12,843)
University of New Orleans (about 8 miles; New Orleans, LA ; FT enrollment: 8,201)
Nicholls State University (about 46 miles; Thibodaux, LA ; FT enrollment: 5,997)
Southeastern Louisiana University (about 49 miles; Hammond, LA ; FT enrollment: 12,713)
Public high school in Gretna:
Private high schools in Gretna: MUSLIM ACADEMY Students: 193, Location: 440 REALTY DR, Grades: 1-12)
A DIFFERENT WORLD ACADEMY Students: 23, Location: 141 BELLEMEADE BLVD, Grades: UG-12)
Public elementary/middle schools in Gretna: PAUL J. SOLIS ELEMENTARY SCHOOL Students: 695, Location: 2850 MT. LAUREL DRIVE, Grades: PK-5)GRETNA MIDDLE SCHOOL Students: 675, Location: 910 GRETNA BOULEVARD, Grades: 6-8)SHIRLEY JOHNSON/GRETNA PARK ELEMENTARY SCHOOL Students: 587, Location: 1130 GRETNA BOULEVARD, Grades: PK-5)GEORGE COX ELEMENTARY SCHOOL Students: 425, Location: 2630 BELLE CHASSE HIGHWAY, Grades: PK-5)GRETNA NO. 2 ACADEMY FOR ADVANCED STUDIES Students: 353, Location: 701 AMELIA STREET, Grades: PK-5)L. W. RUPPEL ACADEMY FOR ADVANCED STUDIES Students: 350, Location: 815 HUEY P. LONG AVENUE, Grades: 6-8)WILLIAM HART ELEMENTARY SCHOOL Students: 311, Location: 2001 HANCOCK STREET, Grades: PK-5)MCDONOGH 26/HOMEDALE ELEMENTARY SCHOOL Location: 1200 JEFFERSON STREET, Grades: PK-5)
YOUNG AUDIENCES CHARTER SCHOOL Location: 1407 VIRGIL STREET, Grades: KG-4, Charter school )
Private elementary/middle schools in Gretna: ST CLETUS ELEMENTARY SCHOOL Students: 580, Location: 3610 CLAIRE AVE, Grades: PK-8)
ARDEN CAHILL ACADEMY Students: 503, Location: 3101 WALL BLVD, Grades: PK-8)
ST ANTHONY SCHOOL Students: 235, Location: 900 FRANKLIN AVE, Grades: PK-8)
ELMWOOD PARK ACADEMY Students: 127, Location: 1517 CAROL SUE AVE, Grades: PK-8)
See full list of schools located in Gretna
Notable locations in Gretna: (A) , Gretna Ferry Landing (B) , Gretna Wastewater Treatment Facility (C) , Jackson Avenue Gretna Ferry (D) , Jefferson Memorial Arch (E) , Jefferson Parish Sheriff's Office (F) , Gretna Police Department - Taxi and Alcohol Permits (G) , Gretna Police Department - Police Reports (H) , Gretna Police Department (I) , Gretna Historical Society (J) , Gretna Gun Museum (K) , German - American Cultural Center (L) , Jefferson Parish Sheriff's Office (M) , Jefferson Parish Library Gretna Branch (N) , Jefferson Parish Second Parish Court - Criminal Records (O) , Jefferson Parish Second Parish Court - Criminal (P) , Jefferson Parish Sheriff's Office - Economic Crime Unit (Q) , Gretna Police Department - Records (R) , Gould Volunteer Fire Company (S) , Gould Fire Company Number 2 (T) . Display/hide their locations on the map
Shopping Centers: (1) , West Side Shopping Center (2) , Westside South Shopping Center (3) . Display/hide their locations on the map
Churches in Gretna include: (A) , New Hope Baptist Church (B) , Loving Faith Baptist Church (C) , Lovetouch Ministries (D) , Jesus Is Lord Evangelistic Ministries (E) , Jesus Christ Apostolic Light Church (F) , Good Hope Baptist Church (G) , First Haitian Baptist Church (H) , Household of Faith Church (I) . Display/hide their locations on the map
Cemetery: (1) . Display/hide its location on the map
Parks in Gretna include: (1) , Bellevue Park (2) , Mel Ott Park (3) , Huey P Long Park (4) . Display/hide their locations on the map
Tourist attractions:
Hotels:
Courts:
Birthplace of: Mel Ott - Baseball player, Lash LaRue - Actor, Stanley Joseph Ott - Catholic bishop, John Fourcade - Football player, Elfrid Payton - Player of and football, Keith Talamo - College football player (La Lafayette Ragin' Cajuns).
Jefferson Parish has a predicted average indoor radon screening level less than 2 pCi/L (pico curies per liter) - Low Potential Drinking water stations with addresses in Gretna and their reported violations in the past:
GRETNA WATERWORKS (Population served: 17,500, Surface water):
Past health violations:
MCL, Monthly (TCR) - In DEC-2008, Contaminant: Coliform. Follow-up actions: St Public Notif requested (JAN-05-2009), St Violation/Reminder Notice (JAN-05-2009), St Compliance achieved (MAR-23-2009), St Public Notif received (MAR-23-2009)
MCL, Monthly (TCR) - In AUG-2006, Contaminant: Coliform. Follow-up actions: St Public Notif requested (AUG-15-2006), St Violation/Reminder Notice (AUG-15-2006), St Public Notif received (SEP-28-2006), St Compliance achieved (SEP-28-2006)
Past monitoring violations:
Monitoring and Reporting (DBP) - Between JAN-2005 and MAR-2005, Contaminant: CARBON, TOTAL. Follow-up actions: St Violation/Reminder Notice (MAY-20-2005), St Public Notif requested (MAY-20-2005), St Compliance achieved (AUG-25-2005), St Public Notif received (AUG-25-2005)
Average household size: This city:
2.4 peopleLouisiana:
2.5 people
Percentage of family households: This city:
59.5%Whole state:
67.1%
Percentage of households with unmarried partners: This city:
8.7%Whole state:
6.8%
Likely homosexual households (counted as self-reported same-sex unmarried-partner households)
Lesbian couples: 0.5% of all households Gay men: 0.3% of all households
People in group quarters in Gretna in 2010:
943 people in local jails and other municipal confinement facilities
16 people in group homes intended for adults
4 people in other noninstitutional facilities
3 people in college/university student housing
People in group quarters in Gretna in 2000:
691 people in local jails and other confinement facilities (including police lockups)
27 people in homes for the mentally retarded
6 people in other group homes
5 people in homes for the physically handicapped
5 people in religious group quarters
Banks with most branches in Gretna (2011 data):
Bank of Louisiana: Drive-In Facility, Oakwood Branch, Lapalco Branch. Info updated 2006/11/03: Bank assets: $90.7 mil, Deposits: $77.9 mil, headquarters in New Orleans, LA, positive income , Commercial Lending Specialization, 7 total offices , Holding Company: Bol Bancshares, Inc.
Regions Bank: Wall Boulevard Branch at 101 Wall Boulevard, branch established on 1971/05/20; West Bank Expressway Branch at 313 West Bank Expressway, branch established on 1967/03/18. Info updated 2011/02/24: Bank assets: $123,368.2 mil, Deposits: $98,301.3 mil, headquarters in Birmingham, AL, positive income , Commercial Lending Specialization, 1778 total offices , Holding Company: Regions Financial Corporation
Fidelity Homestead Savings Bank: Gretna Branch at 1888 Belle Chase Highway, branch established on 2002/05/01. Info updated 2010/03/16: Bank assets: $919.9 mil, Deposits: $792.2 mil, headquarters in New Orleans, LA, negative income in the last year , Mortgage Lending Specialization, 18 total offices
Capital One, National Association: Gretna Branch at 2 Westside Shopping Center, branch established on 1958/01/31. Info updated 2011/07/01: Bank assets: $133,477.8 mil, Deposits: $97,063.7 mil, headquarters in Mclean, VA, positive income , 984 total offices , Holding Company: Capital One Financial Corporation
First NBC Bank: 436 Lapalco Blvd Branch at 436 Lapalco Boulevard, branch established on 1919/01/01. Info updated 2011/11/21: Bank assets: $2,218.7 mil, Deposits: $1,904.1 mil, headquarters in New Orleans, LA, positive income , Commercial Lending Specialization, 33 total offices , Holding Company: First Nbc Bank Holding Company
Whitney Bank: Gretna Branch at 2100 Belle Chase Highway, branch established on 1973/02/08. Info updated 2011/06/14: Bank assets: $14,882.3 mil, Deposits: $11,630.0 mil, headquarters in New Orleans, LA, positive income , Commercial Lending Specialization, 189 total offices , Holding Company: Hancock Holding Company
JPMorgan Chase Bank, National Association: Terrytown Branch at 2320 Belle Chase, branch established on 1905/01/01. Info updated 2011/11/10: Bank assets: $1,811,678.0 mil, Deposits: $1,190,738.0 mil, headquarters in Columbus, OH, positive income , International Specialization, 5577 total offices , Holding Company: Jpmorgan Chase & Co.
Gulf Coast Bank and Trust Company: 737 Terry Parkway Branch at 737 Terry Pkwy, branch established on 1937/03/01. Info updated 2006/11/03: Bank assets: $881.1 mil, Deposits: $740.2 mil, headquarters in New Orleans, LA, positive income , Commercial Lending Specialization, 21 total offices
Eureka Homestead: Belle Chasse Hwy,north Branch at 2112 Belle Chasse Highway, Suite 1, branch established on 1884/01/01. Info updated 2011/07/21: Bank assets: $95.6 mil, Deposits: $63.2 mil, headquarters in Metairie, LA, positive income , Mortgage Lending Specialization, 2 total offices
For population 15 years and over in Gretna:
Never married: 42.7%Now married: 34.2%Separated: 3.3%Widowed: 6.5%Divorced: 13.3% For population 25 years and over in Gretna:
High school or higher: 75.5%Bachelor's degree or higher: 26.0%Graduate or professional degree: 11.1%Unemployed: 8.7%Mean travel time to work (commute): 21.8 minutes
Education Gini index (Inequality in education) Here:
19.3Louisiana average:
11.9
Religion statistics for Gretna, LA (based on Jefferson Parish data)
Religion Adherents Congregations Catholic 148,827 43 Evangelical Protestant 57,266 160 Mainline Protestant 9,908 30 Other 9,666 23 Black Protestant 7,394 32 Orthodox 300 1 None 199,191 -
Source: Clifford Grammich, Kirk Hadaway, Richard Houseal, Dale E.Jones, Alexei Krindatch, Richie Stanley and Richard H.Taylor. 2012. 2010 U.S.Religion Census: Religious Congregations & Membership Study. Association of Statisticians of American Religious Bodies. Jones, Dale E., et al. 2002. Congregations and Membership in the United States 2000. Nashville, TN: Glenmary Research Center. Graphs represent county-level data
Food Environment Statistics: Number of grocery stores : 107Here :
2.43 / 10,000 pop.Louisiana :
2.56 / 10,000 pop.
Number of supercenters and club stores : 7Here :
0.16 / 10,000 pop.Louisiana :
0.18 / 10,000 pop.
Number of convenience stores (no gas) : 62Jefferson Parish :
1.41 / 10,000 pop.Louisiana :
1.29 / 10,000 pop.
Number of convenience stores (with gas) : 128This county :
2.91 / 10,000 pop.State :
4.49 / 10,000 pop.
Number of full-service restaurants : 334Jefferson Parish :
7.59 / 10,000 pop.State :
5.92 / 10,000 pop.
Adult diabetes rate : This county :
11.2%Louisiana :
10.9%
Adult obesity rate : This county :
28.3%State :
29.2%
Low-income preschool obesity rate : Jefferson Parish :
14.5%State :
13.7%
Health and Nutrition: Healthy diet rate : Gretna:
48.7%Louisiana:
49.4%
Average overall health of teeth and gums : This city:
44.8%Louisiana:
46.5%
Average BMI : This city:
29.1Louisiana:
29.1
People feeling badly about themselves : People not drinking alcohol at all : This city:
12.1%Louisiana:
11.4%
Average hours sleeping at night : General health condition : This city:
54.4%Louisiana:
55.8%
Average condition of hearing : More about Health and Nutrition of Gretna, LA Residents
Local government employment and payroll (March 2022)
Function
Full-time employees
Monthly full-time payroll
Average yearly full-time wage
Part-time employees
Monthly part-time payroll
Police Protection - Officers
78 $437,173 $67,257 9 $18,299 Police - Other
22 $74,750 $40,773 13 $12,562 Solid Waste Management
21 $45,783 $26,162 0 $0 Other Government Administration
19 $76,010 $48,006 2 $3,434 Other and Unallocable
17 $65,764 $46,422 2 $3,716 Water Supply
16 $72,753 $54,565 0 $0 Health
13 $55,072 $50,836 5 $2,325 Sewerage
9 $33,112 $44,149 0 $0 Streets and Highways
9 $38,418 $51,224 0 $0 Judicial and Legal
9 $32,594 $43,459 4 $4,592 Financial Administration
9 $49,193 $65,591 0 $0 Correction
9 $52,239 $69,652 0 $0 Parks and Recreation
7 $23,653 $40,548 3 $2,099 Natural Resources
1 $4,714 $56,568 0 $0
Totals for Government
239 $1,061,227 $53,283 38 $47,027
Gretna government finances - Expenditure in 2022 (per resident):
Construction - Regular Highways: $3,225,000 ($187.55)
Current Operations - Police Protection: $9,787,000 ($569.18)
Regular Highways: $3,796,000 ($220.76)Local Fire Protection: $2,802,000 ($162.95)Health - Other: $2,052,000 ($119.34)Parks and Recreation: $1,641,000 ($95.43)Central Staff Services: $1,323,000 ($76.94)Financial Administration: $690,000 ($40.13)Miscellaneous Commercial Activities - Other: $16,000 ($0.93)General - Interest on Debt: $1,713,000 ($99.62)
Gretna government finances - Revenue in 2022 (per resident):
Charges - Parking Facilities: $187,000 ($10.88)
Miscellaneous Commercial Activities: $4,000 ($0.23)Miscellaneous - Fines and Forfeits: $3,129,000 ($181.97)
General Revenue - Other: $1,177,000 ($68.45)Rents: $12,000 ($0.70)Tax - General Sales and Gross Receipts: $9,980,000 ($580.40)
Property: $9,318,000 ($541.90)Other License: $1,115,000 ($64.84)Occupation and Business License - Other: $402,000 ($23.38)Alcoholic Beverage Sales: $45,000 ($2.62)
Gretna government finances - Debt in 2022 (per resident):
Long Term Debt - Beginning Outstanding - Unspecified Public Purpose: $49,218,000 ($2862.34)
Outstanding Unspecified Public Purpose: $47,279,000 ($2749.58)Retired Unspecified Public Purpose: $1,939,000 ($112.77)
7.42% of this county's 2020 resident taxpayers moved to other counties in 2021 ($53,152 average adjusted gross income )
Here:
7.42%Louisiana average:
7.33%
0.02% of residents moved to foreign countries ($118 average AGI )Jefferson Parish:
0.02%Louisiana average:
0.02%
Top counties to which taxpayers relocated from this county between 2020 and 2021:
Businesses in Gretna, LA
Name Count Name Count
ALDO 1 Jones New York 1 AT&T 3 Journeys 1 Academy Sports + Outdoors 1 Kmart 1 Advance Auto Parts 1 La Quinta 1 Aeropostale 1 McDonald's 4 American Eagle Outfitters 1 Men's Wearhouse 1 AutoZone 1 New Balance 1 Avenue 1 New York & Co 1 Bakers 1 Nike 11 Baskin-Robbins 1 Old Navy 1 Bath & Body Works 1 Papa John's Pizza 1 Burger King 1 Payless 2 Charlotte Russe 1 Pizza Hut 2 Chick-Fil-A 1 Popeyes 2 Circle K 1 RadioShack 1 Clarion 1 Rooms To Go 1 ColorTyme 1 Sears 3 DHL 1 Sprint Nextel 1 Domino's Pizza 1 Starbucks 1 Dressbarn 1 Subway 6 FedEx 5 T-Mobile 1 Finish Line 1 T.J.Maxx 1 Firestone Complete Auto Care 1 Taco Bell 1 Foot Locker 1 The Athlete's Foot 1 Forever 21 1 Torrid 1 GNC 2 U-Haul 1 GameStop 1 UPS 6 H&R Block 1 Vans 2 Holiday Inn 1 Victoria's Secret 1 Home Depot 1 Walgreens 2 IHOP 1 Wendy's 2 JCPenney 1 Wet Seal 1
Strongest AM radio stations in Gretna:
WLNO (1060 AM; 50 kW; NEW ORLEANS, LA; Owner: COMMUNICOM CO. OF LOUISIANA, L.P.)
WSMB (1350 AM; 5 kW; NEW ORLEANS, LA; Owner: ENTERCOM NEW ORLEANS LICENSE, LLC)
WWL (870 AM; 50 kW; NEW ORLEANS, LA; Owner: ENTERCOM NEW ORLEANS LICENSE, LLC)
WYLD (940 AM; 10 kW; NEW ORLEANS, LA; Owner: CLEAR CHANNEL BROADCASTING LICENSES, INC.)
WODT (1280 AM; 5 kW; NEW ORLEANS, LA; Owner: CLEAR CHANNEL BROADCASTING LICENSES, INC.)
WTIX (690 AM; 10 kW; NEW ORLEANS, LA; Owner: WTIX, INC.)
WGSO (990 AM; 1 kW; NEW ORLEANS, LA; Owner: WGSO, L.L.C.)
KGLA (1540 AM; daytime; 1 kW; GRETNA, LA; Owner: CROCODILE BROADCASTING CORP., INC.)
KKNO (750 AM; daytime; 0 kW; GRETNA, LA; Owner: ROBERT C. BLAKES ENTERPRISES, INC.)
WSHO (800 AM; 1 kW; NEW ORLEANS, LA; Owner: SHADOWLANDS COMMUNICATIONS, L.L.C.)
WVOG (600 AM; 1 kW; NEW ORLEANS, LA; Owner: F.W. ROBERT BROADCASTING CO., INC.)
WBOK (1230 AM; 1 kW; NEW ORLEANS, LA; Owner: CHRISTIAN BROADCASTING CORPORATION)
WBYU (1450 AM; 1 kW; NEW ORLEANS, LA; Owner: ABC, INC.)
Strongest FM radio stations in Gretna:
WYLD-FM (98.5 FM; NEW ORLEANS, LA; Owner: CLEAR CHANNEL BROADCASTING LICENSES, INC.)
WLMG (101.9 FM; NEW ORLEANS, LA; Owner: ENTERCOM NEW ORLEANS LICENSE, LLC)
WEZB (97.1 FM; NEW ORLEANS, LA; Owner: ENTERCOM NEW ORLEANS LICENSE, LLC)
WTKL (95.7 FM; NEW ORLEANS, LA; Owner: ENTERCOM NEW ORLEANS LICENSE, LLC)
WWNO (89.9 FM; NEW ORLEANS, LA; Owner: LOUISIANA STATE UNIV & A & M COLLEGE)
WQUE-FM (93.3 FM; NEW ORLEANS, LA; Owner: CLEAR CHANNEL BROADCASTING LICENSES, INC.)
WWOZ (90.7 FM; NEW ORLEANS, LA; Owner: FRIENDS OF WWOZ, INC.)
WNOE-FM (101.1 FM; NEW ORLEANS, LA; Owner: CLEAR CHANNEL BROADCASTING LICENSES, INC.)
WRNO-FM (99.5 FM; NEW ORLEANS, LA; Owner: CLEAR CHANNEL BROADCASTING LICENSES, INC.)
WKZN (105.3 FM; KENNER, LA; Owner: ENTERCOM NEW ORLEANS LICENSE, LLC)
WBSN-FM (89.1 FM; NEW ORLEANS, LA; Owner: PROVIDENCE EDUCATIONAL FOUNDATION)
WRBH (88.3 FM; NEW ORLEANS, LA; Owner: RADIO FOR THE BLIND & HANDICAPPED, INC.)
KMEZ (102.9 FM; BELLE CHASSE, LA; Owner: CITADEL BROADCASTING COMPANY)
WTUL (91.5 FM; NEW ORLEANS, LA; Owner: TULANE EDUCATIONAL FUND)
KKND (106.7 FM; PORT SULPHUR, LA; Owner: CITADEL BROADCASTING COMPANY)
KSTE-FM (104.1 FM; HOUMA, LA; Owner: CLEAR CHANNEL BROADCASTING LICENSES, INC.)
WCKW-FM (92.3 FM; LAPLACE, LA; Owner: 222 CORPORATION)
KCIL (107.5 FM; HOUMA, LA; Owner: GUARANTY BROADCASTING COMPANY OF HOUMA, LLC)
WTIX-FM (94.3 FM; GALLIANO, LA; Owner: FLEUR DE LIS BROADCASTING, INC.)
KLRZ (100.3 FM; LAROSE, LA; Owner: COASTAL BROADCASTING OF LAROSE, INC.)
TV broadcast stations around Gretna:
WWL-TV (Channel 4; NEW ORLEANS, LA; Owner: WWL-TV, INC.)
WHNO (Channel 20; NEW ORLEANS, LA; Owner: LESEA BROADCASTING CORPORATION)
K66FW (Channel 14; NEW ORLEANS, LA; Owner: VENTANA TELEVISION, INC.)
K59DG (Channel 59; NEW ORLEANS, LA; Owner: TRINITY BROADCCASTING NETWORK)
WLPN-LP (Channel 61; NEW ORLEANS, LA; Owner: GLENN R. & KARIN A. PLUMMER)
KNOV-LP (Channel 57; NEW ORLEANS, LA; Owner: BEACH TV PROPERTIES, INC.)
WYES-TV (Channel 12; NEW ORLEANS, LA; Owner: GREATER NEW ORLEANS ED TV FOUNDATION)
WBXN-CA (Channel 10; NEW ORLEANS, LA; Owner: THE BOX WORLDWIDE LLC)
WVUE (Channel 8; NEW ORLEANS, LA; Owner: EMMIS TELEIVISION LICENSE CORPORATION)
WDSU (Channel 6; NEW ORLEANS, LA; Owner: NEW ORLEANS HEARST-ARGYLE TELEVISION, INC.)
WLAE-TV (Channel 32; NEW ORLEANS, LA; Owner: EDUCATIONAL BROADCASTING FOUNDATION, INC.)
WGNO (Channel 26; NEW ORLEANS, LA; Owner: TRIBUNE TELEVISION NEW ORLEANS, INC.)
WNOL-TV (Channel 38; NEW ORLEANS, LA; Owner: TRIBUNE TELEVISION NEW ORLEANS, INC.)
WPXL (Channel 49; NEW ORLEANS, LA; Owner: FLINN BROADCASTING CORPORATION)
WUPL (Channel 54; SLIDELL, LA; Owner: UPN TELEVISION STATIONS INC.)
National Bridge Inventory (NBI) Statistics 34 Number of bridges814ft / 248m Total length $25,136,000 Total costs357,188 Total average daily traffic53,122 Total average daily truck traffic
New bridges - historical statistics
4 1970-1979 14 1980-1989 4 1990-1999 7 2000-2009 2 2010-2019
See full National Bridge Inventory statistics for Gretna, LA
Home Mortgage Disclosure Act Aggregated Statistics For Year 2009(Based on 6 full and 1 partial tracts) A) FHA, FSA/RHS & VA B) Conventional C) Refinancings D) Home Improvement Loans E) Loans on Dwellings For 5+ Families F) Non-occupant Loans on G) Loans On Manufactured Number Average Value Number Average Value Number Average Value Number Average Value Number Average Value Number Average Value Number Average Value
LOANS ORIGINATED 47 $135,399 34 $130,286 150 $136,480 21 $38,616 3 $526,333 33 $92,087 0 $0 APPLICATIONS APPROVED, NOT ACCEPTED 2 $161,115 6 $121,800 20 $155,754 3 $51,227 0 $0 3 $67,010 1 $75,770 APPLICATIONS DENIED 9 $159,241 19 $105,789 80 $130,672 23 $36,802 0 $0 17 $88,734 2 $50,550 APPLICATIONS WITHDRAWN 2 $133,430 6 $124,468 33 $124,598 2 $109,500 0 $0 2 $136,500 0 $0 FILES CLOSED FOR INCOMPLETENESS 0 $0 2 $93,780 12 $120,459 2 $17,235 0 $0 2 $121,775 0 $0
Aggregated Statistics For Year 2008(Based on 6 full and 1 partial tracts) A) FHA, FSA/RHS & VA B) Conventional C) Refinancings D) Home Improvement Loans E) Loans on Dwellings For 5+ Families F) Non-occupant Loans on G) Loans On Manufactured Number Average Value Number Average Value Number Average Value Number Average Value Number Average Value Number Average Value Number Average Value
LOANS ORIGINATED 35 $132,658 76 $121,130 130 $126,135 27 $49,676 2 $696,000 47 $120,754 3 $22,327 APPLICATIONS APPROVED, NOT ACCEPTED 2 $156,960 12 $121,987 38 $126,557 6 $62,040 0 $0 7 $106,137 2 $36,000 APPLICATIONS DENIED 12 $130,408 31 $131,738 108 $121,633 46 $53,363 0 $0 16 $96,351 3 $77,413 APPLICATIONS WITHDRAWN 9 $134,352 13 $110,819 34 $119,430 10 $73,497 0 $0 6 $91,500 0 $0 FILES CLOSED FOR INCOMPLETENESS 2 $85,715 5 $144,400 9 $118,666 0 $0 1 $435,000 1 $138,890 0 $0
Aggregated Statistics For Year 2007(Based on 6 full and 1 partial tracts) A) FHA, FSA/RHS & VA B) Conventional C) Refinancings D) Home Improvement Loans E) Loans on Dwellings For 5+ Families F) Non-occupant Loans on G) Loans On Manufactured Number Average Value Number Average Value Number Average Value Number Average Value Number Average Value Number Average Value Number Average Value
LOANS ORIGINATED 20 $128,248 151 $132,363 156 $112,190 39 $50,299 5 $116,200 68 $116,433 4 $23,142 APPLICATIONS APPROVED, NOT ACCEPTED 2 $91,420 29 $101,482 41 $114,826 4 $81,250 1 $214,000 12 $103,559 9 $64,367 APPLICATIONS DENIED 3 $118,317 42 $97,035 110 $121,068 60 $70,846 0 $0 38 $89,809 5 $72,140 APPLICATIONS WITHDRAWN 2 $106,500 32 $119,473 55 $119,321 9 $71,263 0 $0 18 $115,904 0 $0 FILES CLOSED FOR INCOMPLETENESS 0 $0 10 $89,825 19 $106,450 3 $91,590 0 $0 11 $87,065 0 $0
Aggregated Statistics For Year 2006(Based on 6 full and 1 partial tracts) A) FHA, FSA/RHS & VA B) Conventional C) Refinancings D) Home Improvement Loans E) Loans on Dwellings For 5+ Families F) Non-occupant Loans on G) Loans On Manufactured Number Average Value Number Average Value Number Average Value Number Average Value Number Average Value Number Average Value Number Average Value
LOANS ORIGINATED 29 $114,270 250 $110,433 158 $110,234 40 $41,181 4 $152,750 82 $96,026 7 $43,286 APPLICATIONS APPROVED, NOT ACCEPTED 3 $64,990 40 $98,880 34 $94,058 7 $32,391 0 $0 20 $79,640 2 $34,985 APPLICATIONS DENIED 1 $90,920 53 $90,615 111 $108,726 41 $49,912 1 $259,000 25 $88,982 3 $34,327 APPLICATIONS WITHDRAWN 5 $119,140 41 $102,482 62 $114,810 4 $75,415 0 $0 14 $88,439 0 $0 FILES CLOSED FOR INCOMPLETENESS 2 $139,500 11 $146,545 26 $116,145 0 $0 0 $0 0 $0 0 $0
Aggregated Statistics For Year 2005(Based on 6 full and 1 partial tracts) A) FHA, FSA/RHS & VA B) Conventional C) Refinancings D) Home Improvement Loans E) Loans on Dwellings For 5+ Families F) Non-occupant Loans on G) Loans On Manufactured Number Average Value Number Average Value Number Average Value Number Average Value Number Average Value Number Average Value Number Average Value
LOANS ORIGINATED 24 $106,086 193 $112,975 203 $97,493 47 $51,788 4 $251,250 78 $84,695 0 $0 APPLICATIONS APPROVED, NOT ACCEPTED 5 $79,362 42 $85,440 57 $100,618 9 $50,130 1 $212,000 14 $82,378 6 $40,075 APPLICATIONS DENIED 9 $130,526 82 $90,548 198 $93,959 47 $48,890 3 $1,280,667 35 $93,986 11 $66,702 APPLICATIONS WITHDRAWN 11 $103,802 50 $110,468 79 $123,597 20 $119,153 0 $0 17 $96,055 1 $93,760 FILES CLOSED FOR INCOMPLETENESS 1 $80,000 13 $102,455 54 $116,233 1 $52,000 0 $0 4 $59,500 0 $0
Aggregated Statistics For Year 2004(Based on 6 full and 1 partial tracts) A) FHA, FSA/RHS & VA B) Conventional C) Refinancings D) Home Improvement Loans E) Loans on Dwellings For 5+ Families F) Non-occupant Loans on G) Loans On Manufactured Number Average Value Number Average Value Number Average Value Number Average Value Number Average Value Number Average Value Number Average Value
LOANS ORIGINATED 37 $101,457 171 $100,981 331 $88,832 49 $35,062 7 $1,848,703 99 $78,019 0 $0 APPLICATIONS APPROVED, NOT ACCEPTED 1 $75,000 29 $84,709 80 $89,719 19 $51,254 0 $0 11 $91,573 2 $34,075 APPLICATIONS DENIED 9 $92,033 49 $83,478 199 $87,066 55 $29,853 1 $1,000 15 $96,917 6 $26,832 APPLICATIONS WITHDRAWN 0 $0 24 $91,898 101 $90,872 9 $58,988 0 $0 8 $60,552 0 $0 FILES CLOSED FOR INCOMPLETENESS 2 $104,000 8 $82,515 98 $88,926 0 $0 0 $0 6 $73,000 0 $0
Aggregated Statistics For Year 2003(Based on 6 full and 1 partial tracts) A) FHA, FSA/RHS & VA B) Conventional C) Refinancings D) Home Improvement Loans E) Loans on Dwellings For 5+ Families F) Non-occupant Loans on Number Average Value Number Average Value Number Average Value Number Average Value Number Average Value Number Average Value
LOANS ORIGINATED 24 $90,550 148 $90,194 453 $89,501 48 $19,665 3 $247,207 113 $70,212 APPLICATIONS APPROVED, NOT ACCEPTED 2 $106,360 25 $83,113 60 $79,437 19 $29,732 0 $0 10 $58,789 APPLICATIONS DENIED 4 $117,112 49 $76,953 246 $83,501 61 $17,708 0 $0 29 $61,249 APPLICATIONS WITHDRAWN 4 $63,398 18 $88,149 105 $81,547 2 $17,500 0 $0 8 $54,442 FILES CLOSED FOR INCOMPLETENESS 2 $77,190 9 $94,000 17 $84,459 2 $14,255 0 $0 4 $75,000
Aggregated Statistics For Year 2002(Based on 4 full and 1 partial tracts) A) FHA, FSA/RHS & VA B) Conventional C) Refinancings D) Home Improvement Loans E) Loans on Dwellings For 5+ Families F) Non-occupant Loans on Number Average Value Number Average Value Number Average Value Number Average Value Number Average Value Number Average Value
LOANS ORIGINATED 34 $81,274 85 $95,162 237 $78,674 52 $24,079 2 $118,000 62 $63,163 APPLICATIONS APPROVED, NOT ACCEPTED 1 $71,000 9 $93,767 47 $67,574 5 $10,168 0 $0 12 $83,741 APPLICATIONS DENIED 3 $95,000 25 $71,658 116 $64,719 33 $20,165 1 $165,740 20 $60,188 APPLICATIONS WITHDRAWN 5 $85,084 5 $102,966 56 $82,558 9 $33,111 0 $0 7 $80,420 FILES CLOSED FOR INCOMPLETENESS 1 $83,340 10 $55,661 35 $76,185 0 $0 0 $0 7 $71,094
Aggregated Statistics For Year 2001(Based on 4 full and 1 partial tracts) A) FHA, FSA/RHS & VA B) Conventional C) Refinancings D) Home Improvement Loans E) Loans on Dwellings For 5+ Families F) Non-occupant Loans on Number Average Value Number Average Value Number Average Value Number Average Value Number Average Value Number Average Value
LOANS ORIGINATED 40 $86,714 93 $86,112 212 $75,137 43 $19,369 2 $439,480 66 $56,411 APPLICATIONS APPROVED, NOT ACCEPTED 0 $0 11 $93,589 40 $75,236 10 $19,931 0 $0 2 $76,000 APPLICATIONS DENIED 3 $79,393 30 $63,783 104 $64,295 30 $30,165 1 $123,120 19 $63,366 APPLICATIONS WITHDRAWN 4 $86,735 12 $118,069 65 $65,144 1 $60,000 0 $0 4 $49,000 FILES CLOSED FOR INCOMPLETENESS 0 $0 5 $87,200 27 $68,304 2 $34,500 0 $0 2 $53,890
Aggregated Statistics For Year 2000(Based on 4 full and 1 partial tracts) A) FHA, FSA/RHS & VA B) Conventional C) Refinancings D) Home Improvement Loans E) Loans on Dwellings For 5+ Families F) Non-occupant Loans on Number Average Value Number Average Value Number Average Value Number Average Value Number Average Value Number Average Value
LOANS ORIGINATED 56 $79,155 98 $76,140 81 $66,870 54 $26,996 3 $573,667 53 $54,728 APPLICATIONS APPROVED, NOT ACCEPTED 1 $75,770 13 $37,290 43 $53,003 13 $29,664 0 $0 12 $43,999 APPLICATIONS DENIED 11 $76,040 44 $54,402 101 $52,058 30 $18,286 1 $123,120 19 $42,684 APPLICATIONS WITHDRAWN 8 $60,408 16 $71,801 51 $56,948 4 $26,480 0 $0 5 $53,000 FILES CLOSED FOR INCOMPLETENESS 3 $85,607 5 $84,832 33 $72,379 1 $34,000 0 $0 2 $78,450
Aggregated Statistics For Year 1999(Based on 6 full and 1 partial tracts) A) FHA, FSA/RHS & VA B) Conventional C) Refinancings D) Home Improvement Loans E) Loans on Dwellings For 5+ Families F) Non-occupant Loans on Number Average Value Number Average Value Number Average Value Number Average Value Number Average Value Number Average Value
LOANS ORIGINATED 55 $79,199 66 $79,154 163 $59,099 59 $16,980 2 $167,665 35 $48,138 APPLICATIONS APPROVED, NOT ACCEPTED 1 $87,300 16 $41,535 64 $55,461 20 $12,278 0 $0 10 $54,356 APPLICATIONS DENIED 7 $58,286 33 $66,092 122 $67,632 57 $15,456 2 $271,260 22 $46,854 APPLICATIONS WITHDRAWN 2 $77,470 15 $104,023 68 $53,896 9 $20,357 0 $0 6 $37,062 FILES CLOSED FOR INCOMPLETENESS 1 $59,870 11 $67,916 45 $75,465 1 $7,980 0 $0 5 $63,266
Detailed HMDA statistics for the following Tracts:
0253.00
, 0254.00 , 0255.00 , 0256.00 , 0257.00 , 0258.00 , 0259.00
Private Mortgage Insurance Companies Aggregated Statistics For Year 2009(Based on 5 full and 1 partial tracts) A) Conventional B) Refinancings Number Average Value Number Average Value
LOANS ORIGINATED 7 $174,841 3 $305,510 APPLICATIONS APPROVED, NOT ACCEPTED 3 $153,667 1 $147,000 APPLICATIONS DENIED 3 $141,567 0 $0 APPLICATIONS WITHDRAWN 0 $0 2 $174,500 FILES CLOSED FOR INCOMPLETENESS 0 $0 0 $0
Aggregated Statistics For Year 2008(Based on 6 full and 1 partial tracts) A) Conventional B) Refinancings C) Non-occupant Loans on Number Average Value Number Average Value Number Average Value
LOANS ORIGINATED 26 $139,616 7 $198,013 2 $116,500 APPLICATIONS APPROVED, NOT ACCEPTED 9 $157,662 7 $139,860 0 $0 APPLICATIONS DENIED 2 $159,115 4 $191,000 5 $184,622 APPLICATIONS WITHDRAWN 1 $219,820 0 $0 0 $0 FILES CLOSED FOR INCOMPLETENESS 1 $92,820 0 $0 0 $0
Aggregated Statistics For Year 2007(Based on 6 full and 1 partial tracts) A) Conventional B) Refinancings C) Non-occupant Loans on Number Average Value Number Average Value Number Average Value
LOANS ORIGINATED 49 $147,954 16 $138,781 4 $115,362 APPLICATIONS APPROVED, NOT ACCEPTED 11 $128,699 6 $145,783 2 $134,500 APPLICATIONS DENIED 1 $66,000 0 $0 1 $66,000 APPLICATIONS WITHDRAWN 1 $67,000 0 $0 0 $0 FILES CLOSED FOR INCOMPLETENESS 0 $0 0 $0 0 $0
Aggregated Statistics For Year 2006(Based on 6 full and 1 partial tracts) A) Conventional B) Refinancings C) Non-occupant Loans on Number Average Value Number Average Value Number Average Value
LOANS ORIGINATED 70 $122,868 12 $132,599 8 $101,282 APPLICATIONS APPROVED, NOT ACCEPTED 10 $100,300 4 $143,465 1 $67,000 APPLICATIONS DENIED 1 $103,230 0 $0 0 $0 APPLICATIONS WITHDRAWN 9 $152,044 1 $250,000 0 $0 FILES CLOSED FOR INCOMPLETENESS 0 $0 0 $0 0 $0
Aggregated Statistics For Year 2005(Based on 6 full and 1 partial tracts) A) Conventional B) Refinancings C) Non-occupant Loans on Number Average Value Number Average Value Number Average Value
LOANS ORIGINATED 52 $135,738 8 $132,889 10 $75,552 APPLICATIONS APPROVED, NOT ACCEPTED 7 $86,616 9 $92,367 3 $49,623 APPLICATIONS DENIED 1 $53,000 0 $0 0 $0 APPLICATIONS WITHDRAWN 2 $210,830 3 $97,000 0 $0 FILES CLOSED FOR INCOMPLETENESS 0 $0 0 $0 0 $0
Aggregated Statistics For Year 2004(Based on 6 full and 1 partial tracts) A) Conventional B) Refinancings C) Non-occupant Loans on Number Average Value Number Average Value Number Average Value
LOANS ORIGINATED 50 $118,361 26 $109,733 14 $76,031 APPLICATIONS APPROVED, NOT ACCEPTED 8 $99,004 8 $134,500 1 $70,000 APPLICATIONS DENIED 2 $74,465 0 $0 0 $0 APPLICATIONS WITHDRAWN 0 $0 2 $88,500 0 $0 FILES CLOSED FOR INCOMPLETENESS 1 $111,000 0 $0 0 $0
Aggregated Statistics For Year 2003(Based on 6 full and 1 partial tracts) A) Conventional B) Refinancings C) Non-occupant Loans on Number Average Value Number Average Value Number Average Value
LOANS ORIGINATED 65 $93,268 38 $117,575 25 $65,638 APPLICATIONS APPROVED, NOT ACCEPTED 7 $97,171 5 $114,148 4 $111,750 APPLICATIONS DENIED 2 $77,000 3 $115,667 2 $77,000 APPLICATIONS WITHDRAWN 0 $0 2 $89,500 0 $0 FILES CLOSED FOR INCOMPLETENESS 0 $0 0 $0 0 $0
Aggregated Statistics For Year 2002(Based on 4 full and 1 partial tracts) A) Conventional B) Refinancings C) Non-occupant Loans on Number Average Value Number Average Value Number Average Value
LOANS ORIGINATED 43 $107,534 32 $105,676 6 $61,418 APPLICATIONS APPROVED, NOT ACCEPTED 11 $85,250 6 $114,333 5 $49,468 APPLICATIONS DENIED 3 $77,060 0 $0 0 $0 APPLICATIONS WITHDRAWN 1 $52,960 6 $112,070 0 $0 FILES CLOSED FOR INCOMPLETENESS 0 $0 2 $74,345 1 $43,570
Aggregated Statistics For Year 2001(Based on 4 full and 1 partial tracts) A) Conventional B) Refinancings C) Non-occupant Loans on Number Average Value Number Average Value Number Average Value
LOANS ORIGINATED 42 $106,040 17 $117,844 8 $47,585 APPLICATIONS APPROVED, NOT ACCEPTED 9 $93,921 9 $126,318 0 $0 APPLICATIONS DENIED 1 $48,960 0 $0 1 $48,960 APPLICATIONS WITHDRAWN 2 $48,960 0 $0 2 $48,960 FILES CLOSED FOR INCOMPLETENESS 0 $0 0 $0 0 $0
Aggregated Statistics For Year 2000(Based on 4 full and 1 partial tracts) A) Conventional B) Refinancings C) Non-occupant Loans on Number Average Value Number Average Value Number Average Value
LOANS ORIGINATED 27 $78,602 7 $64,183 3 $52,610 APPLICATIONS APPROVED, NOT ACCEPTED 3 $74,633 1 $59,000 0 $0 APPLICATIONS DENIED 0 $0 3 $58,727 0 $0 APPLICATIONS WITHDRAWN 2 $114,000 0 $0 1 $72,000 FILES CLOSED FOR INCOMPLETENESS 1 $28,000 0 $0 0 $0
Aggregated Statistics For Year 1999(Based on 6 full and 1 partial tracts) A) Conventional B) Refinancings C) Non-occupant Loans on Number Average Value Number Average Value Number Average Value
LOANS ORIGINATED 24 $98,877 11 $74,567 3 $52,003 APPLICATIONS APPROVED, NOT ACCEPTED 2 $57,700 2 $56,210 0 $0 APPLICATIONS DENIED 2 $50,620 0 $0 0 $0 APPLICATIONS WITHDRAWN 0 $0 1 $65,480 0 $0 FILES CLOSED FOR INCOMPLETENESS 0 $0 0 $0 0 $0
Detailed PMIC statistics for the following Tracts:
0253.00
, 0254.00 , 0255.00 , 0256.00 , 0257.00 , 0258.00 , 0259.00 Fire-safe hotels and motels in Gretna, Louisiana:
Clarion Inn Westbank, 100 Westbank Exprwy, Gretna, Louisiana 70053 Phone: (504) 366-2361, Fax: (504) 362-5814
Holiday Inn New Orleans Westbank Tower, 275 Whitney Ave, Gretna, Louisiana 70053 Phone: (504) 366-8535, Fax: (504) 367-9070
Courtyard New Orleans Westbank/Gretna, 5 Westbank Expy, Gretna, Louisiana 70053 Phone: (504) 366-1010, Fax: (504) 366-1090
Homewood Suites Gretna, 3 Westbank Expy, Gretna, Louisiana 70053 Phone: (504) 619-9800, Fax: (504) 619-9801
All 4 fire-safe hotels and motels in Gretna, Louisiana
Most common first names in Gretna, LA among deceased individuals Name Count Lived (average)
John 268 70.8 years Joseph 232 70.7 years Mary 223 76.3 years James 166 69.9 years Charles 148 70.8 years Robert 142 69.1 years William 128 68.8 years George 128 72.7 years Louis 111 75.2 years Edward 98 71.8 years
Most common last names in Gretna, LA among deceased individuals Last name Count Lived (average)
Smith 113 72.3 years Johnson 93 69.2 years Williams 92 69.4 years Brown 82 70.6 years Jones 73 72.4 years Leblanc 62 71.6 years Boudreaux 61 73.5 years Hebert 53 75.1 years Landry 45 70.9 years Miller 44 71.9 years
Gretna compared to Louisiana state average:
Unemployed percentage below state average. Hispanic race population percentage significantly above state average. Foreign-born population percentage significantly above state average. Length of stay since moving in significantly above state average. House age above state average. Institutionalized population percentage above state average.
#12 on the list of "Top 101 cities with the highest number of police officers per 1000 residents (population 5,000+)"
#23 on the list of "Top 100 high-educated but low-earning cities"
#84 on the list of "Top 101 cities with the most residents born in Honduras (population 500+)"
#35 (70053) on the list of "Top 101 zip codes with the largest percentage of French first ancestries (pop 5,000+)"
#46 on the list of "Top 101 counties with the lowest percentage of residents that drank alcohol in the past 30 days"
#49 on the list of "Top 101 counties with the largest decrease in the number of infant deaths per 1000 residents 2000-2006 to 2007-2013 (pop. 50,000+)"
#50 on the list of "Top 101 counties with the largest increase in the number of births per 1000 residents 2000-2006 to 2007-2013 (pop 50,000+)"
#64 on the list of "Top 101 counties with the highest number of infant deaths per 1000 residents 2007-2013 (pop. 50,000+)"
#68 on the list of "Top 101 counties with the highest surface withdrawal of fresh water for public supply (pop. 50,000+)"
Top Patent Applicants
Phil Barbee (14)
Gerald J. Cronley (6)
Derek Terrell Russ (3)
Gerald Cronley (3)
Devendra R. Algu (2)
Min Li (2)
Michael Ivic (2)
Santhi Antarikananda (2)
John Phillip Barbee, Jr. (1)
Najati Monem (1)
Total of 49 patent applications in 2008-2025.


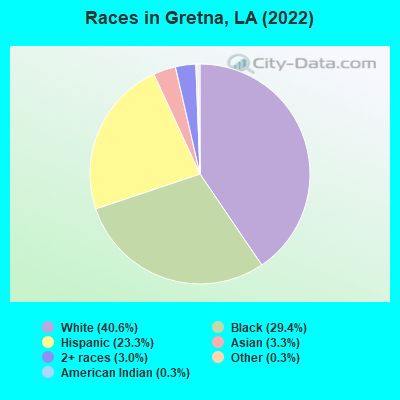
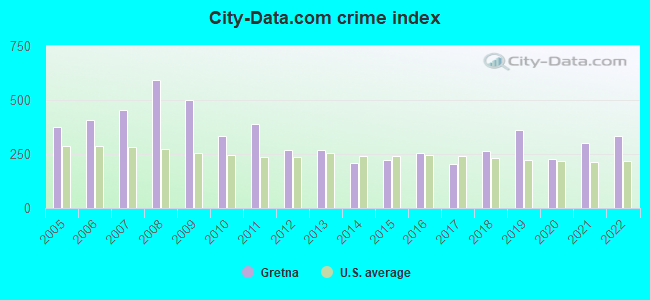
 Recent articles from our blog. Our writers, many of them Ph.D. graduates or candidates, create easy-to-read articles on a wide variety of topics.


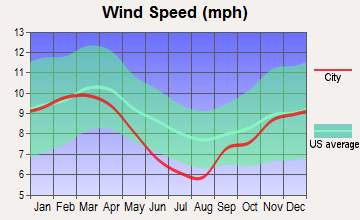
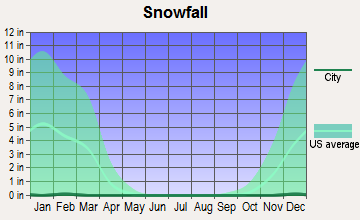
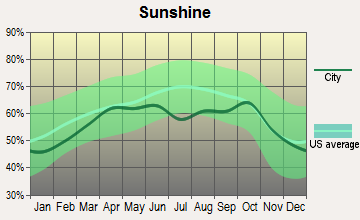
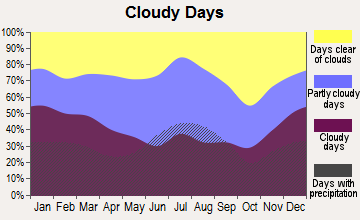
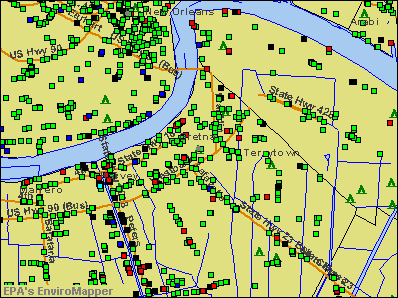

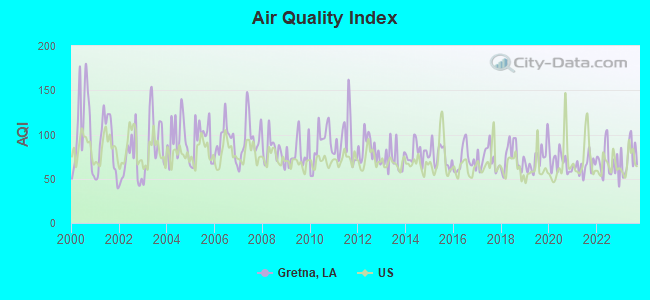
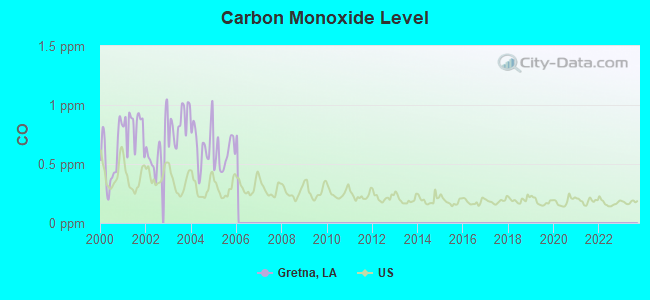
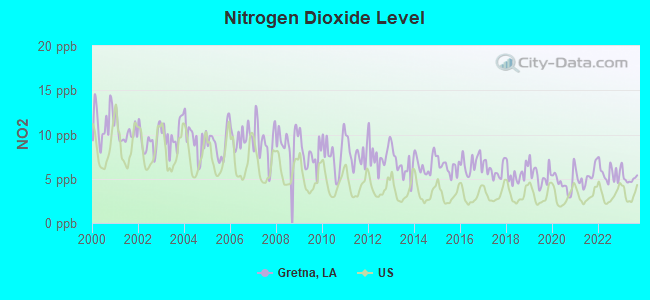
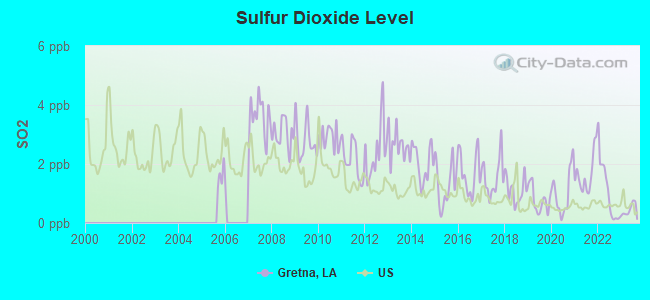
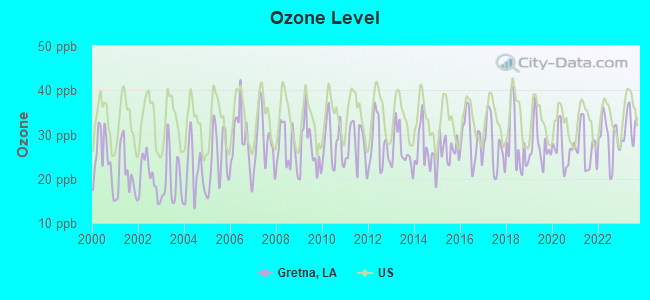
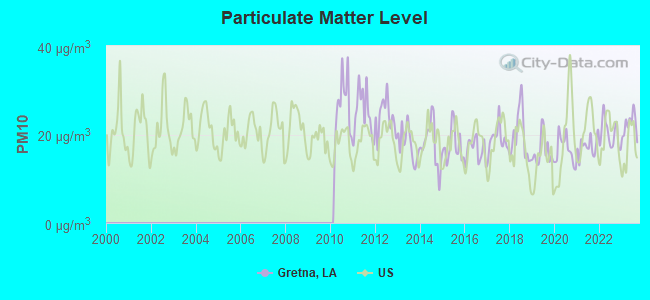
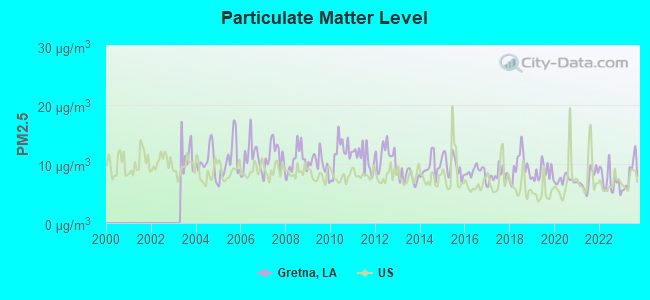
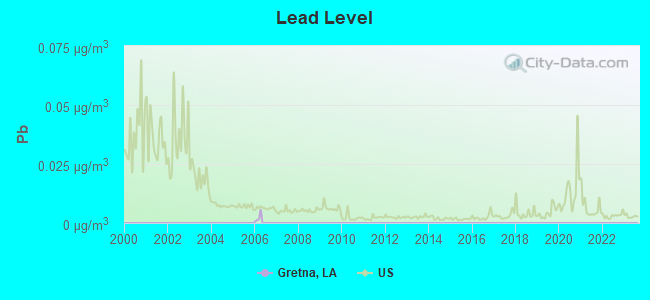
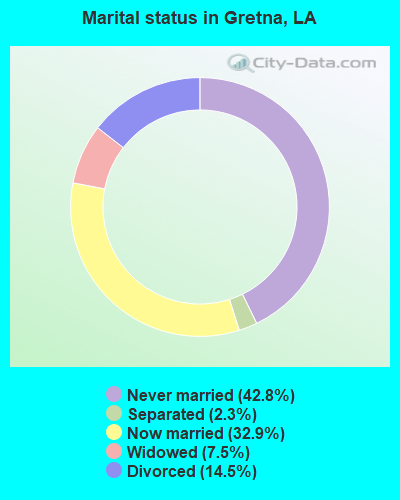
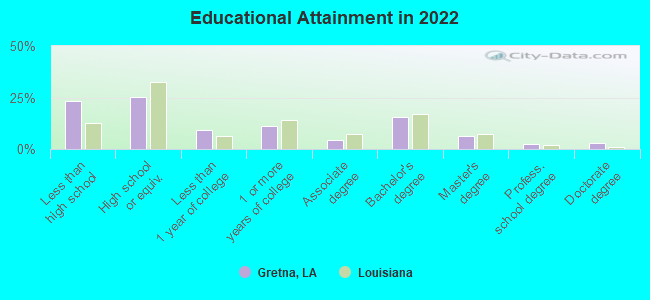
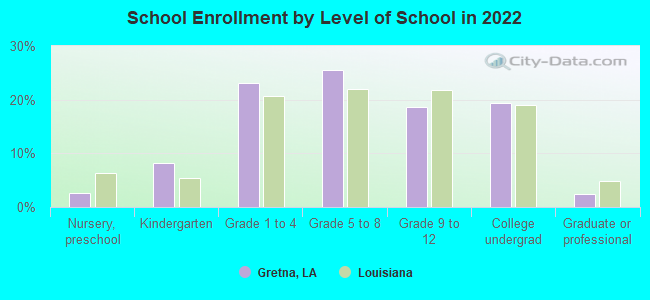
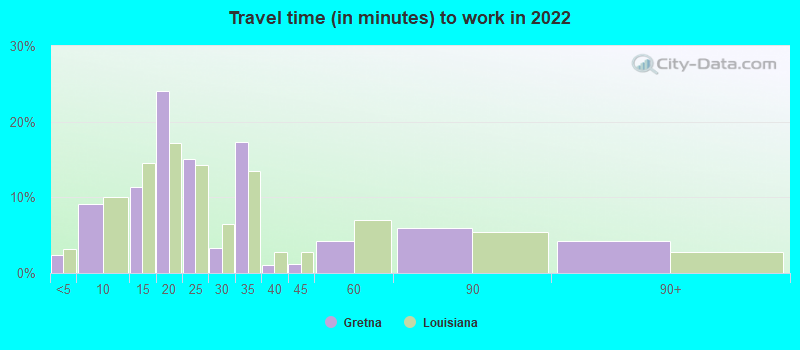
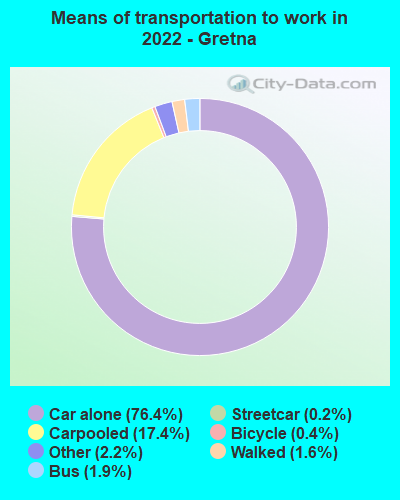
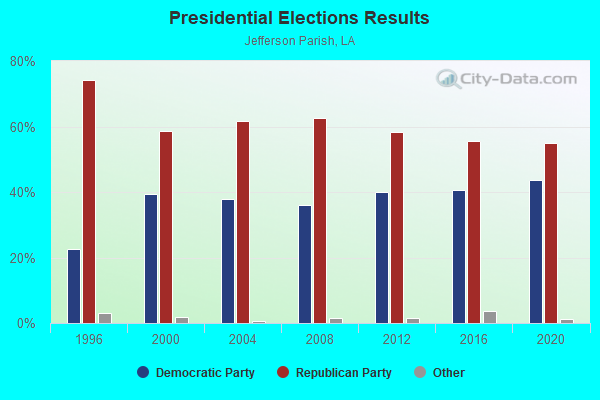
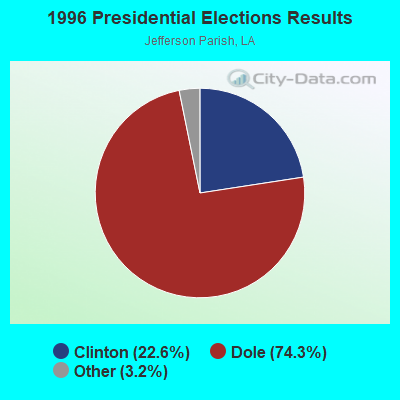
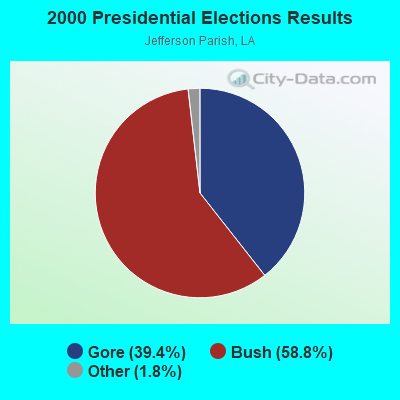
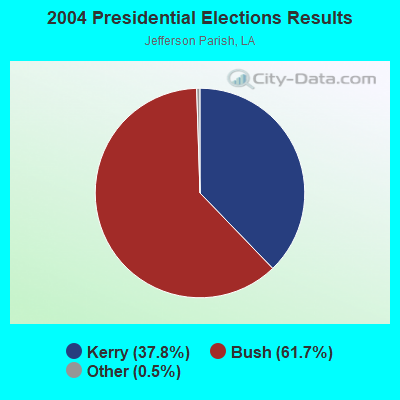
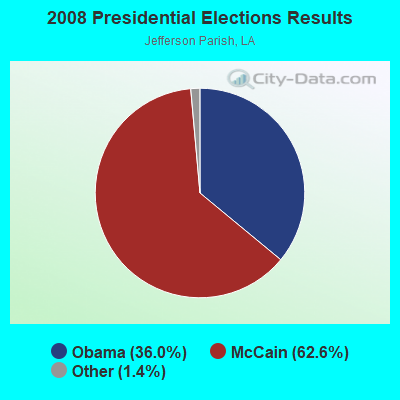
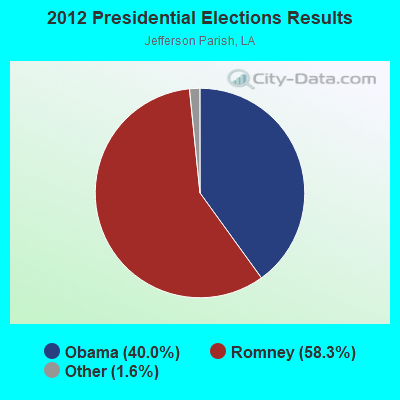
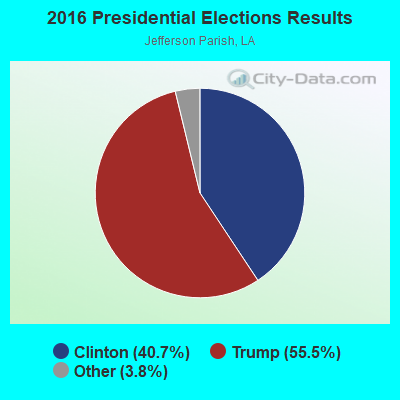
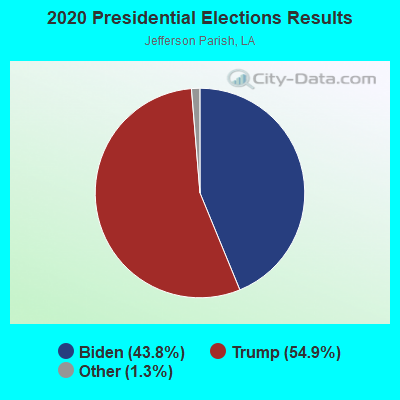

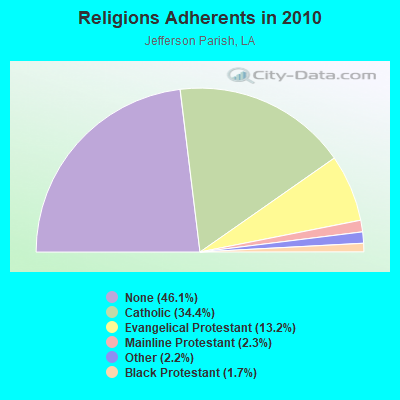
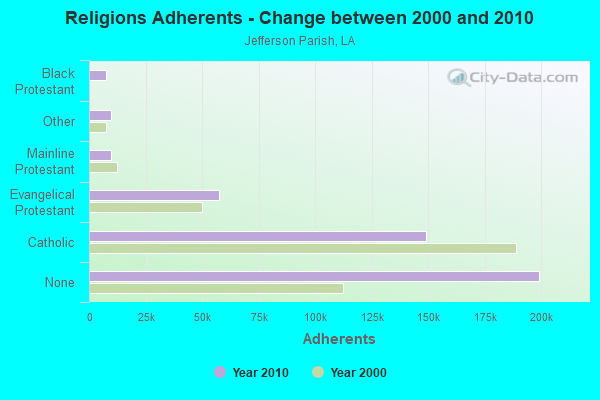
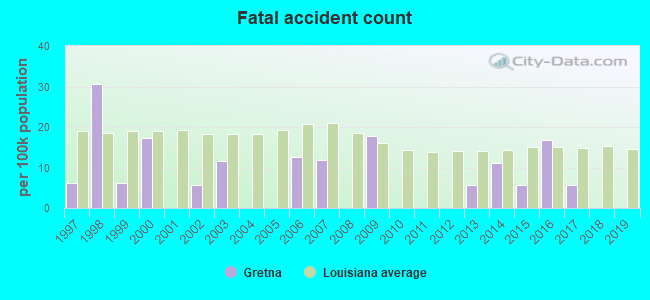
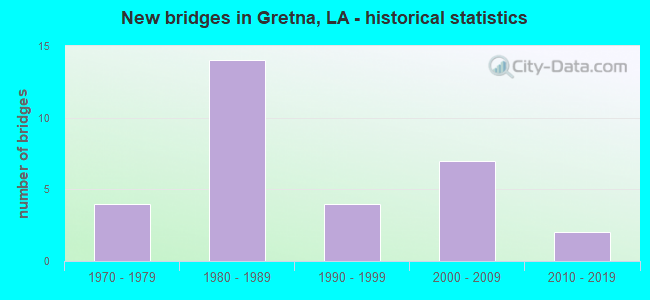
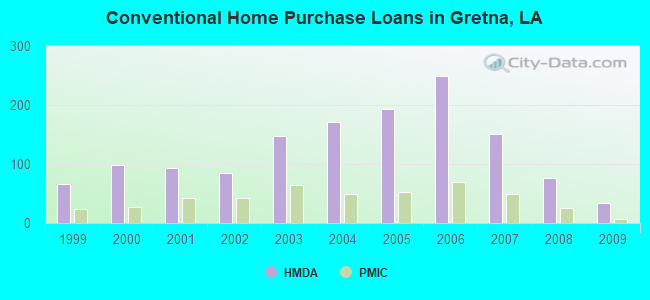
 Based on the data from the years 2002 - 2018 the average number of fire incidents per year is 75. The highest number of reported fire incidents - 155 took place in 2006, and the least - 0 in 2003. The data has a dropping trend.
 When looking into fire subcategories, the most incidents belonged to: Structure Fires (47.1%), and Outside Fires (26.8%).