Jennings, Louisiana
Submit your own pictures of this city and show them to the world
- OSM Map
- General Map
- Google Map
- MSN Map

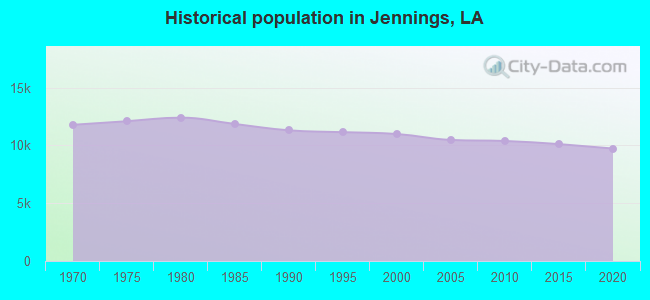
Population change since 2000: -12.7%
| Males: 4,319 | |
| Females: 5,275 |
| Median resident age: | 39.3 years |
| Louisiana median age: | 38.7 years |
Zip codes: 70546.
| Jennings: | $43,843 |
| LA: | $58,229 |
Estimated per capita income in 2023: $27,212 (it was $12,357 in 2000)
Jennings city income, earnings, and wages data
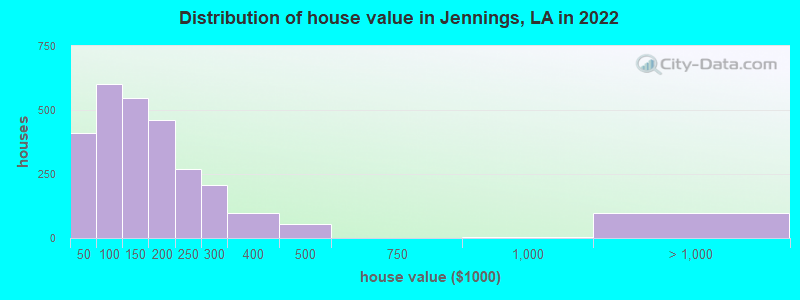
Estimated median house or condo value in 2023: $145,455 (it was $56,300 in 2000)
| Jennings: | $145,455 |
| LA: | $215,600 |
Median gross rent in 2023: $846.
(16.7% for White Non-Hispanic residents, 32.4% for Black residents, 26.7% for Hispanic or Latino residents, 57.1% for other race residents, 10.7% for two or more races residents)
Detailed information about poverty and poor residents in Jennings, LA

Compare current foreclosures in Jennings, LA:
| Photo | Address | Area | Beds / Baths | Price | Details |
|---|---|---|---|---|---|

|
#1
Dave Williams Rd
Jennings, LA 70546
|
1,691 sq. feet
|
1 baths 2 beds |
show details | |

|
#2
Renshaw St
Jennings, LA 70546
|
- sq. feet
|
- baths - beds |
$6,040
|
show details |

|
#3
Howard St
Jennings, LA 70546
|
- sq. feet
|
- baths - beds |
$6,040
|
show details |

|
#4
Penny St
Jennings, LA 70546
|
- sq. feet
|
- baths - beds |
$6,040
|
show details |

|
#5
Penny St
Jennings, LA 70546
|
- sq. feet
|
- baths - beds |
$6,040
|
show details |

|
#6
Mulkern St
Jennings, LA 70546
|
- sq. feet
|
- baths - beds |
$6,040
|
show details |

|
#7
Garage Aly
Jennings, LA 70546
|
- sq. feet
|
- baths - beds |
$6,040
|
show details |

|
#8
Garage Aly
Jennings, LA 70546
|
- sq. feet
|
- baths - beds |
$6,040
|
show details |

|
#9
W Willis St
Jennings, LA 70546
|
- sq. feet
|
- baths - beds |
$6,040
|
show details |

|
#10
Peterson St
Jennings, LA 70546
|
- sq. feet
|
- baths - beds |
$6,040
|
show details |
| Photo | Address | Area | Beds / Baths | Price | Details |
|---|---|---|---|---|---|

|
#11
W Willis St
Jennings, LA 70546
|
- sq. feet
|
- baths - beds |
$6,040
|
show details |

|
#12
W Willis St
Jennings, LA 70546
|
- sq. feet
|
- baths - beds |
$6,040
|
show details |

|
#13
Garage Aly
Jennings, LA 70546
|
- sq. feet
|
- baths - beds |
$6,040
|
show details |

|
#14
S Main St
Jennings, LA 70546
|
- sq. feet
|
- baths - beds |
$6,040
|
show details |

|
#15
Mulkern St
Jennings, LA 70546
|
- sq. feet
|
- baths - beds |
$6,040
|
show details |

|
#16
Mulkern St
Jennings, LA 70546
|
- sq. feet
|
- baths - beds |
$6,040
|
show details |

|
#17
S Broadway St
Jennings, LA 70546
|
- sq. feet
|
- baths - beds |
$6,040
|
show details |

|
#18
Orange St
Jennings, LA 70546
|
- sq. feet
|
- baths - beds |
$6,040
|
show details |

|
#19
E Jefferson St
Jennings, LA 70546
|
- sq. feet
|
- baths - beds |
$7,540
|
show details |

|
#20
S Main St
Jennings, LA 70546
|
- sq. feet
|
- baths - beds |
$6,040
|
show details |
| Photo | Address | Area | Beds / Baths | Price | Details |
|---|---|---|---|---|---|

|
#21
Garage Aly
Jennings, LA 70546
|
- sq. feet
|
- baths - beds |
$6,040
|
show details |

|
#22
E Wood St
Jennings, LA 70546
|
- sq. feet
|
- baths - beds |
$6,040
|
show details |

|
#23
W Nezpique St
Jennings, LA 70546
|
- sq. feet
|
- baths - beds |
$6,040
|
show details |

|
#24
St S
Jennings, LA 70546
|
- sq. feet
|
- baths - beds |
$6,040
|
show details |

|
#25
St S
Jennings, LA 70546
|
- sq. feet
|
- baths - beds |
$6,040
|
show details |

|
#26
S Main St
Jennings, LA 70546
|
- sq. feet
|
- baths - beds |
$6,040
|
show details |

|
#27
Renshaw St
Jennings, LA 70546
|
- sq. feet
|
- baths - beds |
$6,040
|
show details |

|
#28
Garage Aly
Jennings, LA 70546
|
- sq. feet
|
- baths - beds |
$6,040
|
show details |

|
#29
Smith St
Jennings, LA 70546
|
- sq. feet
|
- baths - beds |
$6,040
|
show details |

|
#30
West St
Jennings, LA 70546
|
- sq. feet
|
- baths - beds |
$6,040
|
show details |
| Photo | Address | Area | Beds / Baths | Price | Details |
|---|---|---|---|---|---|

|
#31
Orange St
Jennings, LA 70546
|
- sq. feet
|
- baths - beds |
$6,040
|
show details |

|
#32
St
Jennings, LA 70546
|
- sq. feet
|
- baths - beds |
$6,040
|
show details |

|
#33
Garage Aly
Jennings, LA 70546
|
- sq. feet
|
- baths - beds |
$6,040
|
show details |

|
#34
Of 102 Smith St
Jennings, LA 70546
|
- sq. feet
|
- baths - beds |
$6,040
|
show details |

|
#35
E Spencer St
Jennings, LA 70546
|
- sq. feet
|
- baths - beds |
$6,040
|
show details |

|
#36
Penny St
Jennings, LA 70546
|
- sq. feet
|
- baths - beds |
$6,040
|
show details |

|
#37
Garage Aly
Jennings, LA 70546
|
- sq. feet
|
- baths - beds |
$6,040
|
show details |

|
#38
S Main St
Jennings, LA 70546
|
- sq. feet
|
- baths - beds |
$6,165
|
show details |

|
#39
S Broadway St
Jennings, LA 70546
|
- sq. feet
|
- baths - beds |
$6,040
|
show details |

|
#40
E Sumner St
Jennings, LA 70546
|
- sq. feet
|
- baths - beds |
$6,040
|
show details |
| Photo | Address | Area | Beds / Baths | Price | Details |
|---|---|---|---|---|---|

|
#41
Mulkern St
Jennings, LA 70546
|
- sq. feet
|
- baths - beds |
$6,040
|
show details |

|
#42
Penny St
Jennings, LA 70546
|
- sq. feet
|
- baths - beds |
$6,040
|
show details |

|
#43
West St
Jennings, LA 70546
|
- sq. feet
|
- baths - beds |
$6,040
|
show details |

|
#44
Penny St
Jennings, LA 70546
|
- sq. feet
|
- baths - beds |
$6,040
|
show details |

|
#45
Orange St
Jennings, LA 70546
|
- sq. feet
|
- baths - beds |
$6,040
|
show details |

|
#46
S Craig St
Jennings, LA 70546
|
- sq. feet
|
- baths - beds |
$6,040
|
show details |

|
#47
Trailer Town Rd
Jennings, LA 70546
|
- sq. feet
|
2 baths 3 beds |
show details | |

|
#48
Harrington St
Jennings, LA 70546
|
- sq. feet
|
- baths - beds |
$54,900
|
show details |

|
#49
S Main St
Jennings, LA 70546
|
- sq. feet
|
- baths - beds |
$6,040
|
show details |

|
Check over 1 million property listings on Foreclosure.com!
|
browse all offers | |||


- 6,16564.4%White alone
- 2,09821.9%Black alone
- 8248.6%Two or more races
- 4314.5%Hispanic
- 540.6%Asian alone
- 490.5%American Indian alone
- 280.3%Other race alone
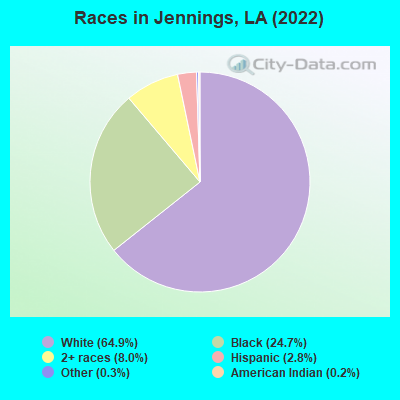
Races in Jennings detailed stats: ancestries, foreign born residents, place of birth
According to our research of Louisiana and other state lists, there were 36 registered sex offenders living in Jennings, Louisiana as of May 12, 2025.
The ratio of all residents to sex offenders in Jennings is 285 to 1.
Type |
2010 |
2011 |
2012 |
2013 |
2014 |
2015 |
2016 |
2017 |
2018 |
2019 |
2020 |
2021 |
2022 |
2023 |
|---|---|---|---|---|---|---|---|---|---|---|---|---|---|---|
| Murders (per 100,000) | 2 (19.3) | 2 (19.1) | 0 (0.0) | 0 (0.0) | 0 (0.0) | 0 (0.0) | 1 (9.9) | 0 (0.0) | 0 (0.0) | 1 (10.1) | 3 (30.8) | 0 (0.0) | 1 (10.3) | 0 (0.0) |
| Rapes (per 100,000) | 2 (19.3) | 1 (9.5) | 1 (9.5) | 0 (0.0) | 0 (0.0) | 0 (0.0) | 0 (0.0) | 0 (0.0) | 1 (10.1) | 1 (10.1) | 5 (51.4) | 4 (41.7) | 5 (51.7) | 4 (42.2) |
| Robberies (per 100,000) | 7 (67.4) | 4 (38.2) | 9 (85.9) | 6 (58.8) | 4 (39.5) | 3 (29.6) | 2 (19.7) | 0 (0.0) | 1 (10.1) | 3 (30.3) | 9 (92.4) | 3 (31.3) | 2 (20.7) | 11 (115.9) |
| Assaults (per 100,000) | 47 (452.7) | 34 (324.5) | 7 (66.8) | 24 (235.0) | 39 (384.7) | 18 (177.6) | 26 (256.4) | 22 (218.4) | 17 (170.9) | 14 (141.6) | 70 (718.9) | 99 (1,032) | 57 (589.8) | 81 (853.8) |
| Burglaries (per 100,000) | 130 (1,252) | 50 (477.2) | 55 (525.0) | 53 (519.0) | 62 (611.6) | 65 (641.5) | 58 (572.0) | 64 (635.3) | 19 (191.0) | 8 (80.9) | 48 (493.0) | 77 (802.8) | 57 (589.8) | 128 (1,349) |
| Thefts (per 100,000) | 222 (2,138) | 249 (2,376) | 250 (2,386) | 254 (2,488) | 222 (2,190) | 261 (2,576) | 252 (2,485) | 321 (3,186) | 169 (1,699) | 129 (1,305) | 223 (2,290) | 247 (2,575) | 230 (2,380) | 320 (3,373) |
| Auto thefts (per 100,000) | 5 (48.2) | 5 (47.7) | 0 (0.0) | 5 (49.0) | 9 (88.8) | 8 (78.9) | 11 (108.5) | 1 (9.9) | 0 (0.0) | 6 (60.7) | 21 (215.7) | 27 (281.5) | 27 (279.4) | 15 (158.1) |
| Arson (per 100,000) | 0 (0.0) | 2 (19.1) | 1 (9.5) | 2 (19.6) | 2 (19.7) | 0 (0.0) | 0 (0.0) | 1 (9.9) | 0 (0.0) | 3 (30.3) | 0 (0.0) | 0 (0.0) | 1 (10.3) | 2 (21.1) |
| City-Data.com crime index | 341.7 | 254.4 | 179.0 | 204.4 | 226.3 | 198.7 | 225.0 | 216.4 | 126.5 | 128.5 | 417.6 | 430.9 | 345.1 | 481.3 |
The City-Data.com crime index weighs serious crimes and violent crimes more heavily. Higher means more crime, U.S. average is 240.7. It adjusts for the number of visitors and daily workers commuting into cities.
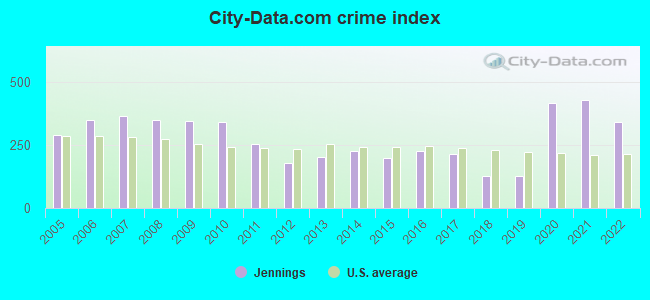
Crime rate in Jennings detailed stats: murders, rapes, robberies, assaults, burglaries, thefts, arson
Full-time law enforcement employees in 2023, including police officers: 30 (22 officers - 19 male; 3 female).
| Officers per 1,000 residents here: | 2.32 |
| Louisiana average: | 3.21 |
 Recent articles from our blog. Our writers, many of them Ph.D. graduates or candidates, create easy-to-read articles on a wide variety of topics.

 | What is the highest speed you can get away with in a 70 zone on I-10 / I-12 / or I-20? (45 replies) |
| Driving from Houston to New Orleans, should I avoid Baton Rouge? (5 replies) |
| Live crawfish (2 replies) |
| Cajun Country (10 replies) |
| Making a move to Oakdale (4 replies) |
| Help school teacher in Jennings (0 replies) |
Latest news from Jennings, LA collected exclusively by city-data.com from local newspapers, TV, and radio stations
Ancestries: French (17.7%), French Canadian (12.5%), American (10.6%), English (4.0%), Cajun (2.6%), German (2.6%).
Current Local Time: CST time zone
Elevation: 22 feet
Land area: 10.2 square miles.
Population density: 937 people per square mile (low).

162 residents are foreign born
| This city: | 1.7% |
| Louisiana: | 4.7% |
Median real estate property taxes paid for housing units with mortgages in 2023: $727 (0.5%)
Median real estate property taxes paid for housing units with no mortgage in 2023: $265 (0.2%)
Nearest city with pop. 50,000+: Lake Charles, LA (33.0 miles
, pop. 71,757).
Nearest city with pop. 200,000+: Baton Rouge, LA (92.0 miles
, pop. 227,818).
Nearest city with pop. 1,000,000+: Houston, TX (166.4 miles
, pop. 1,953,631).
Nearest cities:
Latitude: 30.22 N, Longitude: 92.66 W
Daytime population change due to commuting: +1,814 (+18.9%)
Workers who live and work in this city: 1,785 (49.7%)
Area code: 337

Jennings, Louisiana accommodation & food services, waste management - Economy and Business Data
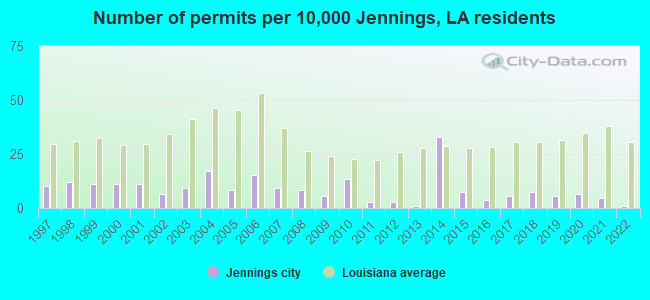
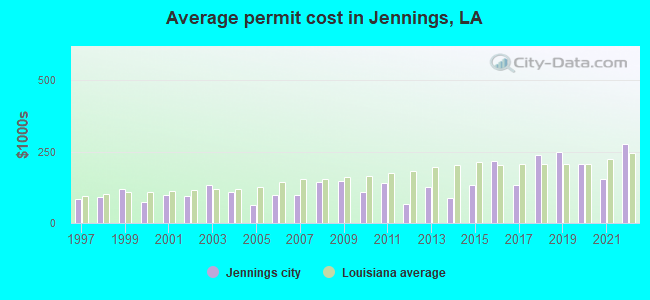
Single-family new house construction building permits:
- 2023: 7 buildings, average cost: $150,900
- 2022: 1 building, cost: $276,100
- 2021: 5 buildings, average cost: $155,700
- 2020: 7 buildings, average cost: $205,800
- 2019: 6 buildings, average cost: $250,000
- 2018: 8 buildings, average cost: $239,300
- 2017: 6 buildings, average cost: $133,100
- 2016: 4 buildings, average cost: $218,800
- 2015: 8 buildings, average cost: $133,800
- 2014: 36 buildings, average cost: $87,900
- 2013: 1 building, cost: $125,000
- 2012: 3 buildings, average cost: $67,300
- 2011: 3 buildings, average cost: $140,800
- 2010: 15 buildings, average cost: $107,500
- 2009: 6 buildings, average cost: $146,600
- 2008: 9 buildings, average cost: $143,000
- 2007: 10 buildings, average cost: $97,700
- 2006: 17 buildings, average cost: $99,100
- 2005: 9 buildings, average cost: $63,800
- 2004: 19 buildings, average cost: $109,700
- 2003: 10 buildings, average cost: $133,500
- 2002: 7 buildings, average cost: $92,700
- 2001: 12 buildings, average cost: $97,700
- 2000: 12 buildings, average cost: $73,800
- 1999: 12 buildings, average cost: $121,400
- 1998: 13 buildings, average cost: $92,200
- 1997: 11 buildings, average cost: $84,300
| Here: | 4.9% |
| Louisiana: | 4.3% |

- Retail trade (15.3%)
- Health care & social assistance (13.4%)
- Manufacturing (11.8%)
- Accommodation & food services (9.0%)
- Educational services (8.4%)
- Mining, quarrying, oil & gas extraction (7.5%)
- Public administration (5.9%)

- Manufacturing (21.3%)
- Mining, quarrying, oil & gas extraction (14.0%)
- Construction (9.6%)
- Public administration (9.1%)
- Health care & social assistance (8.8%)
- Arts, entertainment, recreation (6.1%)
- Accommodation & food services (4.9%)

- Retail trade (25.9%)
- Health care & social assistance (18.0%)
- Educational services (13.8%)
- Accommodation & food services (12.9%)
- Other services, except public administration (6.9%)
- Professional, scientific, technical services (4.6%)
- Finance & insurance (3.7%)
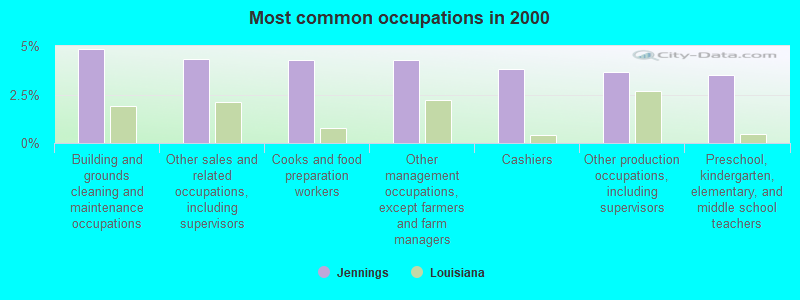
- Building and grounds cleaning and maintenance occupations (4.9%)
- Other sales and related occupations, including supervisors (4.3%)
- Cooks and food preparation workers (4.3%)
- Other management occupations, except farmers and farm managers (4.3%)
- Cashiers (3.8%)
- Other production occupations, including supervisors (3.7%)
- Preschool, kindergarten, elementary, and middle school teachers (3.5%)
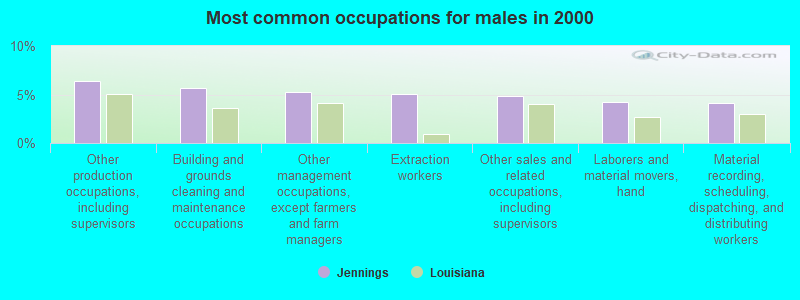
- Other production occupations, including supervisors (6.4%)
- Building and grounds cleaning and maintenance occupations (5.7%)
- Other management occupations, except farmers and farm managers (5.2%)
- Extraction workers (5.0%)
- Other sales and related occupations, including supervisors (4.9%)
- Laborers and material movers, hand (4.2%)
- Material recording, scheduling, dispatching, and distributing workers (4.1%)
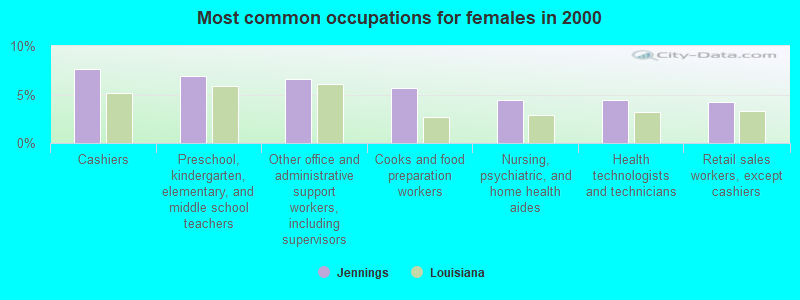
- Cashiers (7.6%)
- Preschool, kindergarten, elementary, and middle school teachers (7.0%)
- Other office and administrative support workers, including supervisors (6.6%)
- Cooks and food preparation workers (5.7%)
- Nursing, psychiatric, and home health aides (4.5%)
- Health technologists and technicians (4.4%)
- Retail sales workers, except cashiers (4.2%)
Average climate in Jennings, Louisiana
Based on data reported by over 4,000 weather stations


|
|


Tornado activity:
Jennings-area historical tornado activity is near Louisiana state average. It is 55% greater than the overall U.S. average.
On 10/29/1974, a category F3 (max. wind speeds 158-206 mph) tornado 8.6 miles away from the Jennings city center killed 2 people and injured 52 people and caused between $5,000,000 and $50,000,000 in damages.
On 4/4/1952, a category F3 tornado 13.2 miles away from the city center injured 10 people and caused between $50,000 and $500,000 in damages.
Earthquake activity:
Jennings-area historical earthquake activity is significantly above Louisiana state average. It is 42% smaller than the overall U.S. average.On 5/17/2012 at 08:12:00, a magnitude 4.8 (4.8 MW, Depth: 3.1 mi, Class: Light, Intensity: IV - V) earthquake occurred 155.5 miles away from Jennings center
On 9/2/2013 at 23:51:15, a magnitude 4.3 (4.3 MW, Depth: 2.9 mi) earthquake occurred 156.9 miles away from the city center
On 9/10/2006 at 14:56:08, a magnitude 5.9 (5.9 MB, 5.5 MS, 5.8 MW, Class: Moderate, Intensity: VI - VII) earthquake occurred 458.5 miles away from the city center
On 9/2/2013 at 21:52:38, a magnitude 4.2 (4.2 MW, Depth: 3.0 mi) earthquake occurred 163.7 miles away from Jennings center
On 1/25/2013 at 07:01:19, a magnitude 4.1 (4.1 MB, Depth: 3.1 mi) earthquake occurred 148.5 miles away from the city center
On 10/24/1997 at 08:35:17, a magnitude 4.9 (4.8 MB, 4.2 MS, 4.9 LG, Depth: 6.2 mi) earthquake occurred 326.3 miles away from the city center
Magnitude types: regional Lg-wave magnitude (LG), body-wave magnitude (MB), surface-wave magnitude (MS), moment magnitude (MW)
Natural disasters:
The number of natural disasters in Jefferson Davis Parish (38) is a lot greater than the US average (19).Major Disasters (Presidential) Declared: 15
Emergencies Declared: 4
Causes of natural disasters: Hurricanes: 16, Tropical Storms: 10, Floods: 5, Storms: 5, Winter Storms: 2, Drought: 1, Fire: 1, Freeze: 1, Ice Storm: 1, Other: 2 (Note: some incidents may be assigned to more than one category).

Hospitals in Jennings:
- ASTOR COMMUNITY HOME (610 MAGNOLIA DRIVE)
- CHURCH STREET COMMUNITY HOME (1103 CHURCH STREET)
- JENNINGS AMERICAN LEGION HOSPITAL (Voluntary non-profit - Private, provides emergency services, 1634 ELTON ROAD)
- JENNINGS SENIOR CARE HOSPITAL (provides emergency services, "1 HOSPITAL DRIVE, SUITE 201")
- LOUISIANA HOSPICE AND PALLIATIVE CARE OF JENNINGS (522 NORTH MAIN STREET)
- MAGNOLIA DRIVE COMMUNITY HOME (1618 MAGNOLIA DRIVE)
- PLAQUEMINE STREET COMMUNITY HOME (523 E PLAQUEMINE STREET)
- REHABILITATION HOSPITAL OF JENNINGS (provides emergency services, "1 HOSPITAL DRIVE, SUITE 101")
- SOUTHWEST COMMUNITY HOME (610 E ACADEMY DRIVE)
- WESTEND HOSPITAL (1530 HIGHWAY 90 WEST)
Airports located in Jennings:
- Jennings Airport (3R7) (Runways: 3, Itinerant Ops: 16,000, Local Ops: 34,480, Military Ops: 2,530)
Colleges/universities with over 2000 students nearest to Jennings:
- SOWELA Technical Community College (about 31 miles; Lake Charles, LA; Full-time enrollment: 2,160)
- McNeese State University (about 34 miles; Lake Charles, LA; FT enrollment: 7,444)
- South Louisiana Community College (about 37 miles; Lafayette, LA; FT enrollment: 2,519)
- Acadiana Technical College-Lafayette Campus (about 37 miles; Lafayette, LA; FT enrollment: 2,378)
- University of Louisiana at Lafayette (about 39 miles; Lafayette, LA; FT enrollment: 14,493)
- Lamar University (about 86 miles; Beaumont, TX; FT enrollment: 13,658)
- Lamar Institute of Technology (about 86 miles; Beaumont, TX; FT enrollment: 2,023)
Public high schools in Jennings:
- JENNINGS HIGH SCHOOL (Students: 919, Location: 2310 N SHERMAN STREET, Grades: 7-12)
- HATHAWAY HIGH SCHOOL (Students: 498, Location: 4040 PINE ISLAND HIGHWAY, Grades: PK-12)
Private high school in Jennings:
Public elementary/middle schools in Jennings:
- JENNINGS ELEMENTARY SCHOOL (Students: 588, Location: 620 FLORENCE STREET, Grades: 3-6)
- WARD ELEMENTARY SCHOOL (Location: 208 EAST SHANKLAND AVENUE, Grades: PK-2)
Private elementary/middle school in Jennings:
Points of interest:
Notable locations in Jennings: Jennings Wastewater Treatment Facility (A), Louisiana State University AgCenter Jefferson Davis Parish Office (B), Guinn Brothers Industrial Park (C), Jeff Davis Country Club (D), Jennings Airport Industrial Park (E), Jennings Golf Course (F), Port of Jennings Industrial Park (G), Jefferson Davis Parish Sheriff's Office - Narcotics Division (H), Jefferson Davis Parish Office (I), Zigler Art Museum (J), W H Tupper General Merchandise Museum (K), Jennings Police Department (L), Jefferson Davis Parish Sheriff's Office (M), Jefferson Davis Parish Library (N), Jefferson Davis Parish Criminal Court (O), Jefferson Davis Parish Police Jury (P), Jefferson Davis Parish Health Unit (Q), Jennings Fire Department (R), Jennings Fire Department Substation (S), Jeff Davis Nursing Home (T). Display/hide their locations on the map
Shopping Centers: Jennings Shopping Center (1), Jennings Village Shopping Center (2). Display/hide their locations on the map
Churches in Jennings include: Living Word Assembly of God Church (A), Jesus Worship United Pentecostal Church (B), First Presbyterian Church (C), Faith Tabernacle (D), Calvary Baptist Church (E), First Baptist Church (F), First Church of Christ (G), First Pentecostal Church (H), First United Methodist Church (I). Display/hide their locations on the map
Cemeteries: Calvary Cemetery (1), Greenwood Cemetery (2). Display/hide their locations on the map
Parks in Jennings include: North Cutting Park (1), Oil and Gas Park (2), Peters Street Playground (3), War Memorial Park (4), West End Park (5). Display/hide their locations on the map
Tourist attractions: Jennings City - Tourist Information Center (100 La Rue Acadian), Jeff Davis Parish Tourist Commission (100 La Rue Acadian).
Hotels: Boudreaux Inn (15189 Highway 26), Budget Inn (15368 Highway 26), Travel Connections (735 Granger Street), Comfort Inn (607 Holiday Dr), Holiday Inn Jennings (603 Holiday Drive), Days Inn (2002 Port Drive), Jennings Travelodge (2002 Port Drive), Comfort Inn Jennings (607 Holiday Drive), Jennings-Days Inn (2002 Port Dr).
Courts: Jefferson Davis Parish - Clerk Of Court- Civil & Criminal Department (Court House), Jefferson Davis Parish - Clerk Of Court- Recording Department (Court House), Jefferson Davis Parish - District Court Reporter (300 State Street), Clerk Of Court (Court House).
Birthplace of: Chancy Croft - Politician, Eugene John Hebert - Roman Catholic priest, Cleve Francis - Musician, Don Breaux - Football coach and player, Hunter B. Shirley - Psychologist, Pat Rapp - Baseball player.
Drinking water stations with addresses in Jennings and their reported violations in the past:
CITY OF JENNINGS WATER SYSTEM (Population served: 10,300, Groundwater):Past health violations:Past monitoring violations:
- MCL, Monthly (TCR) - In SEP-2011, Contaminant: Coliform. Follow-up actions: St Public Notif requested (OCT-10-2011), St Violation/Reminder Notice (OCT-10-2011), St Public Notif received (NOV-21-2011), St Compliance achieved (NOV-21-2011)
- MCL, Monthly (TCR) - In MAR-2009, Contaminant: Coliform. Follow-up actions: St Public Notif requested (APR-08-2009), St Violation/Reminder Notice (APR-08-2009), St Compliance achieved (APR-22-2009), St Public Notif received (APR-22-2009)
- MCL, Monthly (TCR) - In SEP-2005, Contaminant: Coliform. Follow-up actions: St Violation/Reminder Notice (OCT-13-2005), St Public Notif requested (OCT-13-2005)
- Failure To Address Deficiency - In NOV-01-2012, Contaminant: GROUNDWATER RULE
- One minor monitoring violation
| This city: | 2.5 people |
| Louisiana: | 2.5 people |
| This city: | 66.4% |
| Whole state: | 67.1% |
| This city: | 6.9% |
| Whole state: | 6.8% |
Likely homosexual households (counted as self-reported same-sex unmarried-partner households)
- Lesbian couples: 0.4% of all households
- Gay men: 0.2% of all households
People in group quarters in Jennings in 2010:
- 308 people in nursing facilities/skilled-nursing facilities
- 120 people in local jails and other municipal confinement facilities
- 24 people in group homes intended for adults
- 19 people in mental (psychiatric) hospitals and psychiatric units in other hospitals
People in group quarters in Jennings in 2000:
- 199 people in nursing homes
- 71 people in local jails and other confinement facilities (including police lockups)
- 23 people in homes for the mentally retarded
- 7 people in other noninstitutional group quarters
- 4 people in religious group quarters
Banks with branches in Jennings (2011 data):
- Jeff Davis Bank & Trust Company: Roberts Avenue Branch, at 507 Main Street, West Division Street Branch. Info updated 2006/11/03: Bank assets: $547.5 mil, Deposits: $475.6 mil, local headquarters, positive income, 14 total offices, Holding Company: Jeff Davis Bancshares, Inc.
- The Bank: at 1304 North Cutting Avenue, branch established on 1997/02/26; Jennings Motor Branch at 1304 N. Cutting Avenue, branch established on 2000/05/01. Info updated 2006/11/03: Bank assets: $155.7 mil, Deposits: $136.2 mil, local headquarters, positive income, Commercial Lending Specialization, 5 total offices, Holding Company: Bancshares, Inc., The
- MidSouth Bank, National Association: Jennings Branch at 1110 North Main, branch established on 1989/03/13. Info updated 2012/01/09: Bank assets: $1,396.1 mil, Deposits: $1,192.9 mil, headquarters in Lafayette, LA, positive income, Commercial Lending Specialization, 44 total offices, Holding Company: Midsouth Bancorp, Inc.
- Woodforest National Bank: Jennings Branch at 303 Interstate Drive, branch established on 2008/10/25. Info updated 2011/05/10: Bank assets: $3,488.9 mil, Deposits: $3,097.6 mil, headquarters in Houston, TX, positive income, Commercial Lending Specialization, 766 total offices, Holding Company: Woodforest Financial Group Employee Stock Ownership Plan (With 401(K) Provisions)
- First Guaranty Bank: Jennings Branch at 500 North Cary Avenue, branch established on 1997/11/21. Info updated 2011/07/11: Bank assets: $1,353.3 mil, Deposits: $1,208.9 mil, headquarters in Hammond, LA, positive income, Commercial Lending Specialization, 20 total offices, Holding Company: First Guaranty Bancshares, Inc.
- Capital One, National Association: Jennings Branch at 409 North Cary Avenue, branch established on 1934/10/01. Info updated 2011/07/01: Bank assets: $133,477.8 mil, Deposits: $97,063.7 mil, headquarters in Mclean, VA, positive income, 984 total offices, Holding Company: Capital One Financial Corporation
- St. Martin Bank and Trust Company: Jennings Branch at 128 East Academy Avenue, branch established on 1970/03/30. Info updated 2007/12/05: Bank assets: $351.5 mil, Deposits: $285.3 mil, headquarters in St. Martinville, LA, positive income, Commercial Lending Specialization, 11 total offices, Holding Company: Saint Martin Bancshares, Inc.
For population 15 years and over in Jennings:
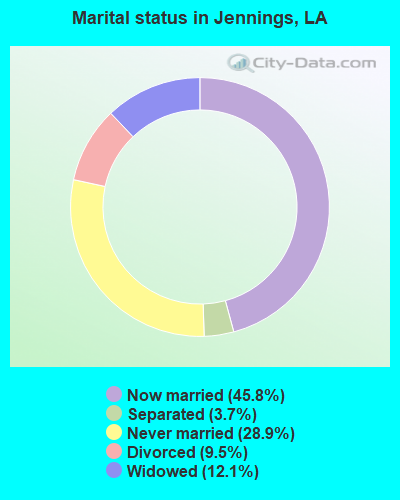
- Never married: 28.8%
- Now married: 45.2%
- Separated: 4.2%
- Widowed: 12.0%
- Divorced: 9.7%
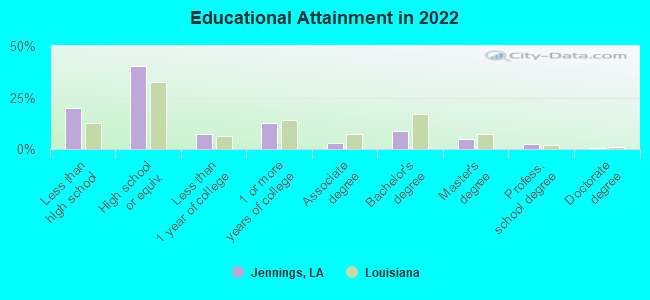
For population 25 years and over in Jennings:
- High school or higher: 78.4%
- Bachelor's degree or higher: 14.6%
- Graduate or professional degree: 7.2%
- Unemployed: 10.9%
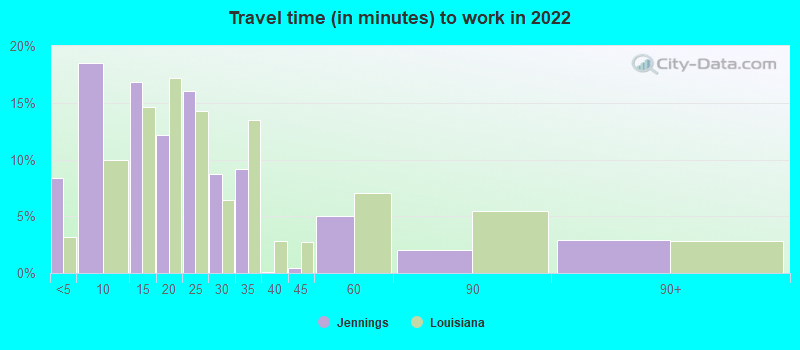
- Mean travel time to work (commute): 28.5 minutes

| Here: | 12.0 |
| Louisiana average: | 11.9 |
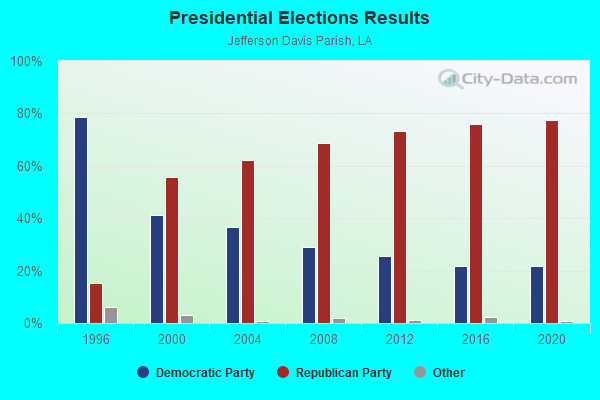
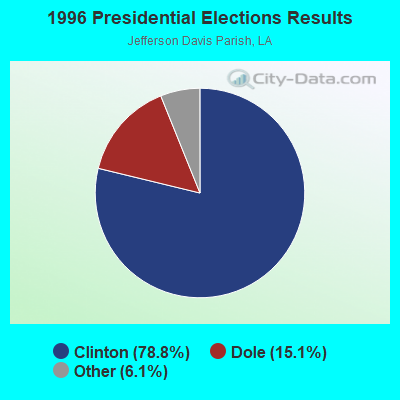
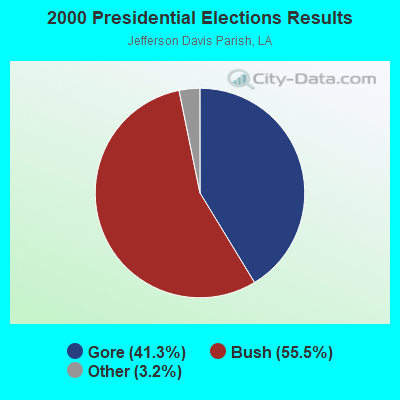
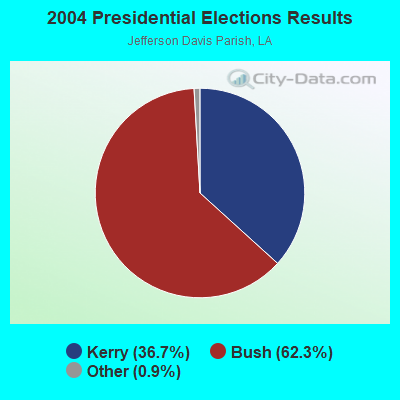
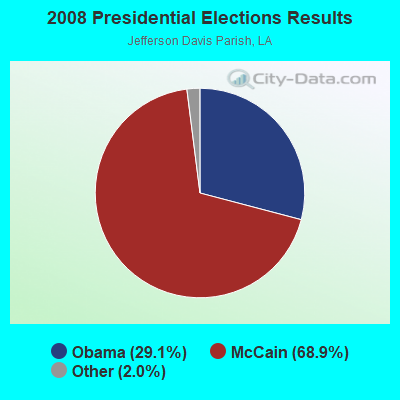
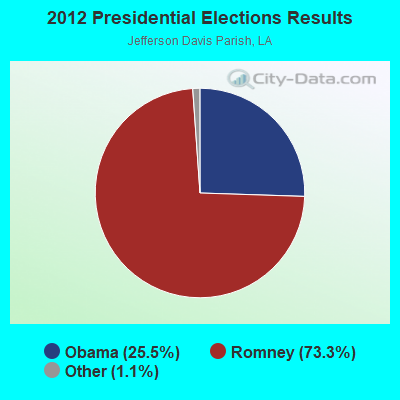
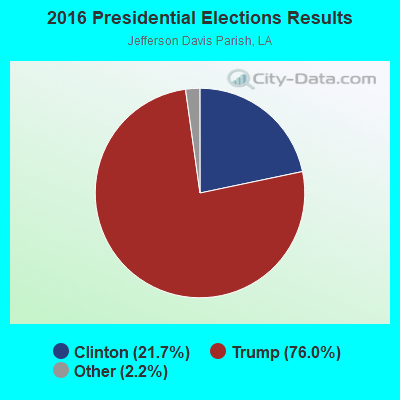
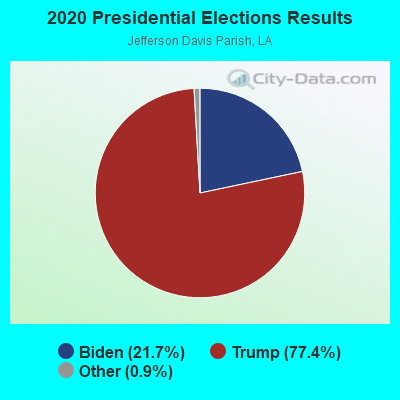

Graphs represent county-level data. Detailed 2008 Election Results
Religion statistics for Jennings, LA (based on Jefferson Davis Parish data)
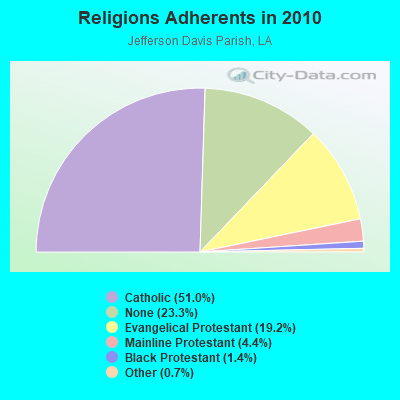
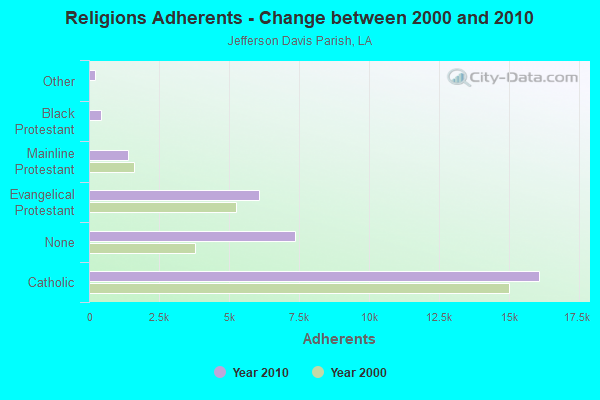
| Religion | Adherents | Congregations |
|---|---|---|
| Catholic | 16,100 | 11 |
| Evangelical Protestant | 6,078 | 23 |
| Mainline Protestant | 1,384 | 11 |
| Black Protestant | 441 | 3 |
| Other | 230 | 2 |
| None | 7,361 | - |
Food Environment Statistics:
| This county: | 3.21 / 10,000 pop. |
| State: | 2.56 / 10,000 pop. |
| Jefferson Davis Parish: | 0.32 / 10,000 pop. |
| Louisiana: | 0.18 / 10,000 pop. |
| This county: | 1.28 / 10,000 pop. |
| State: | 1.29 / 10,000 pop. |
| Jefferson Davis Parish: | 5.78 / 10,000 pop. |
| Louisiana: | 4.49 / 10,000 pop. |
| Jefferson Davis Parish: | 3.85 / 10,000 pop. |
| State: | 5.92 / 10,000 pop. |
| This county: | 11.4% |
| State: | 10.9% |
| Jefferson Davis Parish: | 32.0% |
| Louisiana: | 29.2% |
| Jefferson Davis Parish: | 11.1% |
| State: | 13.7% |
Health and Nutrition:
| Jennings: | 48.8% |
| Louisiana: | 49.4% |
| This city: | 44.2% |
| Louisiana: | 46.5% |
| Jennings: | 29.8 |
| State: | 29.1 |
| Jennings: | 20.4% |
| Louisiana: | 20.3% |
| This city: | 15.0% |
| Louisiana: | 11.4% |
| Jennings: | 6.8 |
| State: | 6.8 |
| Here: | 35.9% |
| Louisiana: | 34.5% |
| Jennings: | 54.2% |
| Louisiana: | 55.8% |
| Here: | 77.5% |
| Louisiana: | 80.2% |
More about Health and Nutrition of Jennings, LA Residents
| Local government employment and payroll (March 2022) | |||||
| Function | Full-time employees | Monthly full-time payroll | Average yearly full-time wage | Part-time employees | Monthly part-time payroll |
|---|---|---|---|---|---|
| Police Protection - Officers | 24 | $86,459 | $43,230 | 2 | $443 |
| Firefighters | 11 | $37,827 | $41,266 | 11 | $1,827 |
| Water Supply | 10 | $29,614 | $35,537 | 0 | $0 |
| Parks and Recreation | 10 | $24,782 | $29,738 | 5 | $1,709 |
| Financial Administration | 8 | $22,938 | $34,407 | 1 | $1,306 |
| Police - Other | 6 | $23,252 | $46,504 | 1 | $161 |
| Housing and Community Development (Local) | 5 | $18,584 | $44,602 | 0 | $0 |
| Streets and Highways | 5 | $15,436 | $37,046 | 0 | $0 |
| Sewerage | 5 | $15,615 | $37,476 | 0 | $0 |
| Judicial and Legal | 4 | $15,310 | $45,930 | 2 | $1,512 |
| Local Libraries | 4 | $9,278 | $27,834 | 3 | $2,234 |
| Other Government Administration | 2 | $12,252 | $73,512 | 5 | $2,500 |
| Fire - Other | 2 | $6,836 | $41,016 | 0 | $0 |
| Other and Unallocable | 1 | $2,949 | $35,388 | 1 | $1,789 |
| Health | 1 | $3,251 | $39,012 | 0 | $0 |
| Solid Waste Management | 1 | $2,710 | $32,520 | 0 | $0 |
| Totals for Government | 99 | $327,092 | $39,648 | 31 | $13,482 |
Jennings government finances - Expenditure in 2022 (per resident):
- Construction - General - Other: $1,586,000 ($165.31)
Housing and Community Development: $426,000 ($44.40)
Sewerage: $10,000 ($1.04)
Judicial and Legal Services: $4,000 ($0.42)
- Current Operations - Police Protection: $4,011,000 ($418.07)
Local Fire Protection: $1,553,000 ($161.87)
Solid Waste Management: $1,373,000 ($143.11)
Sewerage: $1,341,000 ($139.77)
Water Utilities: $1,239,000 ($129.14)
Regular Highways: $1,153,000 ($120.18)
Parks and Recreation: $995,000 ($103.71)
Housing and Community Development: $937,000 ($97.67)
Central Staff Services: $597,000 ($62.23)
Financial Administration: $397,000 ($41.38)
Judicial and Legal Services: $395,000 ($41.17)
Libraries: $322,000 ($33.56)
General - Other: $103,000 ($10.74)
Miscellaneous Commercial Activities - Other: $82,000 ($8.55)
Health - Other: $6,000 ($0.63)
- General - Interest on Debt: $227,000 ($23.66)
- Intergovernmental to Local - Other - General - Other: $44,000 ($4.59)
- Total Salaries and Wages: $223,000 ($23.24)
Jennings government finances - Revenue in 2022 (per resident):
- Charges - Sewerage: $1,088,000 ($113.40)
Solid Waste Management: $1,061,000 ($110.59)
Housing and Community Development: $657,000 ($68.48)
Other: $107,000 ($11.15)
Parks and Recreation: $84,000 ($8.76)
Miscellaneous Commercial Activities: $55,000 ($5.73)
- Federal Intergovernmental - Other: $1,047,000 ($109.13)
- Miscellaneous - General Revenue - Other: $1,015,000 ($105.80)
Interest Earnings: $721,000 ($75.15)
Fines and Forfeits: $346,000 ($36.06)
- Revenue - Water Utilities: $1,193,000 ($124.35)
- State Intergovernmental - Other: $618,000 ($64.42)
- Tax - General Sales and Gross Receipts: $6,184,000 ($644.57)
Property: $1,560,000 ($162.60)
Public Utilities Sales: $934,000 ($97.35)
Occupation and Business License - Other: $661,000 ($68.90)
Jennings government finances - Debt in 2022 (per resident):
- Long Term Debt - Beginning Outstanding - Unspecified Public Purpose: $4,483,000 ($467.27)
Outstanding Unspecified Public Purpose: $3,871,000 ($403.48)
Retired Unspecified Public Purpose: $612,000 ($63.79)
| Businesses in Jennings, LA | ||||
| Name | Count | Name | Count | |
|---|---|---|---|---|
| AT&T | 1 | Payless | 1 | |
| AutoZone | 1 | Pizza Hut | 1 | |
| Blockbuster | 1 | Popeyes | 1 | |
| Burger King | 1 | RadioShack | 1 | |
| Chevrolet | 1 | SONIC Drive-In | 1 | |
| Curves | 1 | Sears | 1 | |
| Days Inn | 1 | Subway | 2 | |
| FedEx | 2 | T-Mobile | 1 | |
| Ford | 1 | Taco Bell | 1 | |
| Goodwill | 2 | Toyota | 1 | |
| H&R Block | 1 | U-Haul | 2 | |
| Hilton | 1 | UPS | 3 | |
| Lane Furniture | 1 | Waffle House | 1 | |
| MasterBrand Cabinets | 1 | Walgreens | 1 | |
| McDonald's | 1 | Walmart | 1 | |
| Nike | 2 | Wendy's | 1 | |
Strongest AM radio stations in Jennings:
- KJEF (1290 AM; 1 kW; JENNINGS, LA; Owner: APEX BROADCASTING, INC.)
- KDYS (1520 AM; 10 kW; LAFAYETTE, LA; Owner: CITADEL BROADCASTING COMPANY)
- KTRH (740 AM; 50 kW; HOUSTON, TX; Owner: AMFM TEXAS LICENSES LIMITED PARTNERSHIP)
- KVOL (1330 AM; 5 kW; LAFAYETTE, LA; Owner: CITADEL BROADCASTING COMPANY)
- KLCL (1470 AM; 5 kW; LAKE CHARLES, LA; Owner: APEX BROADCASTING, INC.)
- WWL (870 AM; 50 kW; NEW ORLEANS, LA; Owner: ENTERCOM NEW ORLEANS LICENSE, LLC)
- KSIG (1450 AM; 1 kW; CROWLEY, LA; Owner: ACADIA BROADCAST PARTNERS, INC.)
- KEEL (710 AM; 50 kW; SHREVEPORT, LA; Owner: CITICASTERS LICENSES, L.P.)
- WLNO (1060 AM; 50 kW; NEW ORLEANS, LA; Owner: COMMUNICOM CO. OF LOUISIANA, L.P.)
- KGOL (1180 AM; 50 kW; HUMBLE, TX; Owner: ENTRAVISION HOLDINGS, LLC)
- KLVI (560 AM; 5 kW; BEAUMONT, TX; Owner: CAPSTAR TX LIMITED PARTNERSHIP)
- KWDF (840 AM; daytime; 8 kW; BALL, LA; Owner: BALL BROADCASTING CO.)
- KJMJ (580 AM; 5 kW; ALEXANDRIA, LA; Owner: RADIO MARIA, INC.)
Strongest FM radio stations in Jennings:
- K201FO (88.1 FM; JENNINGS, LA; Owner: CALVARY CHAPEL OF TWIN FALLS, INC.)
- KAJN-FM (102.9 FM; CROWLEY, LA; Owner: RICE CAPITAL BROADCASTING CO., INC.)
- KBXG (99.5 FM; LAKE CHARLES, LA; Owner: APEX BROADCASTING, INC.)
- KQIS (102.1 FM; BASILE, LA; Owner: THIRD PARTNER BROADCASTING, INC.)
- KRVS (88.7 FM; LAFAYETTE, LA; Owner: THE UNIVERSITY OF LOUISIANA AT LAFAYETTE)
- KSMB (94.5 FM; LAFAYETTE, LA; Owner: CITADEL BROADCASTING COMPANY)
- KVEE (107.5 FM; LAKE ARTHUR, LA; Owner: APEX BROADCASTING, INC.)
- KHLA (92.9 FM; JENNINGS, LA; Owner: APEX BROADCASTING, INC.)
- KOJO (91.7 FM; LAKE CHARLES, LA; Owner: RADIO MARIA, INC.)
- KYKZ (96.1 FM; LAKE CHARLES, LA; Owner: CUMULUS LICENSING CORP.)
- K217DZ (91.3 FM; JENNINGS, LA; Owner: FAMILY WORSHIP CENTER CHURCH, INC.)
- KBEB-FM (106.7 FM; RAYNE, LA; Owner: BROADCAST PARTNERS, INC.)
- KBIU (103.7 FM; LAKE CHARLES, LA; Owner: CUMULUS LICENSING CORP.)
- KJJB (105.5 FM; EUNICE, LA; Owner: TRI-PARISH BROADCASTING INCORPORATED)
- KRKA (107.9 FM; ERATH, LA; Owner: REGENT BROADCASTING OF LAFAYETTE, INC.)
- KFXZ (106.3 FM; MAURICE, LA; Owner: CITADEL BROADCASTING COMPANY)
TV broadcast stations around Jennings:
- KJEF-CA (Channel 13; JENNINGS, ETC., LA; Owner: APEX BROADCASTING, INC.)
- K45DI (Channel 45; MERMENTAU, LA; Owner: TRINITY BROADCASTING NETWORK)
- KLFY-TV (Channel 10; LAFAYETTE, LA; Owner: KLFY, L.P.)
- KPLC (Channel 7; LAKE CHARLES, LA; Owner: LIBCO, INC.)
- KLPB-TV (Channel 24; LAFAYETTE, LA; Owner: LOUISIANA EDUCATIONAL TELEVISION AUTHORITY)
- KATC (Channel 3; LAFAYETTE, LA; Owner: KATC COMMUNICATIONS, INC.)
- KLTL-TV (Channel 18; LAKE CHARLES, LA; Owner: LOUISIANA EDUCATIONAL TELEVISION AUTHORITY)
- KADN (Channel 15; LAFAYETTE, LA; Owner: KADN-15, INC.)
- KAGN-LP (Channel 65; CROWLEY, LA; Owner: RICE CAPITAL BROADCASTING COMPANY, INC.)
- K69HD (Channel 69; CHURCH POINT, LA; Owner: GULF MANAGEMENT II, L.L.C.)
- KLAF-LP (Channel 62; OPELOUSAS, LA; Owner: WNTZ-48, INC.)
- National Bridge Inventory (NBI) Statistics
- 14Number of bridges
- 180ft / 55.0mTotal length
- $3,320,000Total costs
- 293,666Total average daily traffic
- 18,193Total average daily truck traffic
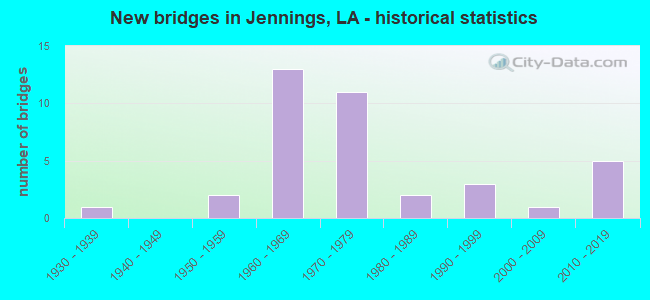
- New bridges - historical statistics
- 11930-1939
- 11950-1959
- 31960-1969
- 12000-2009
- 22010-2019
FCC Registered Antenna Towers: 136 (See the full list of FCC Registered Antenna Towers)
FCC Registered Commercial Land Mobile Towers: 1 (See the full list of FCC Registered Commercial Land Mobile Towers in Jennings, LA)
FCC Registered Private Land Mobile Towers: 1 (See the full list of FCC Registered Private Land Mobile Towers)
FCC Registered Broadcast Land Mobile Towers: 12 (See the full list of FCC Registered Broadcast Land Mobile Towers)
FCC Registered Microwave Towers: 19 (See the full list of FCC Registered Microwave Towers in this town)
FCC Registered Paging Towers: 5 (See the full list of FCC Registered Paging Towers)
FCC Registered Maritime Coast & Aviation Ground Towers: 7 (See the full list of FCC Registered Maritime Coast & Aviation Ground Towers)
FCC Registered Amateur Radio Licenses: 42 (See the full list of FCC Registered Amateur Radio Licenses in Jennings)
FAA Registered Aircraft Manufacturers and Dealers: 4 (See the full list of FAA Registered Manufacturers and Dealers in Jennings)
FAA Registered Aircraft: 47 (See the full list of FAA Registered Aircraft)
2003 - 2018 National Fire Incident Reporting System (NFIRS) incidents
- Fire incident types reported to NFIRS in Jennings, LA
- 58442.9%Structure Fires
- 35826.3%Outside Fires
- 23517.3%Mobile Property/Vehicle Fires
- 18513.6%Other
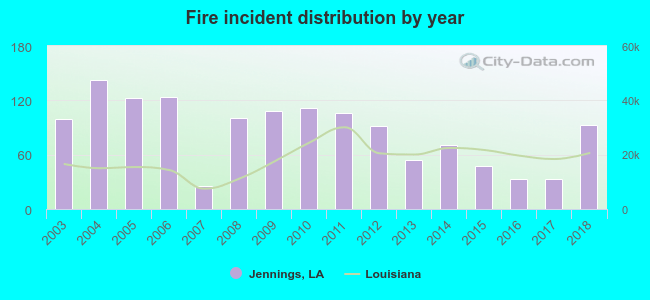 Based on the data from the years 2003 - 2018 the average number of fires per year is 85. The highest number of reported fire incidents - 143 took place in 2004, and the least - 25 in 2007. The data has a decreasing trend.
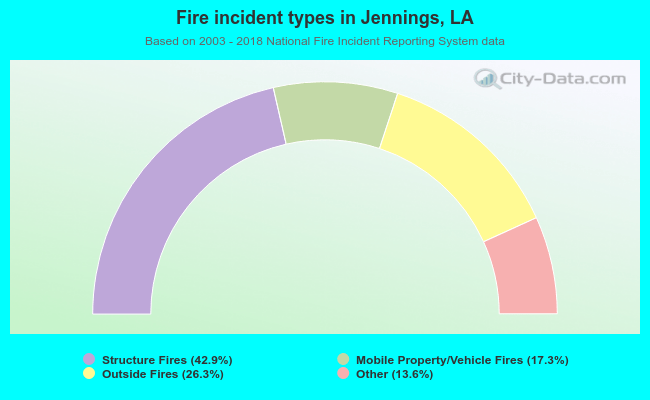 When looking into fire subcategories, the most reports belonged to: Structure Fires (42.9%), and Outside Fires (26.3%).
Fire-safe hotels and motels in Jennings, Louisiana:
- Comfort Inn, 607 Holiday Dr, Jennings, Louisiana 70546 , Phone: (337) 824-8589, Fax: (337) 824-8595
- Days Inn Jennings, 603 Holiday Dr, Jennings, Louisiana 70546 , Phone: (337) 824-5280, Fax: (337) 824-7941
- Hampton Inn & Suites Jennings, 310 W Fred -Ruth Zigler Memorial Dr, Jennings, Louisiana 70546 , Phone: (337) 824-2699, Fax: (337) 824-2704
- Howard Johnson Jennings, 2002 Port Dr, Jennings, Louisiana 70546 , Phone: (337) 824-6550
| Most common first names in Jennings, LA among deceased individuals | ||
| Name | Count | Lived (average) |
|---|---|---|
| John | 112 | 69.6 years |
| Mary | 109 | 77.2 years |
| Joseph | 89 | 71.9 years |
| Robert | 47 | 66.2 years |
| James | 46 | 70.8 years |
| Charles | 46 | 71.5 years |
| Louis | 40 | 76.4 years |
| Henry | 40 | 73.9 years |
| William | 40 | 71.3 years |
| Marie | 39 | 79.4 years |
| Most common last names in Jennings, LA among deceased individuals | ||
| Last name | Count | Lived (average) |
|---|---|---|
| Miller | 110 | 77.1 years |
| Fontenot | 93 | 74.4 years |
| Broussard | 87 | 75.5 years |
| Guidry | 76 | 74.7 years |
| Landry | 73 | 75.3 years |
| Hebert | 68 | 74.3 years |
| Leblanc | 63 | 73.6 years |
| Lejeune | 63 | 73.8 years |
| Benoit | 61 | 70.8 years |
| Trahan | 60 | 75.6 years |
Jennings compared to Louisiana state average:
- Hispanic race population percentage below state average.
- Foreign-born population percentage significantly below state average.
- Length of stay since moving in significantly above state average.
- Institutionalized population percentage above state average.
- Number of college students below state average.
Jennings on our top lists:
- #49 on the list of "Top 101 cities with largest percentage of females in occupations: sales and related occupations (population 5,000+)"
- #93 on the list of "Top 101 cities with largest percentage of males in industries: mining, quarrying, and oil and gas extraction (population 5,000+)"
- #58 (70546) on the list of "Top 101 zip codes with the largest percentage of French Canadian first ancestries (pop 5,000+)"
- #68 (70546) on the list of "Top 101 zip codes with the largest percentage of French first ancestries (pop 5,000+)"

|
Total of 2 patent applications in 2008-2025.