Reserve, Louisiana Submit your own pictures of this place and show them to the world
OSM Map
General Map
Google Map
MSN Map
OSM Map
General Map
Google Map
MSN Map
OSM Map
General Map
Google Map
MSN Map
OSM Map
General Map
Google Map
MSN Map
Please wait while loading the map...
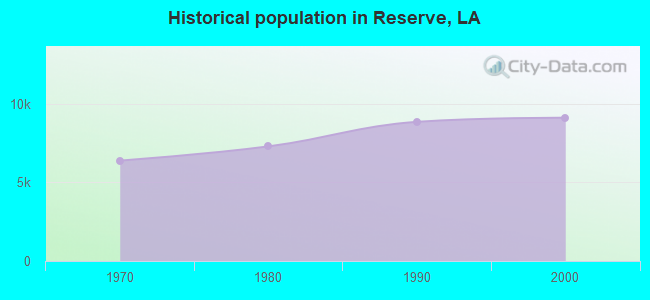
Population in 2010: 9,766. Population change since 2000: +7.2%Males: 5,230 Females: 4,536
December 2024 cost of living index in Reserve: 94.6 (less than average, U.S. average is 100) Percentage of residents living in poverty in 2023: 13.5%for White Non-Hispanic residents , 15.1% for Black residents , 5.6% for Hispanic or Latino residents , 3.5% for American Indian residents , 34.0% for two or more races residents )
Profiles of local businesses
Business Search - 14 Million verified businesses
Data:
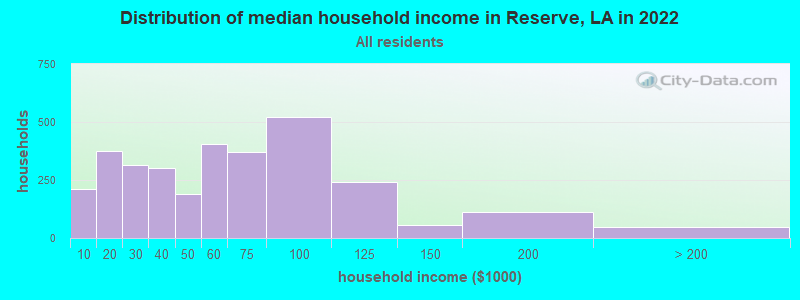
Median household income ($)
Median household income (% change since 2000)
Household income diversity
Ratio of average income to average house value (%)
Ratio of average income to average rent
Median household income ($) - White
Median household income ($) - Black or African American
Median household income ($) - Asian
Median household income ($) - Hispanic or Latino
Median household income ($) - American Indian and Alaska Native
Median household income ($) - Multirace
Median household income ($) - Other Race
Median household income for houses/condos with a mortgage ($)
Median household income for apartments without a mortgage ($)
Races - White alone (%)
Races - White alone (% change since 2000)
Races - Black alone (%)
Races - Black alone (% change since 2000)
Races - American Indian alone (%)
Races - American Indian alone (% change since 2000)
Races - Asian alone (%)
Races - Asian alone (% change since 2000)
Races - Hispanic (%)
Races - Hispanic (% change since 2000)
Races - Native Hawaiian and Other Pacific Islander alone (%)
Races - Native Hawaiian and Other Pacific Islander alone (% change since 2000)
Races - Two or more races (%)
Races - Two or more races (% change since 2000)
Races - Other race alone (%)
Races - Other race alone (% change since 2000)
Racial diversity
Unemployment (%)
Unemployment (% change since 2000)
Unemployment (%) - White
Unemployment (%) - Black or African American
Unemployment (%) - Asian
Unemployment (%) - Hispanic or Latino
Unemployment (%) - American Indian and Alaska Native
Unemployment (%) - Multirace
Unemployment (%) - Other Race
Population density (people per square mile)
Population - Males (%)
Population - Females (%)
Population - Males (%) - White
Population - Males (%) - Black or African American
Population - Males (%) - Asian
Population - Males (%) - Hispanic or Latino
Population - Males (%) - American Indian and Alaska Native
Population - Males (%) - Multirace
Population - Males (%) - Other Race
Population - Females (%) - White
Population - Females (%) - Black or African American
Population - Females (%) - Asian
Population - Females (%) - Hispanic or Latino
Population - Females (%) - American Indian and Alaska Native
Population - Females (%) - Multirace
Population - Females (%) - Other Race
Coronavirus confirmed cases (May 04, 2025)
Deaths caused by coronavirus (May 04, 2025)
Coronavirus confirmed cases (per 100k population) (May 04, 2025)
Deaths caused by coronavirus (per 100k population) (May 04, 2025)
Daily increase in number of cases (May 04, 2025)
Weekly increase in number of cases (May 04, 2025)
Cases doubled (in days) (May 04, 2025)
Hospitalized patients (Apr 18, 2022)
Negative test results (Apr 18, 2022)
Total test results (Apr 18, 2022)
COVID Vaccine doses distributed (per 100k population) (Sep 19, 2023)
COVID Vaccine doses administered (per 100k population) (Sep 19, 2023)
COVID Vaccine doses distributed (Sep 19, 2023)
COVID Vaccine doses administered (Sep 19, 2023)
Likely homosexual households (%)
Likely homosexual households (% change since 2000)
Likely homosexual households - Lesbian couples (%)
Likely homosexual households - Lesbian couples (% change since 2000)
Likely homosexual households - Gay men (%)
Likely homosexual households - Gay men (% change since 2000)
Cost of living index
Median gross rent ($)
Median contract rent ($)
Median monthly housing costs ($)
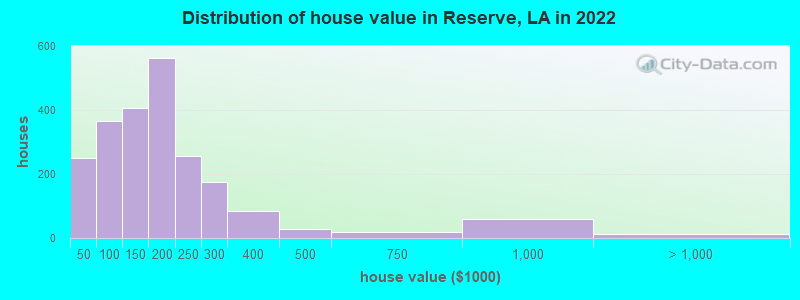
Median house or condo value ($)
Median house or condo value ($ change since 2000)
Mean house or condo value by units in structure - 1, detached ($)
Mean house or condo value by units in structure - 1, attached ($)
Mean house or condo value by units in structure - 2 ($)
Mean house or condo value by units in structure by units in structure - 3 or 4 ($)
Mean house or condo value by units in structure - 5 or more ($)
Mean house or condo value by units in structure - Boat, RV, van, etc. ($)
Mean house or condo value by units in structure - Mobile home ($)
Median house or condo value ($) - White
Median house or condo value ($) - Black or African American
Median house or condo value ($) - Asian
Median house or condo value ($) - Hispanic or Latino
Median house or condo value ($) - American Indian and Alaska Native
Median house or condo value ($) - Multirace
Median house or condo value ($) - Other Race
Median resident age
Resident age diversity
Median resident age - Males
Median resident age - Females
Median resident age - White
Median resident age - Black or African American
Median resident age - Asian
Median resident age - Hispanic or Latino
Median resident age - American Indian and Alaska Native
Median resident age - Multirace
Median resident age - Other Race
Median resident age - Males - White
Median resident age - Males - Black or African American
Median resident age - Males - Asian
Median resident age - Males - Hispanic or Latino
Median resident age - Males - American Indian and Alaska Native
Median resident age - Males - Multirace
Median resident age - Males - Other Race
Median resident age - Females - White
Median resident age - Females - Black or African American
Median resident age - Females - Asian
Median resident age - Females - Hispanic or Latino
Median resident age - Females - American Indian and Alaska Native
Median resident age - Females - Multirace
Median resident age - Females - Other Race
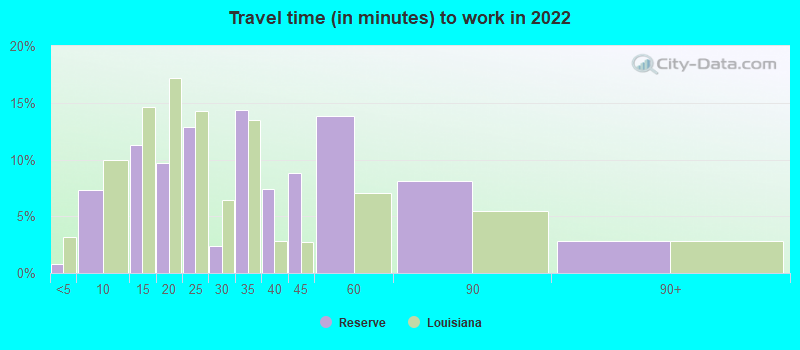
Commute - mean travel time to work (minutes)
Travel time to work - Less than 5 minutes (%)
Travel time to work - Less than 5 minutes (% change since 2000)
Travel time to work - 5 to 9 minutes (%)
Travel time to work - 5 to 9 minutes (% change since 2000)
Travel time to work - 10 to 19 minutes (%)
Travel time to work - 10 to 19 minutes (% change since 2000)
Travel time to work - 20 to 29 minutes (%)
Travel time to work - 20 to 29 minutes (% change since 2000)
Travel time to work - 30 to 39 minutes (%)
Travel time to work - 30 to 39 minutes (% change since 2000)
Travel time to work - 40 to 59 minutes (%)
Travel time to work - 40 to 59 minutes (% change since 2000)
Travel time to work - 60 to 89 minutes (%)
Travel time to work - 60 to 89 minutes (% change since 2000)
Travel time to work - 90 or more minutes (%)
Travel time to work - 90 or more minutes (% change since 2000)
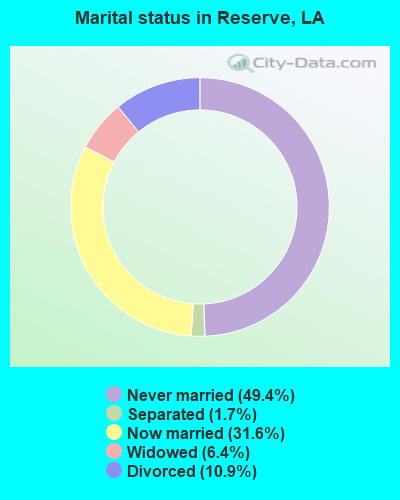
Marital status - Never married (%)
Marital status - Now married (%)
Marital status - Separated (%)
Marital status - Widowed (%)
Marital status - Divorced (%)
Median family income ($)
Median family income (% change since 2000)
Median non-family income ($)
Median non-family income (% change since 2000)
Median per capita income ($)
Median per capita income (% change since 2000)
Median family income ($) - White
Median family income ($) - Black or African American
Median family income ($) - Asian
Median family income ($) - Hispanic or Latino
Median family income ($) - American Indian and Alaska Native
Median family income ($) - Multirace
Median family income ($) - Other Race
Median year house/condo built
Median year apartment built
Year house built - Built 2005 or later (%)
Year house built - Built 2000 to 2004 (%)
Year house built - Built 1990 to 1999 (%)
Year house built - Built 1980 to 1989 (%)
Year house built - Built 1970 to 1979 (%)
Year house built - Built 1960 to 1969 (%)
Year house built - Built 1950 to 1959 (%)
Year house built - Built 1940 to 1949 (%)
Year house built - Built 1939 or earlier (%)
Average household size
Household density (households per square mile)
Average household size - White
Average household size - Black or African American
Average household size - Asian
Average household size - Hispanic or Latino
Average household size - American Indian and Alaska Native
Average household size - Multirace
Average household size - Other Race
Occupied housing units (%)
Vacant housing units (%)
Owner occupied housing units (%)
Renter occupied housing units (%)
Vacancy status - For rent (%)
Vacancy status - For sale only (%)
Vacancy status - Rented or sold, not occupied (%)
Vacancy status - For seasonal, recreational, or occasional use (%)
Vacancy status - For migrant workers (%)
Vacancy status - Other vacant (%)
Residents with income below the poverty level (%)
Residents with income below 50% of the poverty level (%)
Children below poverty level (%)
Poor families by family type - Married-couple family (%)
Poor families by family type - Male, no wife present (%)
Poor families by family type - Female, no husband present (%)
Poverty status for native-born residents (%)
Poverty status for foreign-born residents (%)
Poverty among high school graduates not in families (%)
Poverty among people who did not graduate high school not in families (%)
Residents with income below the poverty level (%) - White
Residents with income below the poverty level (%) - Black or African American
Residents with income below the poverty level (%) - Asian
Residents with income below the poverty level (%) - Hispanic or Latino
Residents with income below the poverty level (%) - American Indian and Alaska Native
Residents with income below the poverty level (%) - Multirace
Residents with income below the poverty level (%) - Other Race
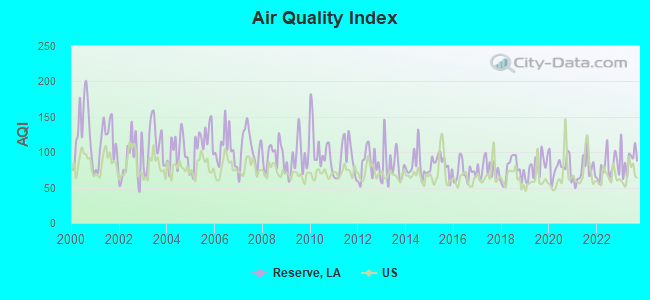
Air pollution - Air Quality Index (AQI)
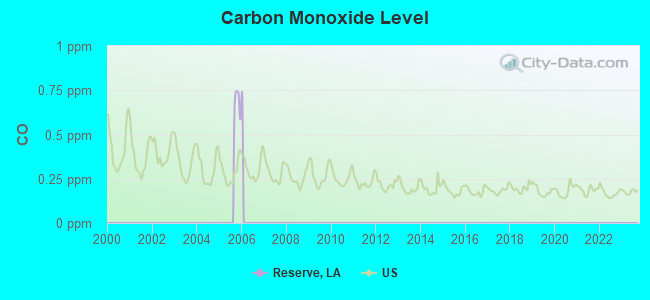
Air pollution - CO
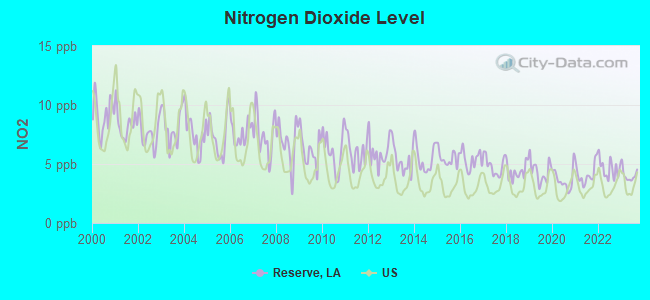
Air pollution - NO2
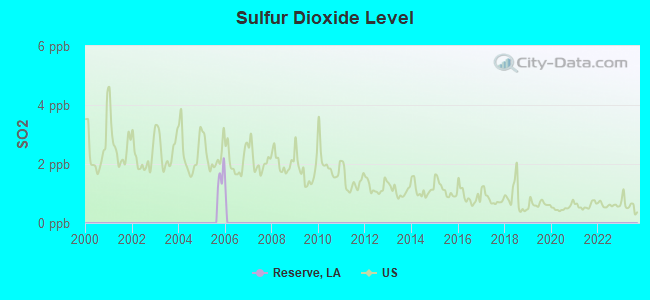
Air pollution - SO2
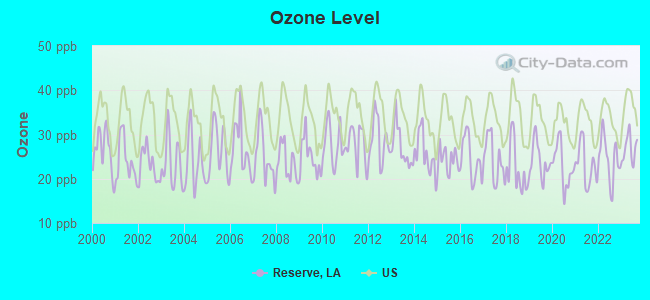
Air pollution - Ozone
Air pollution - PM10
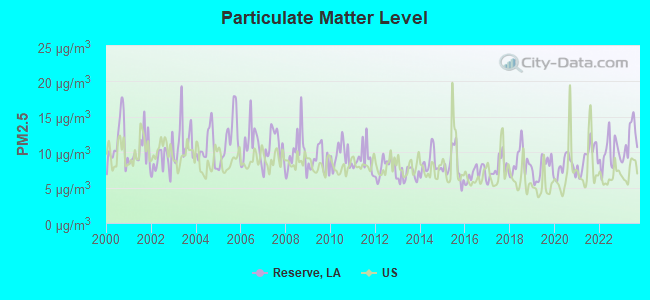
Air pollution - PM25
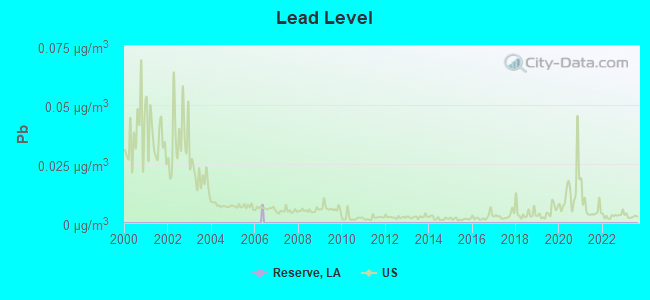
Air pollution - Pb
Crime - Murders per 100,000 population
Crime - Rapes per 100,000 population
Crime - Robberies per 100,000 population
Crime - Assaults per 100,000 population
Crime - Burglaries per 100,000 population
Crime - Thefts per 100,000 population
Crime - Auto thefts per 100,000 population
Crime - Arson per 100,000 population
Crime - City-data.com crime index
Crime - Violent crime index
Crime - Property crime index
Crime - Murders per 100,000 population (5 year average)
Crime - Rapes per 100,000 population (5 year average)
Crime - Robberies per 100,000 population (5 year average)
Crime - Assaults per 100,000 population (5 year average)
Crime - Burglaries per 100,000 population (5 year average)
Crime - Thefts per 100,000 population (5 year average)
Crime - Auto thefts per 100,000 population (5 year average)
Crime - Arson per 100,000 population (5 year average)
Crime - City-data.com crime index (5 year average)
Crime - Violent crime index (5 year average)
Crime - Property crime index (5 year average)
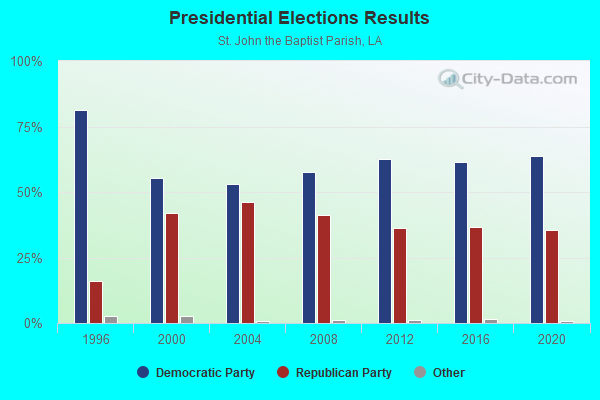
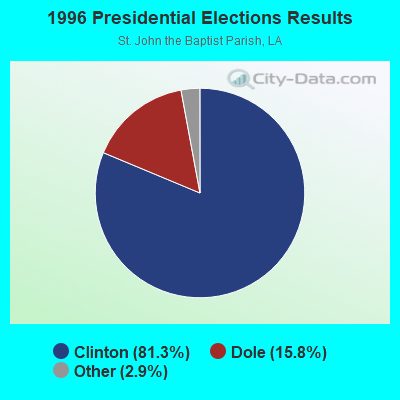
1996 Presidential Elections Results (%) - Democratic Party (Clinton)
1996 Presidential Elections Results (%) - Republican Party (Dole)
1996 Presidential Elections Results (%) - Other
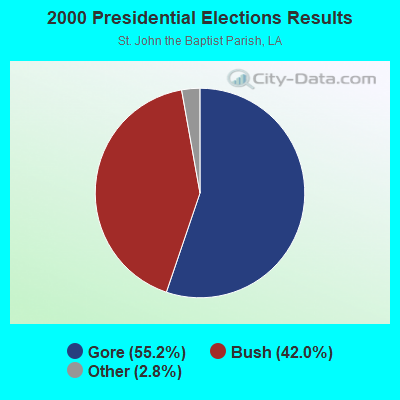
2000 Presidential Elections Results (%) - Democratic Party (Gore)
2000 Presidential Elections Results (%) - Republican Party (Bush)
2000 Presidential Elections Results (%) - Other
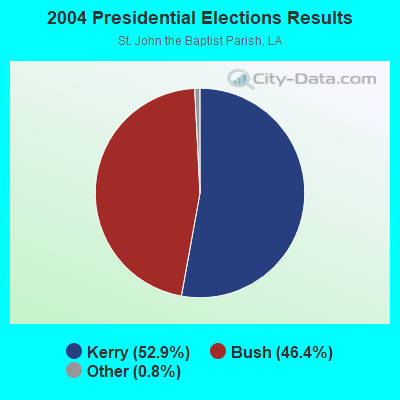
2004 Presidential Elections Results (%) - Democratic Party (Kerry)
2004 Presidential Elections Results (%) - Republican Party (Bush)
2004 Presidential Elections Results (%) - Other
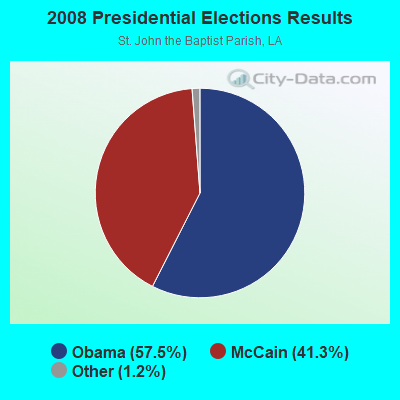
2008 Presidential Elections Results (%) - Democratic Party (Obama)
2008 Presidential Elections Results (%) - Republican Party (McCain)
2008 Presidential Elections Results (%) - Other
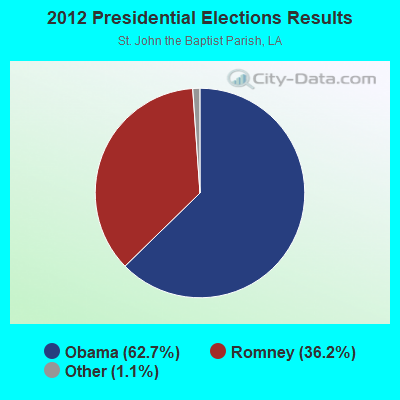
2012 Presidential Elections Results (%) - Democratic Party (Obama)
2012 Presidential Elections Results (%) - Republican Party (Romney)
2012 Presidential Elections Results (%) - Other
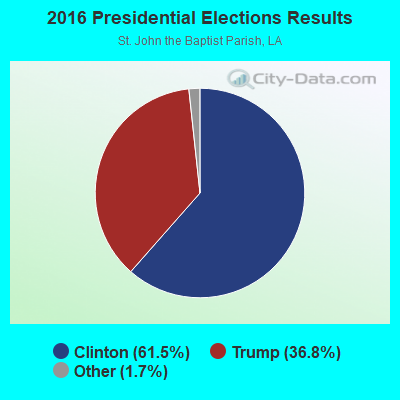
2016 Presidential Elections Results (%) - Democratic Party (Clinton)
2016 Presidential Elections Results (%) - Republican Party (Trump)
2016 Presidential Elections Results (%) - Other
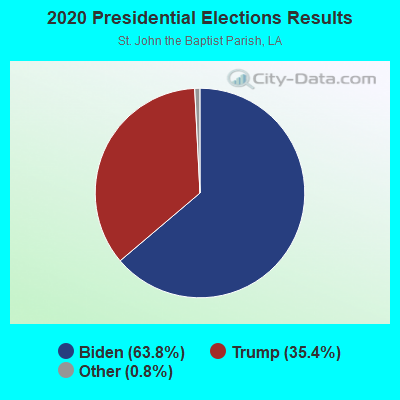
2020 Presidential Elections Results (%) - Democratic Party (Biden)
2020 Presidential Elections Results (%) - Republican Party (Trump)
2020 Presidential Elections Results (%) - Other
Ancestries Reported - Arab (%)
Ancestries Reported - Czech (%)
Ancestries Reported - Danish (%)
Ancestries Reported - Dutch (%)
Ancestries Reported - English (%)
Ancestries Reported - French (%)
Ancestries Reported - French Canadian (%)
Ancestries Reported - German (%)
Ancestries Reported - Greek (%)
Ancestries Reported - Hungarian (%)
Ancestries Reported - Irish (%)
Ancestries Reported - Italian (%)
Ancestries Reported - Lithuanian (%)
Ancestries Reported - Norwegian (%)
Ancestries Reported - Polish (%)
Ancestries Reported - Portuguese (%)
Ancestries Reported - Russian (%)
Ancestries Reported - Scotch-Irish (%)
Ancestries Reported - Scottish (%)
Ancestries Reported - Slovak (%)
Ancestries Reported - Subsaharan African (%)
Ancestries Reported - Swedish (%)
Ancestries Reported - Swiss (%)
Ancestries Reported - Ukrainian (%)
Ancestries Reported - United States (%)
Ancestries Reported - Welsh (%)
Ancestries Reported - West Indian (%)
Ancestries Reported - Other (%)
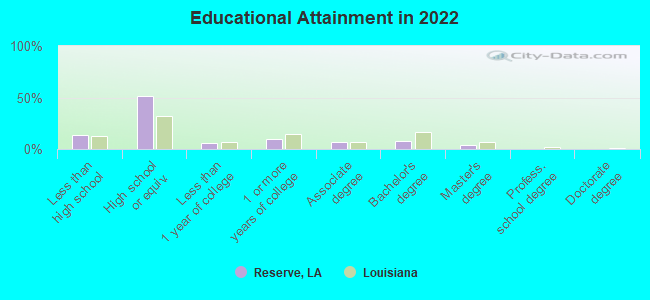
Educational Attainment - No schooling completed (%)
Educational Attainment - Less than high school (%)
Educational Attainment - High school or equivalent (%)
Educational Attainment - Less than 1 year of college (%)
Educational Attainment - 1 or more years of college (%)
Educational Attainment - Associate degree (%)
Educational Attainment - Bachelor's degree (%)
Educational Attainment - Master's degree (%)
Educational Attainment - Professional school degree (%)
Educational Attainment - Doctorate degree (%)
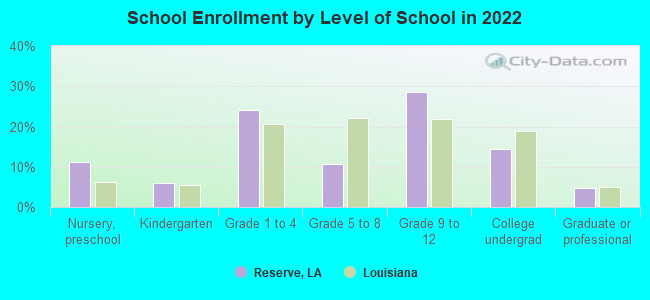
School Enrollment - Nursery, preschool (%)
School Enrollment - Kindergarten (%)
School Enrollment - Grade 1 to 4 (%)
School Enrollment - Grade 5 to 8 (%)
School Enrollment - Grade 9 to 12 (%)
School Enrollment - College undergrad (%)
School Enrollment - Graduate or professional (%)
School Enrollment - Not enrolled in school (%)
School enrollment - Public schools (%)
School enrollment - Private schools (%)
School enrollment - Not enrolled (%)
Median number of rooms in houses and condos
Median number of rooms in apartments
Housing units lacking complete plumbing facilities (%)
Housing units lacking complete kitchen facilities (%)
Density of houses
Urban houses (%)
Rural houses (%)
Households with people 60 years and over (%)
Households with people 65 years and over (%)
Households with people 75 years and over (%)
Households with one or more nonrelatives (%)
Households with no nonrelatives (%)
Population in households (%)
Family households (%)
Nonfamily households (%)
Population in families (%)
Family households with own children (%)
Median number of bedrooms in owner occupied houses
Mean number of bedrooms in owner occupied houses
Median number of bedrooms in renter occupied houses
Mean number of bedrooms in renter occupied houses
Median number of vehichles in owner occupied houses
Mean number of vehichles in owner occupied houses
Median number of vehichles in renter occupied houses
Mean number of vehichles in renter occupied houses
Mortgage status - with mortgage (%)
Mortgage status - with second mortgage (%)
Mortgage status - with home equity loan (%)
Mortgage status - with both second mortgage and home equity loan (%)
Mortgage status - without a mortgage (%)
Average family size
Average family size - White
Average family size - Black or African American
Average family size - Asian
Average family size - Hispanic or Latino
Average family size - American Indian and Alaska Native
Average family size - Multirace
Average family size - Other Race
Geographical mobility - Same house 1 year ago (%)
Geographical mobility - Moved within same county (%)
Geographical mobility - Moved from different county within same state (%)
Geographical mobility - Moved from different state (%)
Geographical mobility - Moved from abroad (%)
Place of birth - Born in state of residence (%)
Place of birth - Born in other state (%)
Place of birth - Native, outside of US (%)
Place of birth - Foreign born (%)
Housing units in structures - 1, detached (%)
Housing units in structures - 1, attached (%)
Housing units in structures - 2 (%)
Housing units in structures - 3 or 4 (%)
Housing units in structures - 5 to 9 (%)
Housing units in structures - 10 to 19 (%)
Housing units in structures - 20 to 49 (%)
Housing units in structures - 50 or more (%)
Housing units in structures - Mobile home (%)
Housing units in structures - Boat, RV, van, etc. (%)
House/condo owner moved in on average (years ago)
Renter moved in on average (years ago)
Year householder moved into unit - Moved in 1999 to March 2000 (%)
Year householder moved into unit - Moved in 1995 to 1998 (%)
Year householder moved into unit - Moved in 1990 to 1994 (%)
Year householder moved into unit - Moved in 1980 to 1989 (%)
Year householder moved into unit - Moved in 1970 to 1979 (%)
Year householder moved into unit - Moved in 1969 or earlier (%)
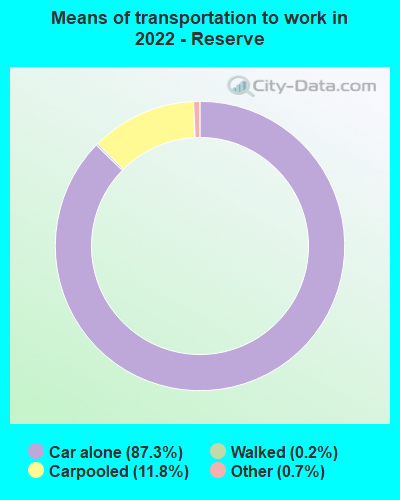
Means of transportation to work - Drove car alone (%)
Means of transportation to work - Carpooled (%)
Means of transportation to work - Public transportation (%)
Means of transportation to work - Bus or trolley bus (%)
Means of transportation to work - Streetcar or trolley car (%)
Means of transportation to work - Subway or elevated (%)
Means of transportation to work - Railroad (%)
Means of transportation to work - Ferryboat (%)
Means of transportation to work - Taxicab (%)
Means of transportation to work - Motorcycle (%)
Means of transportation to work - Bicycle (%)
Means of transportation to work - Walked (%)
Means of transportation to work - Other means (%)
Working at home (%)
Industry diversity
Most Common Industries - Agriculture, forestry, fishing and hunting, and mining (%)
Most Common Industries - Agriculture, forestry, fishing and hunting (%)
Most Common Industries - Mining, quarrying, and oil and gas extraction (%)
Most Common Industries - Construction (%)
Most Common Industries - Manufacturing (%)
Most Common Industries - Wholesale trade (%)
Most Common Industries - Retail trade (%)
Most Common Industries - Transportation and warehousing, and utilities (%)
Most Common Industries - Transportation and warehousing (%)
Most Common Industries - Utilities (%)
Most Common Industries - Information (%)
Most Common Industries - Finance and insurance, and real estate and rental and leasing (%)
Most Common Industries - Finance and insurance (%)
Most Common Industries - Real estate and rental and leasing (%)
Most Common Industries - Professional, scientific, and management, and administrative and waste management services (%)
Most Common Industries - Professional, scientific, and technical services (%)
Most Common Industries - Management of companies and enterprises (%)
Most Common Industries - Administrative and support and waste management services (%)
Most Common Industries - Educational services, and health care and social assistance (%)
Most Common Industries - Educational services (%)
Most Common Industries - Health care and social assistance (%)
Most Common Industries - Arts, entertainment, and recreation, and accommodation and food services (%)
Most Common Industries - Arts, entertainment, and recreation (%)
Most Common Industries - Accommodation and food services (%)
Most Common Industries - Other services, except public administration (%)
Most Common Industries - Public administration (%)
Occupation diversity
Most Common Occupations - Management, business, science, and arts occupations (%)
Most Common Occupations - Management, business, and financial occupations (%)
Most Common Occupations - Management occupations (%)
Most Common Occupations - Business and financial operations occupations (%)
Most Common Occupations - Computer, engineering, and science occupations (%)
Most Common Occupations - Computer and mathematical occupations (%)
Most Common Occupations - Architecture and engineering occupations (%)
Most Common Occupations - Life, physical, and social science occupations (%)
Most Common Occupations - Education, legal, community service, arts, and media occupations (%)
Most Common Occupations - Community and social service occupations (%)
Most Common Occupations - Legal occupations (%)
Most Common Occupations - Education, training, and library occupations (%)
Most Common Occupations - Arts, design, entertainment, sports, and media occupations (%)
Most Common Occupations - Healthcare practitioners and technical occupations (%)
Most Common Occupations - Health diagnosing and treating practitioners and other technical occupations (%)
Most Common Occupations - Health technologists and technicians (%)
Most Common Occupations - Service occupations (%)
Most Common Occupations - Healthcare support occupations (%)
Most Common Occupations - Protective service occupations (%)
Most Common Occupations - Fire fighting and prevention, and other protective service workers including supervisors (%)
Most Common Occupations - Law enforcement workers including supervisors (%)
Most Common Occupations - Food preparation and serving related occupations (%)
Most Common Occupations - Building and grounds cleaning and maintenance occupations (%)
Most Common Occupations - Personal care and service occupations (%)
Most Common Occupations - Sales and office occupations (%)
Most Common Occupations - Sales and related occupations (%)
Most Common Occupations - Office and administrative support occupations (%)
Most Common Occupations - Natural resources, construction, and maintenance occupations (%)
Most Common Occupations - Farming, fishing, and forestry occupations (%)
Most Common Occupations - Construction and extraction occupations (%)
Most Common Occupations - Installation, maintenance, and repair occupations (%)
Most Common Occupations - Production, transportation, and material moving occupations (%)
Most Common Occupations - Production occupations (%)
Most Common Occupations - Transportation occupations (%)
Most Common Occupations - Material moving occupations (%)
People in Group quarters - Institutionalized population (%)
People in Group quarters - Correctional institutions (%)
People in Group quarters - Federal prisons and detention centers (%)
People in Group quarters - Halfway houses (%)
People in Group quarters - Local jails and other confinement facilities (including police lockups) (%)
People in Group quarters - Military disciplinary barracks (%)
People in Group quarters - State prisons (%)
People in Group quarters - Other types of correctional institutions (%)
People in Group quarters - Nursing homes (%)
People in Group quarters - Hospitals/wards, hospices, and schools for the handicapped (%)
People in Group quarters - Hospitals/wards and hospices for chronically ill (%)
People in Group quarters - Hospices or homes for chronically ill (%)
People in Group quarters - Military hospitals or wards for chronically ill (%)
People in Group quarters - Other hospitals or wards for chronically ill (%)
People in Group quarters - Hospitals or wards for drug/alcohol abuse (%)
People in Group quarters - Mental (Psychiatric) hospitals or wards (%)
People in Group quarters - Schools, hospitals, or wards for the mentally retarded (%)
People in Group quarters - Schools, hospitals, or wards for the physically handicapped (%)
People in Group quarters - Institutions for the deaf (%)
People in Group quarters - Institutions for the blind (%)
People in Group quarters - Orthopedic wards and institutions for the physically handicapped (%)
People in Group quarters - Wards in general hospitals for patients who have no usual home elsewhere (%)
People in Group quarters - Wards in military hospitals for patients who have no usual home elsewhere (%)
People in Group quarters - Juvenile institutions (%)
People in Group quarters - Long-term care (%)
People in Group quarters - Homes for abused, dependent, and neglected children (%)
People in Group quarters - Residential treatment centers for emotionally disturbed children (%)
People in Group quarters - Training schools for juvenile delinquents (%)
People in Group quarters - Short-term care, detention or diagnostic centers for delinquent children (%)
People in Group quarters - Type of juvenile institution unknown (%)
People in Group quarters - Noninstitutionalized population (%)
People in Group quarters - College dormitories (includes college quarters off campus) (%)
People in Group quarters - Military quarters (%)
People in Group quarters - On base (%)
People in Group quarters - Barracks, unaccompanied personnel housing (UPH), (Enlisted/Officer), ;and similar group living quarters for military personnel (%)
People in Group quarters - Transient quarters for temporary residents (%)
People in Group quarters - Military ships (%)
People in Group quarters - Group homes (%)
People in Group quarters - Homes or halfway houses for drug/alcohol abuse (%)
People in Group quarters - Homes for the mentally ill (%)
People in Group quarters - Homes for the mentally retarded (%)
People in Group quarters - Homes for the physically handicapped (%)
People in Group quarters - Other group homes (%)
People in Group quarters - Religious group quarters (%)
People in Group quarters - Dormitories (%)
People in Group quarters - Agriculture workers' dormitories on farms (%)
People in Group quarters - Job Corps and vocational training facilities (%)
People in Group quarters - Other workers' dormitories (%)
People in Group quarters - Crews of maritime vessels (%)
People in Group quarters - Other nonhousehold living situations (%)
People in Group quarters - Other noninstitutional group quarters (%)
Residents speaking English at home (%)
Residents speaking English at home - Born in the United States (%)
Residents speaking English at home - Native, born elsewhere (%)
Residents speaking English at home - Foreign born (%)
Residents speaking Spanish at home (%)
Residents speaking Spanish at home - Born in the United States (%)
Residents speaking Spanish at home - Native, born elsewhere (%)
Residents speaking Spanish at home - Foreign born (%)
Residents speaking other language at home (%)
Residents speaking other language at home - Born in the United States (%)
Residents speaking other language at home - Native, born elsewhere (%)
Residents speaking other language at home - Foreign born (%)
Class of Workers - Employee of private company (%)
Class of Workers - Self-employed in own incorporated business (%)
Class of Workers - Private not-for-profit wage and salary workers (%)
Class of Workers - Local government workers (%)
Class of Workers - State government workers (%)
Class of Workers - Federal government workers (%)
Class of Workers - Self-employed workers in own not incorporated business and Unpaid family workers (%)
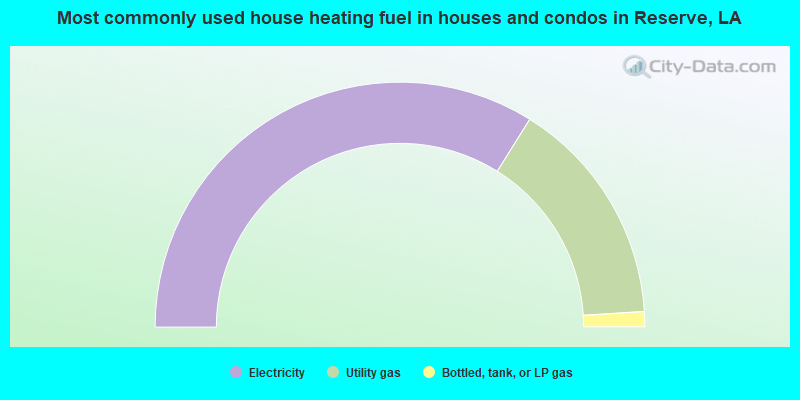
House heating fuel used in houses and condos - Utility gas (%)
House heating fuel used in houses and condos - Bottled, tank, or LP gas (%)
House heating fuel used in houses and condos - Electricity (%)
House heating fuel used in houses and condos - Fuel oil, kerosene, etc. (%)
House heating fuel used in houses and condos - Coal or coke (%)
House heating fuel used in houses and condos - Wood (%)
House heating fuel used in houses and condos - Solar energy (%)
House heating fuel used in houses and condos - Other fuel (%)
House heating fuel used in houses and condos - No fuel used (%)
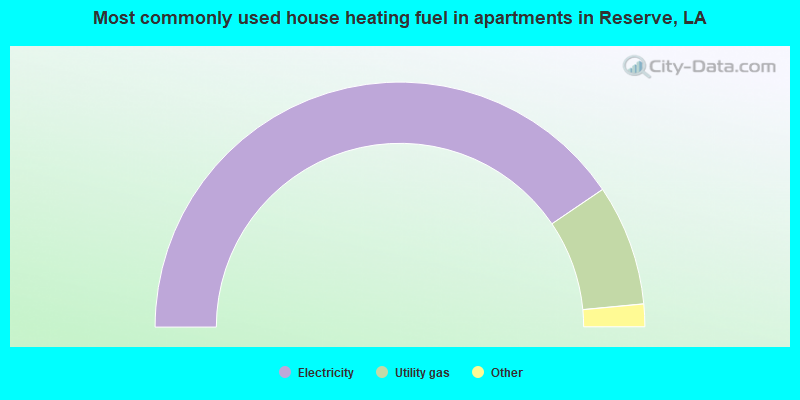
House heating fuel used in apartments - Utility gas (%)
House heating fuel used in apartments - Bottled, tank, or LP gas (%)
House heating fuel used in apartments - Electricity (%)
House heating fuel used in apartments - Fuel oil, kerosene, etc. (%)
House heating fuel used in apartments - Coal or coke (%)
House heating fuel used in apartments - Wood (%)
House heating fuel used in apartments - Solar energy (%)
House heating fuel used in apartments - Other fuel (%)
House heating fuel used in apartments - No fuel used (%)
Armed forces status - In Armed Forces (%)
Armed forces status - Civilian (%)
Armed forces status - Civilian - Veteran (%)
Armed forces status - Civilian - Nonveteran (%)
Read more: https://www.city-data.com/accidents/acc-Addison-Illinois.html
Fatal accidents locations in years 2005-2022
Fatal accidents locations in 2022
Fatal accidents locations in 2021
Fatal accidents locations in 2020
Fatal accidents locations in 2019
Fatal accidents locations in 2018
Fatal accidents locations in 2017
Fatal accidents locations in 2016
Fatal accidents locations in 2015
Fatal accidents locations in 2014
Fatal accidents locations in 2013
Fatal accidents locations in 2012
Fatal accidents locations in 2011
Fatal accidents locations in 2010
Fatal accidents locations in 2009
Fatal accidents locations in 2008
Fatal accidents locations in 2007
Fatal accidents locations in 2006
Fatal accidents locations in 2005
Alcohol use - People drinking some alcohol every month (%)
Alcohol use - People not drinking at all (%)
Alcohol use - Average days/month drinking alcohol
Alcohol use - Average drinks/week
Alcohol use - Average days/year people drink much
Audiometry - Average condition of hearing (%)
Audiometry - People that can hear a whisper from across a quiet room (%)
Audiometry - People that can hear normal voice from across a quiet room (%)
Audiometry - Ears ringing, roaring, buzzing (%)
Audiometry - Had a job exposure to loud noise (%)
Audiometry - Had off-work exposure to loud noise (%)
Blood Pressure & Cholesterol - Has high blood pressure (%)
Blood Pressure & Cholesterol - Checking blood pressure at home (%)
Blood Pressure & Cholesterol - Frequently checking blood cholesterol (%)
Blood Pressure & Cholesterol - Has high cholesterol level (%)
Consumer Behavior - Money monthly spent on food at supermarket/grocery store
Consumer Behavior - Money monthly spent on food at other stores
Consumer Behavior - Money monthly spent on eating out
Consumer Behavior - Money monthly spent on carryout/delivered foods
Consumer Behavior - Income spent on food at supermarket/grocery store (%)
Consumer Behavior - Income spent on food at other stores (%)
Consumer Behavior - Income spent on eating out (%)
Consumer Behavior - Income spent on carryout/delivered foods (%)
Current Health Status - General health condition (%)
Current Health Status - Blood donors (%)
Current Health Status - Has blood ever tested for HIV virus (%)
Current Health Status - Left-handed people (%)
Dermatology - People using sunscreen (%)
Diabetes - Diabetics (%)
Diabetes - Had a blood test for high blood sugar (%)
Diabetes - People taking insulin (%)
Diet Behavior & Nutrition - Diet health (%)
Diet Behavior & Nutrition - Milk product consumption (# of products/month)
Diet Behavior & Nutrition - Meals not home prepared (#/week)
Diet Behavior & Nutrition - Meals from fast food or pizza place (#/week)
Diet Behavior & Nutrition - Ready-to-eat foods (#/month)
Diet Behavior & Nutrition - Frozen meals/pizza (#/month)
Drug Use - People that ever used marijuana or hashish (%)
Drug Use - Ever used hard drugs (%)
Drug Use - Ever used any form of cocaine (%)
Drug Use - Ever used heroin (%)
Drug Use - Ever used methamphetamine (%)
Health Insurance - People covered by health insurance (%)
Kidney Conditions-Urology - Avg. # of times urinating at night
Medical Conditions - People with asthma (%)
Medical Conditions - People with anemia (%)
Medical Conditions - People with psoriasis (%)
Medical Conditions - People with overweight (%)
Medical Conditions - Elderly people having difficulties in thinking or remembering (%)
Medical Conditions - People who ever received blood transfusion (%)
Medical Conditions - People having trouble seeing even with glass/contacts (%)
Medical Conditions - People with arthritis (%)
Medical Conditions - People with gout (%)
Medical Conditions - People with congestive heart failure (%)
Medical Conditions - People with coronary heart disease (%)
Medical Conditions - People with angina pectoris (%)
Medical Conditions - People who ever had heart attack (%)
Medical Conditions - People who ever had stroke (%)
Medical Conditions - People with emphysema (%)
Medical Conditions - People with thyroid problem (%)
Medical Conditions - People with chronic bronchitis (%)
Medical Conditions - People with any liver condition (%)
Medical Conditions - People who ever had cancer or malignancy (%)
Mental Health - People who have little interest in doing things (%)
Mental Health - People feeling down, depressed, or hopeless (%)
Mental Health - People who have trouble sleeping or sleeping too much (%)
Mental Health - People feeling tired or having little energy (%)
Mental Health - People with poor appetite or overeating (%)
Mental Health - People feeling bad about themself (%)
Mental Health - People who have trouble concentrating on things (%)
Mental Health - People moving or speaking slowly or too fast (%)
Mental Health - People having thoughts they would be better off dead (%)
Oral Health - Average years since last visit a dentist
Oral Health - People embarrassed because of mouth (%)
Oral Health - People with gum disease (%)
Oral Health - General health of teeth and gums (%)
Oral Health - Average days a week using dental floss/device
Oral Health - Average days a week using mouthwash for dental problem
Oral Health - Average number of teeth
Pesticide Use - Households using pesticides to control insects (%)
Pesticide Use - Households using pesticides to kill weeds (%)
Physical Activity - People doing vigorous-intensity work activities (%)
Physical Activity - People doing moderate-intensity work activities (%)
Physical Activity - People walking or bicycling (%)
Physical Activity - People doing vigorous-intensity recreational activities (%)
Physical Activity - People doing moderate-intensity recreational activities (%)
Physical Activity - Average hours a day doing sedentary activities
Physical Activity - Average hours a day watching TV or videos
Physical Activity - Average hours a day using computer
Physical Functioning - People having limitations keeping them from working (%)
Physical Functioning - People limited in amount of work they can do (%)
Physical Functioning - People that need special equipment to walk (%)
Physical Functioning - People experiencing confusion/memory problems (%)
Physical Functioning - People requiring special healthcare equipment (%)
Prescription Medications - Average number of prescription medicines taking
Preventive Aspirin Use - Adults 40+ taking low-dose aspirin (%)
Reproductive Health - Vaginal deliveries (%)
Reproductive Health - Cesarean deliveries (%)
Reproductive Health - Deliveries resulted in a live birth (%)
Reproductive Health - Pregnancies resulted in a delivery (%)
Reproductive Health - Women breastfeeding newborns (%)
Reproductive Health - Women that had a hysterectomy (%)
Reproductive Health - Women that had both ovaries removed (%)
Reproductive Health - Women that have ever taken birth control pills (%)
Reproductive Health - Women taking birth control pills (%)
Reproductive Health - Women that have ever used Depo-Provera or injectables (%)
Reproductive Health - Women that have ever used female hormones (%)
Sexual Behavior - People 18+ that ever had sex (vaginal, anal, or oral) (%)
Sexual Behavior - Males 18+ that ever had vaginal sex with a woman (%)
Sexual Behavior - Males 18+ that ever performed oral sex on a woman (%)
Sexual Behavior - Males 18+ that ever had anal sex with a woman (%)
Sexual Behavior - Males 18+ that ever had any sex with a man (%)
Sexual Behavior - Females 18+ that ever had vaginal sex with a man (%)
Sexual Behavior - Females 18+ that ever performed oral sex on a man (%)
Sexual Behavior - Females 18+ that ever had anal sex with a man (%)
Sexual Behavior - Females 18+ that ever had any kind of sex with a woman (%)
Sexual Behavior - Average age people first had sex
Sexual Behavior - Average number of female sex partners in lifetime (males 18+)
Sexual Behavior - Average number of female vaginal sex partners in lifetime (males 18+)
Sexual Behavior - Average age people first performed oral sex on a woman (18+)
Sexual Behavior - Average number of woman performed oral sex on in lifetime (18+)
Sexual Behavior - Average number of male sex partners in lifetime (males 18+)
Sexual Behavior - Average number of male anal sex partners in lifetime (males 18+)
Sexual Behavior - Average age people first performed oral sex on a man (18+)
Sexual Behavior - Average number of male oral sex partners in lifetime (18+)
Sexual Behavior - People using protection when performing oral sex (%)
Sexual Behavior - Average number of times people have vaginal or anal sex a year
Sexual Behavior - People having sex without condom (%)
Sexual Behavior - Average number of male sex partners in lifetime (females 18+)
Sexual Behavior - Average number of male vaginal sex partners in lifetime (females 18+)
Sexual Behavior - Average number of female sex partners in lifetime (females 18+)
Sexual Behavior - Circumcised males 18+ (%)
Sleep Disorders - Average hours sleeping at night
Sleep Disorders - People that has trouble sleeping (%)
Smoking-Cigarette Use - People smoking cigarettes (%)
Taste & Smell - People 40+ having problems with smell (%)
Taste & Smell - People 40+ having problems with taste (%)
Taste & Smell - People 40+ that ever had wisdom teeth removed (%)
Taste & Smell - People 40+ that ever had tonsils teeth removed (%)
Taste & Smell - People 40+ that ever had a loss of consciousness because of a head injury (%)
Taste & Smell - People 40+ that ever had a broken nose or other serious injury to face or skull (%)
Taste & Smell - People 40+ that ever had two or more sinus infections (%)
Weight - Average height (inches)
Weight - Average weight (pounds)
Weight - Average BMI
Weight - People that are obese (%)
Weight - People that ever were obese (%)
Weight - People trying to lose weight (%)
According to our research of Louisiana and other state lists, there were 15 registered sex offenders living in Reserve, Louisiana as of May 04, 2025 . The ratio of all residents to sex offenders in Reserve is 635 to 1.The ratio of registered sex offenders to all residents in this city is lower than the state average.
Latest news from Reserve, LA collected exclusively by city-data.com from local newspapers, TV, and radio stations
Ancestries: American (6.1%), French (5.8%), German (1.9%), English (1.7%), French Canadian (1.3%).
Current Local Time:
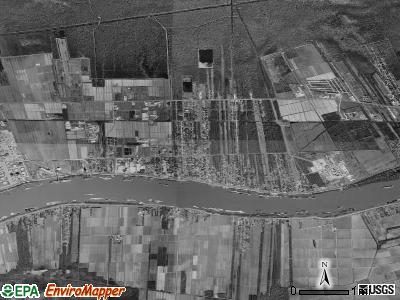
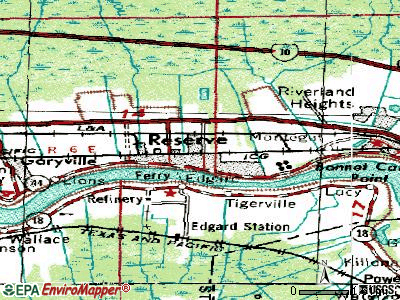
Land area: 16.1 square miles.
Population density: 608 people per square mile (low).
424 residents are foreign born (5.2% Latin America ).
This place:
5.7%Louisiana:
4.7%
Median real estate property taxes paid for housing units with mortgages in 2023: $809 (0.5%)Median real estate property taxes paid for housing units with no mortgage in 2023: $473 (0.3%)
Nearest city with pop. 50,000+: Kenner, LA
Nearest city with pop. 200,000+: New Orleans, LA
Nearest city with pop. 1,000,000+: Houston, TX
Nearest cities:
Taft, LA (2.9 miles)
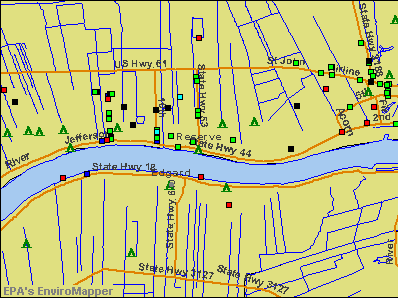
Latitude: 30.06 N, Longitude: 90.55 W
Daytime population change due to commuting: +2,393 (+32.4%)Workers who live and work in this place: 620 (18.7%)
Unemployment in November 2024:
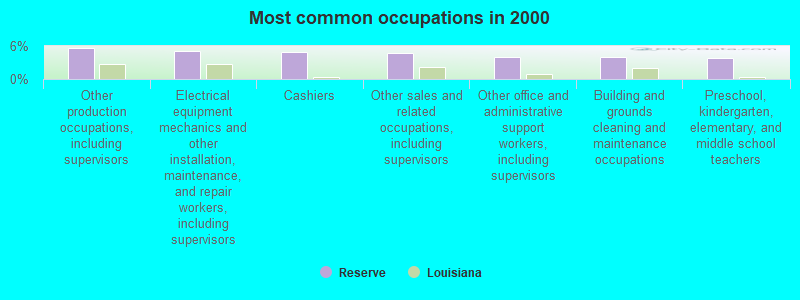
Most common occupations in Reserve, LA (%)
Both Males Females
Other production occupations, including supervisors (5.7%)
Electrical equipment mechanics and other installation, maintenance, and repair workers, including supervisors (5.0%)
Cashiers (5.0%)
Other sales and related occupations, including supervisors (4.7%)
Other office and administrative support workers, including supervisors (4.0%)
Building and grounds cleaning and maintenance occupations (4.0%)
Preschool, kindergarten, elementary, and middle school teachers (3.9%)
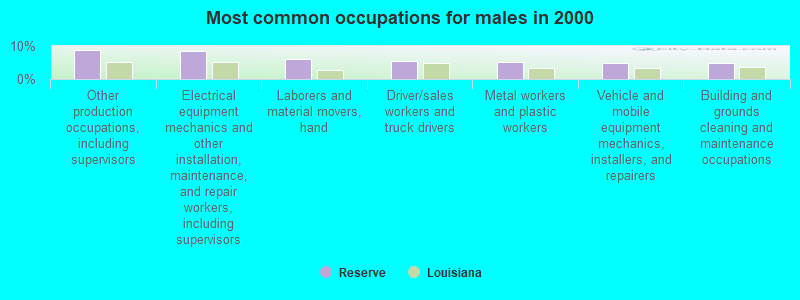
Other production occupations, including supervisors (8.8%)
Electrical equipment mechanics and other installation, maintenance, and repair workers, including supervisors (8.4%)
Laborers and material movers, hand (5.9%)
Driver/sales workers and truck drivers (5.6%)
Metal workers and plastic workers (5.1%)
Vehicle and mobile equipment mechanics, installers, and repairers (4.9%)
Building and grounds cleaning and maintenance occupations (4.8%)
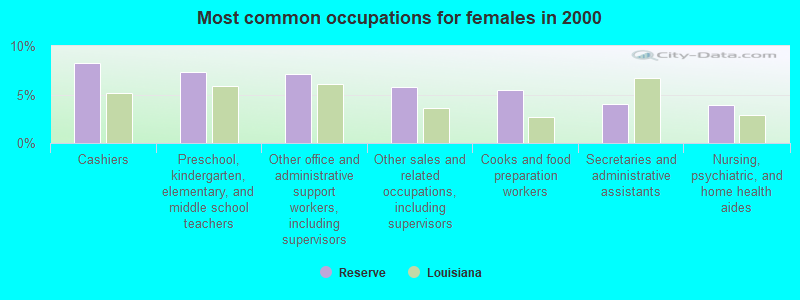
Cashiers (8.2%)
Preschool, kindergarten, elementary, and middle school teachers (7.3%)
Other office and administrative support workers, including supervisors (7.2%)
Other sales and related occupations, including supervisors (5.8%)
Cooks and food preparation workers (5.5%)
Secretaries and administrative assistants (4.1%)
Nursing, psychiatric, and home health aides (4.0%)
Tornado activity:
Reserve-area historical tornado activity is slightly below Louisiana state average. It is 38% greater than the overall U.S. average.
On 12/6/1983, a category F4 (max. wind speeds 207-260 mph) tornado 2.1 miles away from the Reserve place center injured 25 people and caused between $5,000,000 and $50,000,000 in damages.
On 8/25/1992, a category F3 (max. wind speeds 158-206 mph) tornado 5.6 miles away from the place center killed 2 people and injured 32 people and caused between $5,000,000 and $50,000,000 in damages.
Earthquake activity:
Reserve-area historical earthquake activity is significantly above Louisiana state average. It is 52% smaller than the overall U.S. average. On 9/10/2006 at 14:56:08, a magnitude 5.9 (5.9 MB, 5.5 MS, 5.8 MW, Class: Moderate, Intensity: VI - VII) earthquake occurred 356.0 miles away from the city center On 10/24/1997 at 08:35:17, a magnitude 4.9 (4.8 MB, 4.2 MS, 4.9 LG, Depth: 6.2 mi, Class: Light, Intensity: IV - V) earthquake occurred 208.7 miles away from the city center On 5/6/2018 at 16:47:09, a magnitude 4.6 (4.6 MB, Depth: 6.2 mi) earthquake occurred 189.4 miles away from Reserve center On 5/17/2012 at 08:12:00, a magnitude 4.8 (4.8 MW, Depth: 3.1 mi) earthquake occurred 260.3 miles away from the city center On 6/30/1994 at 01:08:24, a magnitude 4.2 (4.2 MB, Depth: 6.2 mi) earthquake occurred 150.5 miles away from the city center On 1/18/1999 at 07:00:53, a magnitude 4.8 (4.8 MB, 4.0 LG, Depth: 0.6 mi) earthquake occurred 301.8 miles away from the city center Magnitude types: regional Lg-wave magnitude (LG), body-wave magnitude (MB), surface-wave magnitude (MS), moment magnitude (MW) Natural disasters: The number of natural disasters in St. John the Baptist Parish (21) is near the US average (19).Major Disasters (Presidential) Declared: 2Hurricanes: 8, Tropical Storms: 7, Winter Storms: 2, Flood: 1, Storm: 1, Other: 3 (Note: some incidents may be assigned to more than one category). Hospitals and medical centers in Reserve: CAPITAL HLTH SVCS OF SO LA (553 CENTRAL AVE)
SOUTHEAST LOUISIANA WAR VETERANS HOME (4080 W AIRLINE HWY)
Other hospitals and medical centers near Reserve: DAVITA - RIVER PARISHES DIALYSIS (Dialysis Facility, about 2 miles away; LA PLACE, LA)
LAPLACE DIALYSIS CTR (Dialysis Facility, about 3 miles away; LA PLACE, LA)
METRO PREFERRED HOME CARE (Home Health Center, about 3 miles away; LAPLACE, LA)
INTERLINK HEALTH CARE SERVICES INC (Home Health Center, about 3 miles away; LA PLACE, LA)
RIVER PARISHES HOSPITAL (about 3 miles away; LAPLACE, LA)
TWIN OAKS NURSING HOME (Nursing Home, about 3 miles away; LA PLACE, LA)
MAGNOLIA COMMUNITY HOME (Hospital, about 3 miles away; LAPLACE, LA)
Airports located in Reserve: Operable nuclear power plant near Reserve:
9 miles: Waterford 3 in Taft, LA.
Colleges/universities with over 2000 students nearest to Reserve:
Nicholls State University (about 24 miles; Thibodaux, LA ; Full-time enrollment: 5,997)
Tulane University of Louisiana (about 28 miles; New Orleans, LA ; FT enrollment: 11,089)
Loyola University New Orleans (about 28 miles; New Orleans, LA ; FT enrollment: 3,912)
Delgado Community College (about 28 miles; New Orleans, LA ; FT enrollment: 12,843)
Xavier University of Louisiana (about 28 miles; New Orleans, LA ; FT enrollment: 2,492)
University of New Orleans (about 30 miles; New Orleans, LA ; FT enrollment: 8,201)
Southeastern Louisiana University (about 32 miles; Hammond, LA ; FT enrollment: 12,713)
Public high school in Reserve:
Private high school in Reserve:
Public elementary/middle school in Reserve:
Private elementary/middle schools in Reserve: ST PETER SCHOOL Students: 134, Location: 188 W 7TH ST, Grades: PK-8)
OUR LADY OF GRACE SCHOOL Students: 123, Location: 780 HIGHWAY 44, Grades: PK-8)
LIFEHOUSE DANIEL ACADEMY Students: 75, Location: 3556 W AIRLINE HWY, Grades: PK-8)
See full list of schools located in Reserve
Notable locations in Reserve: (A) , Sunnyside Plantation (B) , Terre Haute Plantation (C) , Reserve Station (D) , Sunnyside Plantation (E) , Reserve Landing (F) , Saint John the Baptist Parish Health Unit (G) , Saint John the Baptist Parish Library Reserve Branch (H) , Reserve Volunteer Fire Department Station 64 (I) , Reserve Volunteer Fire Department Station 63 (J) , Reserve Volunteer Fire Department Station 62 (K) , Reserve Volunteer Fire Department Station 61 (L) , Southeast Louisiana War Veterans Home (M) . Display/hide their locations on the map
Churches in Reserve include: (A) , Global Maritime Ministries (B) , Greater New Plymouth Rock Baptist Church (C) , First Baptist Church of Reserve (D) , Bethlehem Baptist Church (E) , Beechgrove Baptist Church (F) , Saint Peter Catholic Church (G) , Our Lady of Grace Church (H) , New Pilgrim Baptist Church (I) . Display/hide their locations on the map
St. John the Baptist Parish has a predicted average indoor radon screening level less than 2 pCi/L (pico curies per liter) - Low Potential Average household size: This place:
2.9 peopleLouisiana:
2.5 people
Percentage of family households: This place:
74.6%Whole state:
67.1%
Percentage of households with unmarried partners: This place:
7.3%Whole state:
6.8%
Likely homosexual households (counted as self-reported same-sex unmarried-partner households)
Lesbian couples: 0.4% of all households Gay men: 0.2% of all households
146 people in nursing facilities/skilled-nursing facilities in 2010people in other noninstitutional facilities in 2010people in homes for the mentally retarded in 2000people in religious group quarters in 2000
Banks with branches in Reserve (2011 data):
Capital One, National Association: Reserve Branch at 105 West 8th Street, branch established on 1904/08/05. Info updated 2011/07/01: Bank assets: $133,477.8 mil, Deposits: $97,063.7 mil, headquarters in Mclean, VA, positive income , 984 total offices , Holding Company: Capital One Financial Corporation
For population 15 years and over in Reserve:
Never married: 47.2%Now married: 31.4%Separated: 2.3%Widowed: 5.8%Divorced: 13.3% For population 25 years and over in Reserve:
High school or higher: 84.1%Bachelor's degree or higher: 11.0%Graduate or professional degree: 2.6%Unemployed: 8.8%Mean travel time to work (commute): 23.1 minutes
Education Gini index (Inequality in education) Here:
8.6Louisiana average:
11.9
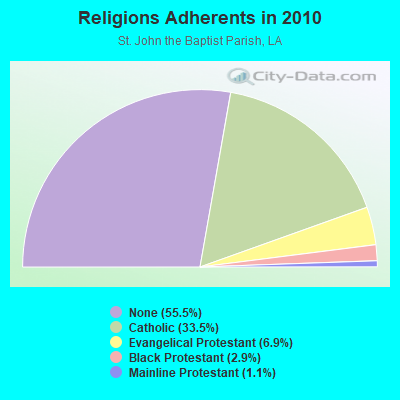
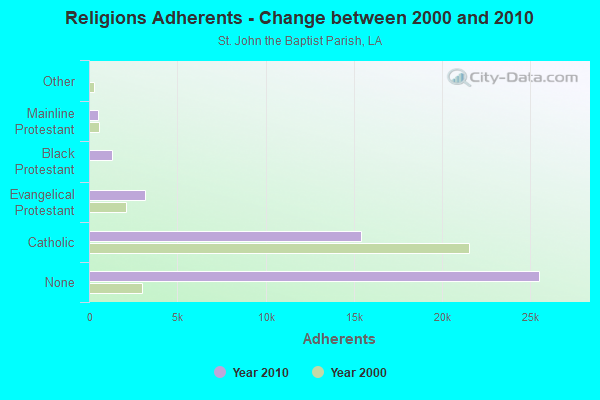
Religion statistics for Reserve, LA (based on St. John the Baptist Parish data)
Religion Adherents Congregations Catholic 15,402 6 Evangelical Protestant 3,170 9 Black Protestant 1,309 6 Mainline Protestant 510 4 Other 26 1 None 25,507 -
Source: Clifford Grammich, Kirk Hadaway, Richard Houseal, Dale E.Jones, Alexei Krindatch, Richie Stanley and Richard H.Taylor. 2012. 2010 U.S.Religion Census: Religious Congregations & Membership Study. Association of Statisticians of American Religious Bodies. Jones, Dale E., et al. 2002. Congregations and Membership in the United States 2000. Nashville, TN: Glenmary Research Center. Graphs represent county-level data
Food Environment Statistics: Number of grocery stores : 8This county :
1.68 / 10,000 pop.Louisiana :
2.56 / 10,000 pop.
Number of convenience stores (no gas) : 4This county :
0.84 / 10,000 pop.Louisiana :
1.29 / 10,000 pop.
Number of convenience stores (with gas) : 17Here :
3.57 / 10,000 pop.Louisiana :
4.49 / 10,000 pop.
Number of full-service restaurants : 26St. John the Baptist Parish :
5.45 / 10,000 pop.Louisiana :
5.92 / 10,000 pop.
Adult diabetes rate : St. John the Baptist Parish :
11.1%Louisiana :
10.9%
Adult obesity rate : St. John the Baptist Parish :
35.2%Louisiana :
29.2%
Low-income preschool obesity rate : St. John the Baptist Parish :
15.1%Louisiana :
13.7%
Health and Nutrition: Healthy diet rate : This city:
48.0%State:
49.4%
Average overall health of teeth and gums : This city:
45.6%Louisiana:
46.5%
People feeling badly about themselves : Here:
19.2%Louisiana:
20.3%
People not drinking alcohol at all : This city:
11.3%State:
11.4%
Average hours sleeping at night : Overweight people : Reserve:
36.3%Louisiana:
34.5%
General health condition : Reserve:
54.6%Louisiana:
55.8%
Average condition of hearing : This city:
81.6%Louisiana:
80.2%
More about Health and Nutrition of Reserve, LA Residents Businesses in Reserve, LA
Strongest AM radio stations in Reserve:
WWL (870 AM; 50 kW; NEW ORLEANS, LA; Owner: ENTERCOM NEW ORLEANS LICENSE, LLC)
WFNO (830 AM; 5 kW; NORCO, LA; Owner: WFNO, L.L.C.)
WLNO (1060 AM; 50 kW; NEW ORLEANS, LA; Owner: COMMUNICOM CO. OF LOUISIANA, L.P.)
WCKW (1010 AM; 0 kW; GARYVILLE, LA; Owner: 222 CORPORATION)
KTIB (640 AM; 5 kW; THIBODAUX, LA; Owner: LA TERR BROADCASTING CORPORATION)
WTIX (690 AM; 10 kW; NEW ORLEANS, LA; Owner: WTIX, INC.)
WYLD (940 AM; 10 kW; NEW ORLEANS, LA; Owner: CLEAR CHANNEL BROADCASTING LICENSES, INC.)
WOMN (1110 AM; daytime; 30 kW; FRANKLINTON, LA; Owner: PITTMAN BROADCASTING SERVICES, LLC.)
WSKR (1210 AM; 10 kW; DENHAM SPRINGS, LA; Owner: CAPSTAR TX LIMITED PARTNERSHIP)
WSMB (1350 AM; 5 kW; NEW ORLEANS, LA; Owner: ENTERCOM NEW ORLEANS LICENSE, LLC)
WSJC (810 AM; 50 kW; MAGEE, MS; Owner: FAMILY TALK RADIO)
WODT (1280 AM; 5 kW; NEW ORLEANS, LA; Owner: CLEAR CHANNEL BROADCASTING LICENSES, INC.)
WVOG (600 AM; 1 kW; NEW ORLEANS, LA; Owner: F.W. ROBERT BROADCASTING CO., INC.)
Strongest FM radio stations in Reserve:
KSTE-FM (104.1 FM; HOUMA, LA; Owner: CLEAR CHANNEL BROADCASTING LICENSES, INC.)
WCKW-FM (92.3 FM; LAPLACE, LA; Owner: 222 CORPORATION)
WPRF (94.9 FM; RESERVE, LA; Owner: CITADEL BROADCASTING COMPANY)
WBBE (103.3 FM; HAMMOND, LA; Owner: CITADEL BROADCASTING COMPANY)
WQUE-FM (93.3 FM; NEW ORLEANS, LA; Owner: CLEAR CHANNEL BROADCASTING LICENSES, INC.)
WFMF (102.5 FM; BATON ROUGE, LA; Owner: CAPSTAR TX LIMITED PARTNERSHIP)
WYPY (100.7 FM; BATON ROUGE, LA; Owner: GUARANTY BROADCASTING COMPANY OF BATON ROUGE, LLC)
WYLD-FM (98.5 FM; NEW ORLEANS, LA; Owner: CLEAR CHANNEL BROADCASTING LICENSES, INC.)
WDGL (98.1 FM; BATON ROUGE, LA; Owner: GUARANTY BROADCASTING COMPANY OF BATON ROUGE, LLC)
WLMG (101.9 FM; NEW ORLEANS, LA; Owner: ENTERCOM NEW ORLEANS LICENSE, LLC)
WEZB (97.1 FM; NEW ORLEANS, LA; Owner: ENTERCOM NEW ORLEANS LICENSE, LLC)
WTKL (95.7 FM; NEW ORLEANS, LA; Owner: ENTERCOM NEW ORLEANS LICENSE, LLC)
KCIL (107.5 FM; HOUMA, LA; Owner: GUARANTY BROADCASTING COMPANY OF HOUMA, LLC)
WYNK-FM (101.5 FM; BATON ROUGE, LA; Owner: CAPSTAR TX LIMITED PARTNERSHIP)
KLRZ (100.3 FM; LAROSE, LA; Owner: COASTAL BROADCASTING OF LAROSE, INC.)
WNOE-FM (101.1 FM; NEW ORLEANS, LA; Owner: CLEAR CHANNEL BROADCASTING LICENSES, INC.)
WRNO-FM (99.5 FM; NEW ORLEANS, LA; Owner: CLEAR CHANNEL BROADCASTING LICENSES, INC.)
WTIX-FM (94.3 FM; GALLIANO, LA; Owner: FLEUR DE LIS BROADCASTING, INC.)
WKZN (105.3 FM; KENNER, LA; Owner: ENTERCOM NEW ORLEANS LICENSE, LLC)
WWNO (89.9 FM; NEW ORLEANS, LA; Owner: LOUISIANA STATE UNIV & A & M COLLEGE)
TV broadcast stations around Reserve:
WBRZ-TV (Channel 2; BATON ROUGE, LA; Owner: LOUISIANA TELEVISION BROADCASTING, LLC)
WAFB (Channel 9; BATON ROUGE, LA; Owner: WAFB, L.L.C)
WGMB (Channel 44; BATON ROUGE, LA; Owner: COMCORP OF BATON ROUGE LICENSE CORP.)
WVLA (Channel 33; BATON ROUGE, LA; Owner: KNIGHT BROADCASTING OF BATON ROUGE LIC. CORP.)
WWL-TV (Channel 4; NEW ORLEANS, LA; Owner: WWL-TV, INC.)
WLPN-LP (Channel 61; NEW ORLEANS, LA; Owner: GLENN R. & KARIN A. PLUMMER)
WHNO (Channel 20; NEW ORLEANS, LA; Owner: LESEA BROADCASTING CORPORATION)
WLAE-TV (Channel 32; NEW ORLEANS, LA; Owner: EDUCATIONAL BROADCASTING FOUNDATION, INC.)
WGNO (Channel 26; NEW ORLEANS, LA; Owner: TRIBUNE TELEVISION NEW ORLEANS, INC.)
WNOL-TV (Channel 38; NEW ORLEANS, LA; Owner: TRIBUNE TELEVISION NEW ORLEANS, INC.)
WYES-TV (Channel 12; NEW ORLEANS, LA; Owner: GREATER NEW ORLEANS ED TV FOUNDATION)
WBXN-CA (Channel 10; NEW ORLEANS, LA; Owner: THE BOX WORLDWIDE LLC)
WVUE (Channel 8; NEW ORLEANS, LA; Owner: EMMIS TELEIVISION LICENSE CORPORATION)
K66FW (Channel 14; NEW ORLEANS, LA; Owner: VENTANA TELEVISION, INC.)
WPXL (Channel 49; NEW ORLEANS, LA; Owner: FLINN BROADCASTING CORPORATION)
KNOV-LP (Channel 57; NEW ORLEANS, LA; Owner: BEACH TV PROPERTIES, INC.)
WDSU (Channel 6; NEW ORLEANS, LA; Owner: NEW ORLEANS HEARST-ARGYLE TELEVISION, INC.)
WLPB-TV (Channel 27; BATON ROUGE, LA; Owner: LOUISIANA EDUCATIONAL TELEVISION AUTHORITY)
WUPL (Channel 54; SLIDELL, LA; Owner: UPN TELEVISION STATIONS INC.)
WTNO-LP (Channel 36; NEW ORLEANS, LA; Owner: TIGER EYE BROADCASTING CORPORATION)
National Bridge Inventory (NBI) Statistics 2 Number of bridges3,747ft / 1,142m Total length71,625 Total average daily traffic17,905 Total average daily truck traffic78,787 Total future (year 2041) average daily traffic
FCC Registered Antenna Towers: 64 (
See the full list of FCC Registered Antenna Towers in Reserve )
FCC Registered Broadcast Land Mobile Towers: 20 (
See the full list of FCC Registered Broadcast Land Mobile Towers in Reserve, LA )
FCC Registered Microwave Towers: 12 (
See the full list of FCC Registered Microwave Towers in this town )
FCC Registered Maritime Coast & Aviation Ground Towers: 8 (
See the full list of FCC Registered Maritime Coast & Aviation Ground Towers )
FCC Registered Amateur Radio Licenses: 4
Call Sign: KB5AYO, Licensee ID: L00407516, Grant Date: 03/07/2023, Expiration Date: 06/01/2033, Certifier: Glenn J Torres, Registrant: Glenn J Torres, 246 Central Ave, Reserve, LA 70084-6002Call Sign: KC5AVL, Grant Date: 05/25/1993, Expiration Date: 05/25/2003, Cancellation Date: 05/26/2005, Registrant: James H Hardeman Iii, Reserve, LA 70084Call Sign: KC5STQ, Licensee ID: L00909904, Grant Date: 12/23/2005, Expiration Date: 02/14/2016, Cancellation Date: 02/15/2018, Registrant: Ryan J Millet, 208 East 1st Street, Reserve, LA 70084Call Sign: KE5LBY, Licensee ID: L01206688, Grant Date: 10/26/2006, Expiration Date: 10/26/2016, Cancellation Date: 10/27/2018, Certifier: Chad M Duhe, Registrant: Chad M Duhe, 128 Hickory St, Reserve, LA 70084FAA Registered Aircraft: 5
Aircraft: PIPER J3C-65 (Category: Land, Seats: 2, Weight: Up to 12,499 Pounds, Speed: 67 mph), Engine: CONT MOTOR C85 SERIES (85 HP) (Reciprocating)N-Number: 141TE, N141TE, N-141TE, Serial Number: 17311, Year manufactured: 1946, Airworthiness Date: 02/11/2004, Certificate Issue Date: 06/09/2009Registrant (LLC): B-N-K2 LLC, 268 Airport Rd, Reserve, LA 70084Aircraft: PIPER PA 46-350P (Category: Land, Seats: 6, Weight: Up to 12,499 Pounds), Engine: LYCOMING TIO 540 SER (250 HP) (Reciprocating)N-Number: 4160T, N4160T, N-4160T, Serial Number: 4636261, Year manufactured: 2000, Airworthiness Date: 02/24/2000, Certificate Issue Date: 06/18/2009Registrant (Individual): Ferrell J Lasseigne, Po Box 2604, Reserve, LA 70084Aircraft: PIPER PA-28-180 (Category: Land, Seats: 4, Weight: Up to 12,499 Pounds, Speed: 107 mph), Engine: LYCOMING O&VO-360 SER (180 HP) (Reciprocating)N-Number: 6624J, N6624J, N-6624J, Serial Number: 28-5091, Year manufactured: 1968, Airworthiness Date: 08/20/1968, Certificate Issue Date: 11/14/2016Registrant (LLC): N6624 LLC, 268 Airport Rd, Reserve, LA 70084Aircraft: QUICKSILVER MFG INC SPORT 2S (Category: Land, Seats: 2, Weight: Up to 12,499 Pounds), Engine: ROTAX 582SER (65 HP) (2 Cycle)N-Number: 715AT, N715AT, N-715AT, Serial Number: 0086, Year manufactured: 2006, Airworthiness Date: 01/21/2010, Certificate Issue Date: 10/05/2007Registrant (Corporation): Air-Tech Inc, 268 Airport Rd, Reserve, LA 70084Aircraft: QUICKSILVER MFG GT400 (Category: Land, Weight: Up to 12,499 Pounds), Engine: ROTAX 447 (40 HP) (2 Cycle)N-Number: 939EB, N939EB, N-939EB, Serial Number: 1439, Year manufactured: 2003, Airworthiness Date: 01/26/2010, Certificate Issue Date: 02/05/2013Registrant (Individual): Eugene P Ii Borne, 133 W 8th St, Reserve, LA 70084
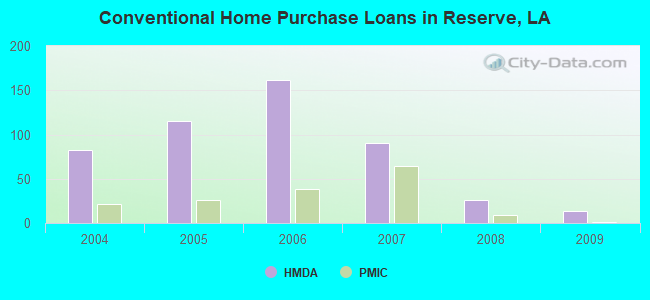
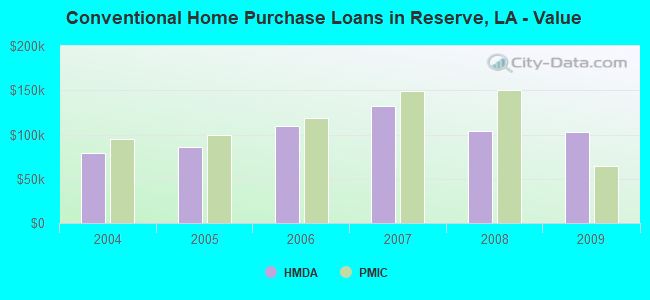
Home Mortgage Disclosure Act Aggregated Statistics For Year 2009(Based on 1 full and 3 partial tracts) A) FHA, FSA/RHS & VA B) Conventional C) Refinancings D) Home Improvement Loans F) Non-occupant Loans on G) Loans On Manufactured Number Average Value Number Average Value Number Average Value Number Average Value Number Average Value Number Average Value
LOANS ORIGINATED 49 $137,157 14 $102,398 95 $116,159 14 $46,045 8 $73,649 3 $24,040 APPLICATIONS APPROVED, NOT ACCEPTED 2 $138,165 2 $209,820 13 $114,317 6 $39,982 2 $68,420 1 $68,640 APPLICATIONS DENIED 14 $140,701 7 $96,100 68 $131,001 31 $41,357 2 $52,210 8 $42,365 APPLICATIONS WITHDRAWN 1 $157,900 3 $156,113 30 $121,255 4 $52,712 3 $93,383 2 $49,165 FILES CLOSED FOR INCOMPLETENESS 1 $169,800 0 $0 8 $144,326 1 $83,200 0 $0 0 $0
Aggregated Statistics For Year 2008(Based on 1 full and 3 partial tracts) A) FHA, FSA/RHS & VA B) Conventional C) Refinancings D) Home Improvement Loans E) Loans on Dwellings For 5+ Families F) Non-occupant Loans on G) Loans On Manufactured Number Average Value Number Average Value Number Average Value Number Average Value Number Average Value Number Average Value Number Average Value
LOANS ORIGINATED 35 $143,033 26 $103,412 106 $106,432 23 $34,387 1 $175,080 18 $91,240 5 $39,622 APPLICATIONS APPROVED, NOT ACCEPTED 3 $63,240 9 $95,189 17 $109,125 5 $39,212 0 $0 2 $140,610 4 $53,208 APPLICATIONS DENIED 8 $117,776 17 $140,180 107 $119,799 49 $50,347 0 $0 9 $135,142 8 $57,804 APPLICATIONS WITHDRAWN 5 $142,480 4 $110,698 27 $121,537 4 $91,342 0 $0 2 $129,255 0 $0 FILES CLOSED FOR INCOMPLETENESS 2 $118,810 0 $0 10 $121,257 1 $56,730 0 $0 0 $0 0 $0
Aggregated Statistics For Year 2007(Based on 1 full and 3 partial tracts) A) FHA, FSA/RHS & VA B) Conventional C) Refinancings D) Home Improvement Loans F) Non-occupant Loans on G) Loans On Manufactured Number Average Value Number Average Value Number Average Value Number Average Value Number Average Value Number Average Value
LOANS ORIGINATED 32 $141,233 90 $132,483 137 $109,036 52 $53,073 14 $99,514 6 $20,388 APPLICATIONS APPROVED, NOT ACCEPTED 2 $130,430 21 $96,936 35 $91,151 9 $50,503 5 $95,412 6 $56,825 APPLICATIONS DENIED 6 $137,582 41 $107,881 137 $106,406 60 $59,550 14 $92,933 11 $42,451 APPLICATIONS WITHDRAWN 2 $95,555 14 $105,853 40 $107,386 10 $56,232 2 $54,135 1 $20,000 FILES CLOSED FOR INCOMPLETENESS 3 $134,703 7 $132,427 14 $117,439 2 $103,815 1 $67,330 0 $0
Aggregated Statistics For Year 2006(Based on 1 full and 3 partial tracts) A) FHA, FSA/RHS & VA B) Conventional C) Refinancings D) Home Improvement Loans F) Non-occupant Loans on G) Loans On Manufactured Number Average Value Number Average Value Number Average Value Number Average Value Number Average Value Number Average Value
LOANS ORIGINATED 38 $117,529 162 $109,185 140 $101,316 46 $42,077 40 $83,454 8 $38,838 APPLICATIONS APPROVED, NOT ACCEPTED 1 $125,960 25 $99,127 35 $85,551 8 $72,575 6 $72,562 4 $33,595 APPLICATIONS DENIED 8 $99,631 64 $98,919 153 $99,817 55 $46,823 19 $103,792 14 $34,445 APPLICATIONS WITHDRAWN 3 $141,753 18 $105,301 66 $117,649 7 $90,769 5 $71,474 0 $0 FILES CLOSED FOR INCOMPLETENESS 0 $0 10 $133,287 18 $107,706 1 $61,270 1 $90,000 0 $0
Aggregated Statistics For Year 2005(Based on 1 full and 3 partial tracts) A) FHA, FSA/RHS & VA B) Conventional C) Refinancings D) Home Improvement Loans F) Non-occupant Loans on G) Loans On Manufactured Number Average Value Number Average Value Number Average Value Number Average Value Number Average Value Number Average Value
LOANS ORIGINATED 33 $102,224 115 $85,918 140 $80,843 31 $24,003 38 $70,459 6 $43,357 APPLICATIONS APPROVED, NOT ACCEPTED 1 $99,170 20 $87,606 34 $66,664 6 $24,180 4 $82,828 3 $35,287 APPLICATIONS DENIED 5 $85,490 64 $72,867 204 $82,421 43 $26,665 16 $63,752 24 $42,040 APPLICATIONS WITHDRAWN 3 $101,800 35 $69,894 96 $105,016 15 $91,964 10 $78,102 0 $0 FILES CLOSED FOR INCOMPLETENESS 1 $53,280 6 $93,673 33 $97,302 1 $54,450 0 $0 0 $0
Aggregated Statistics For Year 2004(Based on 1 full and 3 partial tracts) A) FHA, FSA/RHS & VA B) Conventional C) Refinancings D) Home Improvement Loans F) Non-occupant Loans on G) Loans On Manufactured Number Average Value Number Average Value Number Average Value Number Average Value Number Average Value Number Average Value
LOANS ORIGINATED 44 $93,883 83 $78,856 176 $76,915 32 $31,093 38 $74,259 5 $27,888 APPLICATIONS APPROVED, NOT ACCEPTED 2 $73,050 14 $95,756 48 $72,890 11 $29,102 5 $78,132 1 $37,160 APPLICATIONS DENIED 7 $78,907 32 $58,949 198 $76,688 47 $27,223 13 $70,418 14 $36,123 APPLICATIONS WITHDRAWN 6 $101,575 7 $70,856 72 $79,509 4 $77,115 3 $61,337 0 $0 FILES CLOSED FOR INCOMPLETENESS 1 $64,000 0 $0 47 $82,408 0 $0 1 $48,010 1 $99,450
Detailed HMDA statistics for the following Tracts:
0705.00
, 0707.00 , 0708.00 , 0709.00
Private Mortgage Insurance Companies Aggregated Statistics For Year 2009(Based on 1 full and 3 partial tracts) A) Conventional B) Refinancings Number Average Value Number Average Value
LOANS ORIGINATED 1 $64,290 2 $91,605 APPLICATIONS APPROVED, NOT ACCEPTED 0 $0 1 $197,530 APPLICATIONS DENIED 1 $42,360 0 $0 APPLICATIONS WITHDRAWN 0 $0 0 $0 FILES CLOSED FOR INCOMPLETENESS 0 $0 1 $121,200
Aggregated Statistics For Year 2008(Based on 1 full and 3 partial tracts) A) Conventional B) Refinancings C) Non-occupant Loans on Number Average Value Number Average Value Number Average Value
LOANS ORIGINATED 9 $149,994 6 $143,090 1 $109,490 APPLICATIONS APPROVED, NOT ACCEPTED 15 $130,456 5 $133,030 2 $111,190 APPLICATIONS DENIED 2 $59,615 1 $59,720 2 $59,615 APPLICATIONS WITHDRAWN 0 $0 1 $90,000 0 $0 FILES CLOSED FOR INCOMPLETENESS 3 $103,313 1 $71,430 2 $133,200
Aggregated Statistics For Year 2007(Based on 1 full and 3 partial tracts) A) Conventional B) Refinancings C) Non-occupant Loans on Number Average Value Number Average Value Number Average Value
LOANS ORIGINATED 64 $149,325 7 $152,469 2 $55,690 APPLICATIONS APPROVED, NOT ACCEPTED 17 $136,858 1 $141,690 1 $25,720 APPLICATIONS DENIED 1 $87,240 0 $0 0 $0 APPLICATIONS WITHDRAWN 2 $178,580 0 $0 0 $0 FILES CLOSED FOR INCOMPLETENESS 0 $0 0 $0 0 $0
Aggregated Statistics For Year 2006(Based on 1 full and 3 partial tracts) A) Conventional B) Refinancings C) Non-occupant Loans on Number Average Value Number Average Value Number Average Value
LOANS ORIGINATED 38 $118,754 8 $141,555 3 $97,527 APPLICATIONS APPROVED, NOT ACCEPTED 11 $104,414 3 $111,497 0 $0 APPLICATIONS DENIED 1 $94,850 0 $0 0 $0 APPLICATIONS WITHDRAWN 1 $81,970 1 $76,700 1 $76,700 FILES CLOSED FOR INCOMPLETENESS 1 $84,900 0 $0 0 $0
Aggregated Statistics For Year 2005(Based on 1 full and 3 partial tracts) A) Conventional B) Refinancings C) Non-occupant Loans on Number Average Value Number Average Value Number Average Value
LOANS ORIGINATED 26 $99,821 9 $106,183 4 $74,288 APPLICATIONS APPROVED, NOT ACCEPTED 7 $89,270 3 $70,857 3 $81,993 APPLICATIONS DENIED 1 $50,350 0 $0 1 $50,350 APPLICATIONS WITHDRAWN 4 $107,350 1 $48,010 1 $84,900 FILES CLOSED FOR INCOMPLETENESS 1 $55,040 0 $0 0 $0
Aggregated Statistics For Year 2004(Based on 1 full and 3 partial tracts) A) Conventional B) Refinancings C) Non-occupant Loans on Number Average Value Number Average Value Number Average Value
LOANS ORIGINATED 22 $94,484 9 $76,783 6 $85,097 APPLICATIONS APPROVED, NOT ACCEPTED 4 $99,625 7 $101,726 0 $0 APPLICATIONS DENIED 0 $0 0 $0 0 $0 APPLICATIONS WITHDRAWN 2 $60,290 2 $48,530 0 $0 FILES CLOSED FOR INCOMPLETENESS 1 $114,010 0 $0 0 $0
Detailed PMIC statistics for the following Tracts:
0705.00
, 0707.00 , 0708.00 , 0709.00
Most common first names in Reserve, LA among deceased individuals Name Count Lived (average)
Joseph 44 74.0 years Marie 30 79.7 years James 26 73.0 years Henry 24 75.1 years John 22 72.4 years Clarence 20 65.1 years Edward 19 71.4 years Ernest 18 68.5 years Lawrence 17 64.7 years Albert 17 71.4 years
Most common last names in Reserve, LA among deceased individuals Last name Count Lived (average)
Vicknair 58 75.0 years Duhe 42 73.1 years Jacob 38 75.5 years Jones 37 66.3 years Williams 36 73.1 years Cambre 33 75.5 years Johnson 26 65.0 years Scioneaux 26 73.5 years Weber 24 77.1 years Keller 22 78.5 years
Reserve compared to Louisiana state average:
Unemployed percentage below state average. Median age below state average. Length of stay since moving in significantly above state average. Percentage of population with a bachelor's degree or higher below state average.
#46 on the list of "Top 101 cities with largest percentage of females in occupations: fire fighting and prevention workers including supervisors (population 5,000+)"
#51 on the list of "Top 101 cities with largest percentage of females in industries: construction (population 5,000+)"
#98 on the list of "Top 101 cities with the most people born in the same U.S. state as the city (population 5,000+)"
#37 (70084) on the list of "Top 101 zip codes with the largest percentage of French first ancestries (pop 5,000+)"
#60 (70084) on the list of "Top 101 zip codes with the lowest 2012 average reported profit/loss from business (pop 5,000+)"
Top Patent Applicants
Total of 1 patent application in 2008-2025.


 Recent articles from our blog. Our writers, many of them Ph.D. graduates or candidates, create easy-to-read articles on a wide variety of topics.


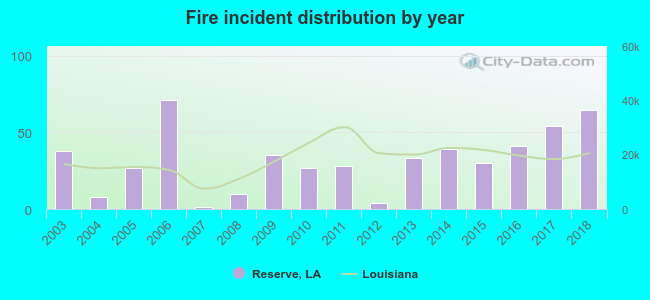 Based on the data from the years 2003 - 2018 the average number of fire incidents per year is 32. The highest number of reported fires - 71 took place in 2006, and the least - 1 in 2007. The data has a rising trend.
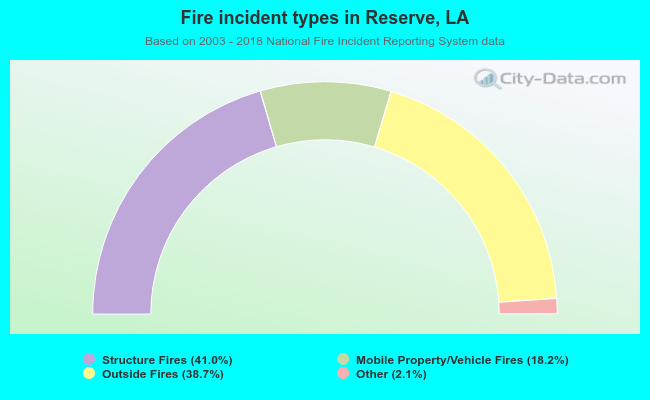 When looking into fire subcategories, the most incidents belonged to: Structure Fires (41.0%), and Outside Fires (38.7%).